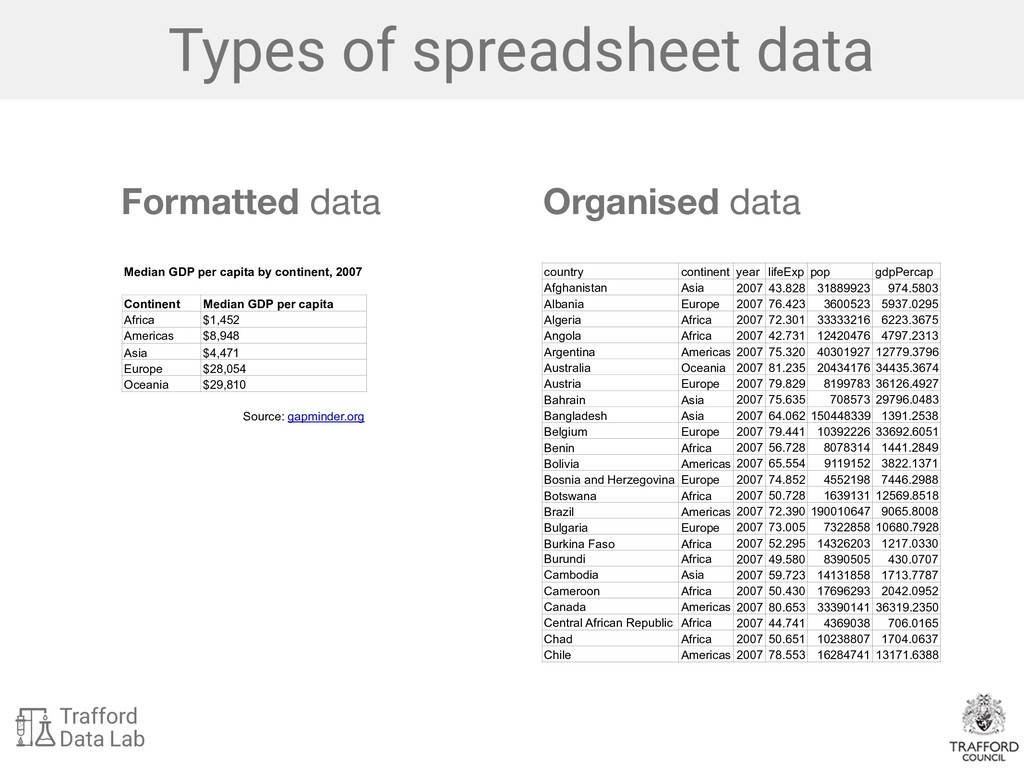
pop gdpPercap Afghanistan Asia 2007 43.828 31889923 974.5803 Albania Europe 2007 76.423 3600523 5937.0295 Algeria Africa 2007 72.301 33333216 6223.3675 Angola Africa 2007 42.731 12420476 4797.2313 Argentina Americas 2007 75.320 40301927 12779.3796 Australia Oceania 2007 81.235 20434176 34435.3674 Austria Europe 2007 79.829 8199783 36126.4927 Bahrain Asia 2007 75.635 708573 29796.0483 Bangladesh Asia 2007 64.062 150448339 1391.2538 Belgium Europe 2007 79.441 10392226 33692.6051 Benin Africa 2007 56.728 8078314 1441.2849 Bolivia Americas 2007 65.554 9119152 3822.1371 Bosnia and Herzegovina Europe 2007 74.852 4552198 7446.2988 Botswana Africa 2007 50.728 1639131 12569.8518 Brazil Americas 2007 72.390 190010647 9065.8008 Bulgaria Europe 2007 73.005 7322858 10680.7928 Burkina Faso Africa 2007 52.295 14326203 1217.0330 Burundi Africa 2007 49.580 8390505 430.0707 Cambodia Asia 2007 59.723 14131858 1713.7787 Cameroon Africa 2007 50.430 17696293 2042.0952 Canada Americas 2007 80.653 33390141 36319.2350 Central African Republic Africa 2007 44.741 4369038 706.0165 Chad Africa 2007 50.651 10238807 1704.0637 Chile Americas 2007 78.553 16284741 13171.6388 Organised data Median GDP per capita by continent, 2007 Continent Median GDP per capita Africa $1,452 Americas $8,948 Asia $4,471 Europe $28,054 Oceania $29,810 Source: gapminder.org
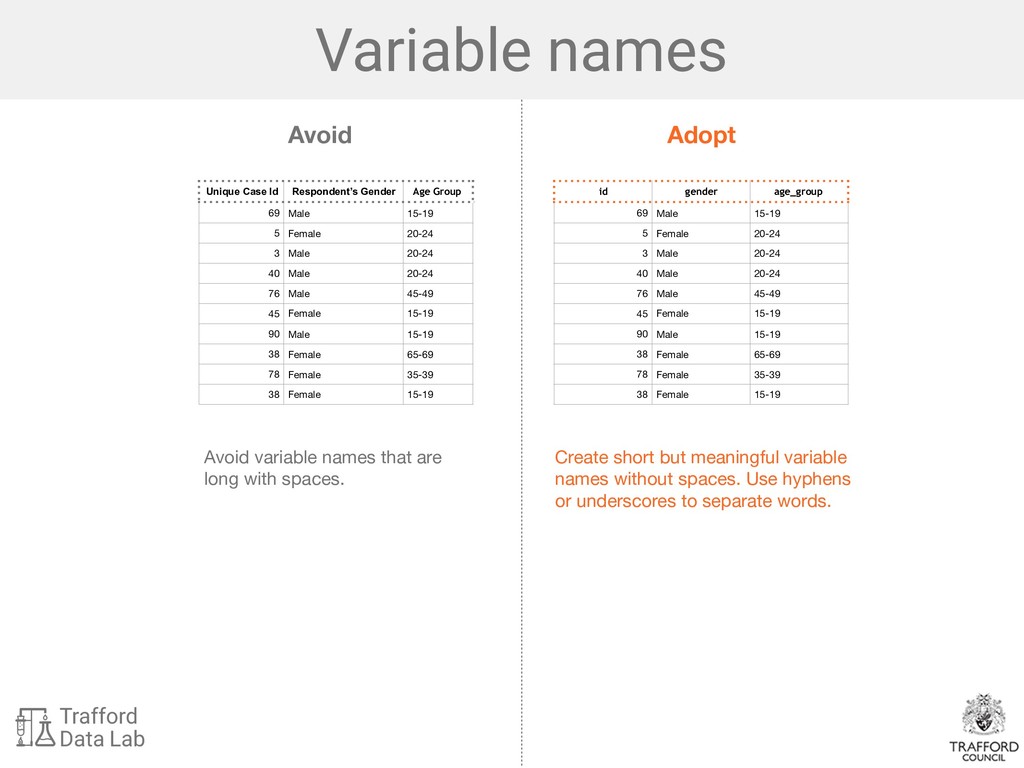
Create short but meaningful variable names without spaces. Use hyphens or underscores to separate words. Unique Case Id Respondent’s Gender Age Group 69 Male 15-19 5 Female 20-24 3 Male 20-24 40 Male 20-24 76 Male 45-49 45 Female 15-19 90 Male 15-19 38 Female 65-69 78 Female 35-39 38 Female 15-19 id gender age_group 69 Male 15-19 5 Female 20-24 3 Male 20-24 40 Male 20-24 76 Male 45-49 45 Female 15-19 90 Male 15-19 38 Female 65-69 78 Female 35-39 38 Female 15-19 Avoid Adopt
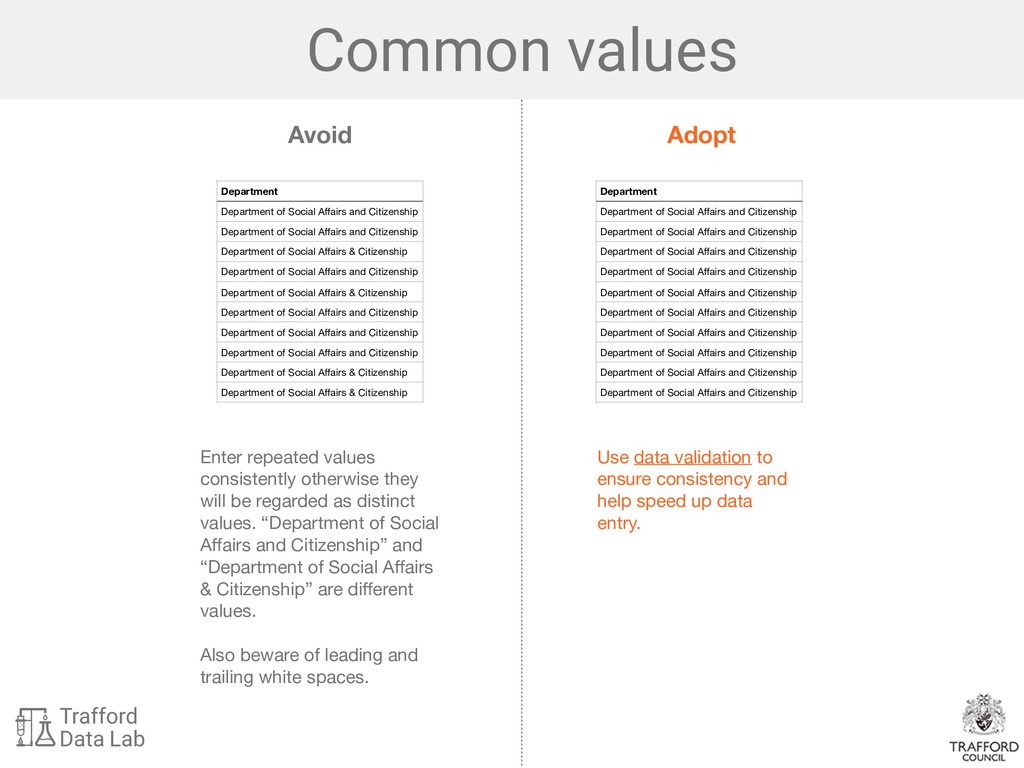
regarded as distinct values. “Department of Social Affairs and Citizenship” and “Department of Social Affairs & Citizenship” are different values. Also beware of leading and trailing white spaces. Use data validation to ensure consistency and help speed up data entry. Department Department of Social Affairs and Citizenship Department of Social Affairs and Citizenship Department of Social Affairs & Citizenship Department of Social Affairs and Citizenship Department of Social Affairs & Citizenship Department of Social Affairs and Citizenship Department of Social Affairs and Citizenship Department of Social Affairs and Citizenship Department of Social Affairs & Citizenship Department of Social Affairs & Citizenship Department Department of Social Affairs and Citizenship Department of Social Affairs and Citizenship Department of Social Affairs and Citizenship Department of Social Affairs and Citizenship Department of Social Affairs and Citizenship Department of Social Affairs and Citizenship Department of Social Affairs and Citizenship Department of Social Affairs and Citizenship Department of Social Affairs and Citizenship Department of Social Affairs and Citizenship Avoid Adopt
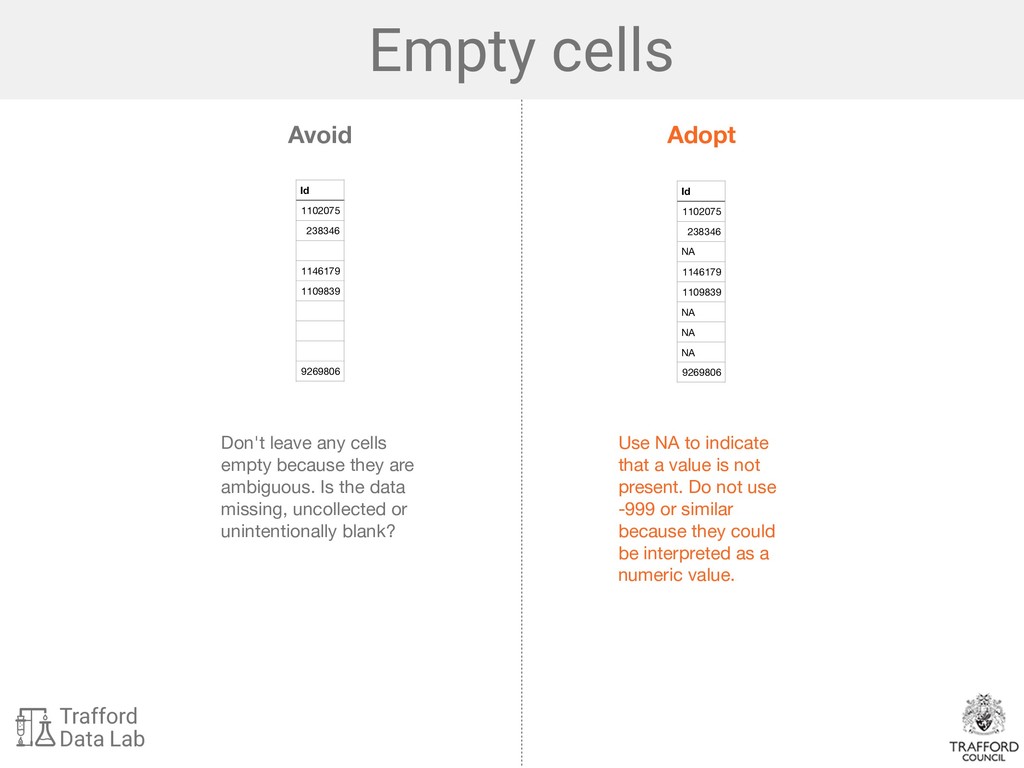
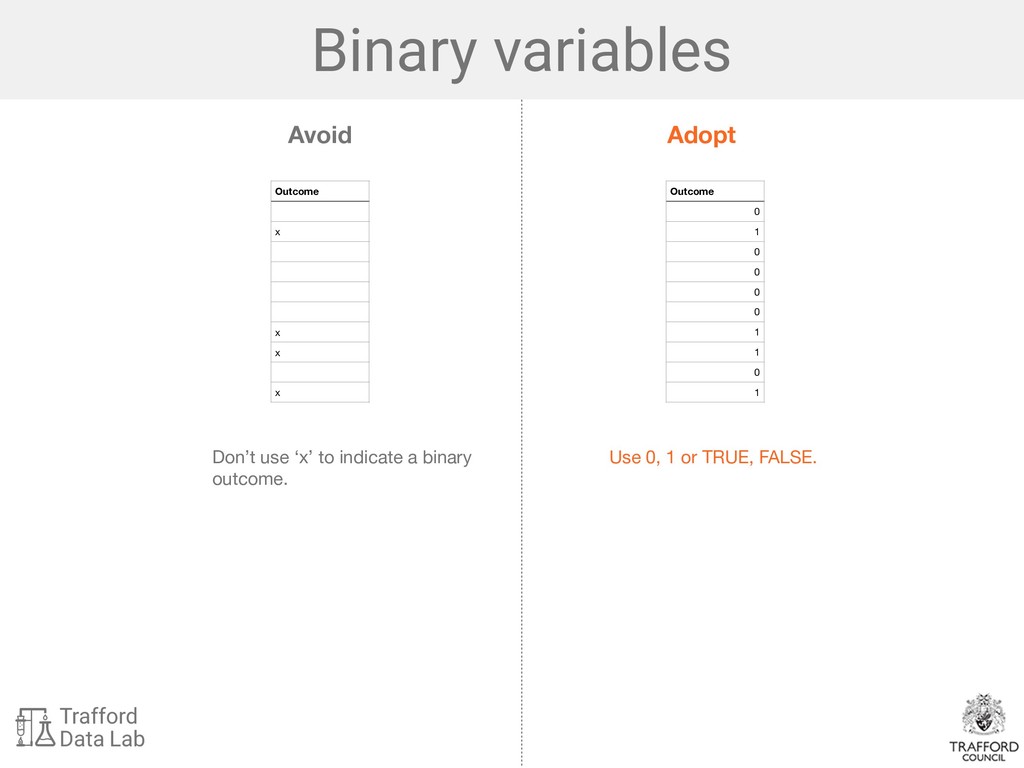
ambiguous. Is the data missing, uncollected or unintentionally blank? Use NA to indicate that a value is not present. Do not use -999 or similar because they could be interpreted as a numeric value. Id 1102075 238346 1146179 1109839 9269806 Id 1102075 238346 NA 1146179 1109839 NA NA NA 9269806 Avoid Adopt
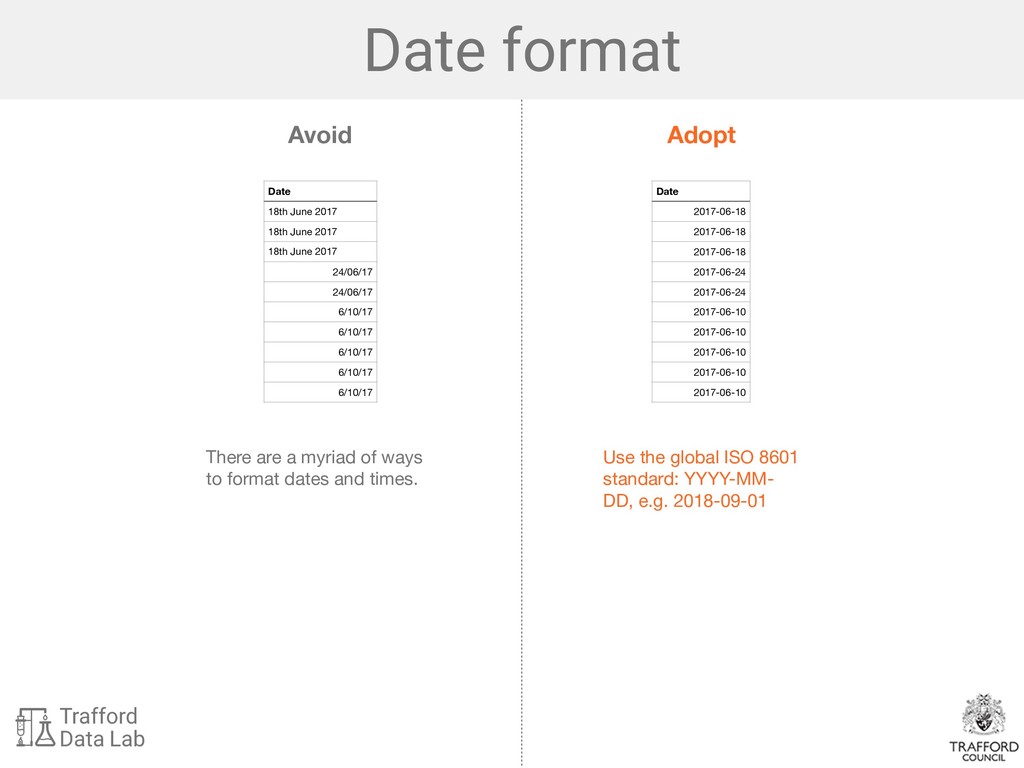
dates and times. Use the global ISO 8601 standard: YYYY-MM- DD, e.g. 2018-09-01 Date 18th June 2017 18th June 2017 18th June 2017 24/06/17 24/06/17 6/10/17 6/10/17 6/10/17 6/10/17 6/10/17 Date 2017-06-18 2017-06-18 2017-06-18 2017-06-24 2017-06-24 2017-06-10 2017-06-10 2017-06-10 2017-06-10 2017-06-10 Avoid Adopt
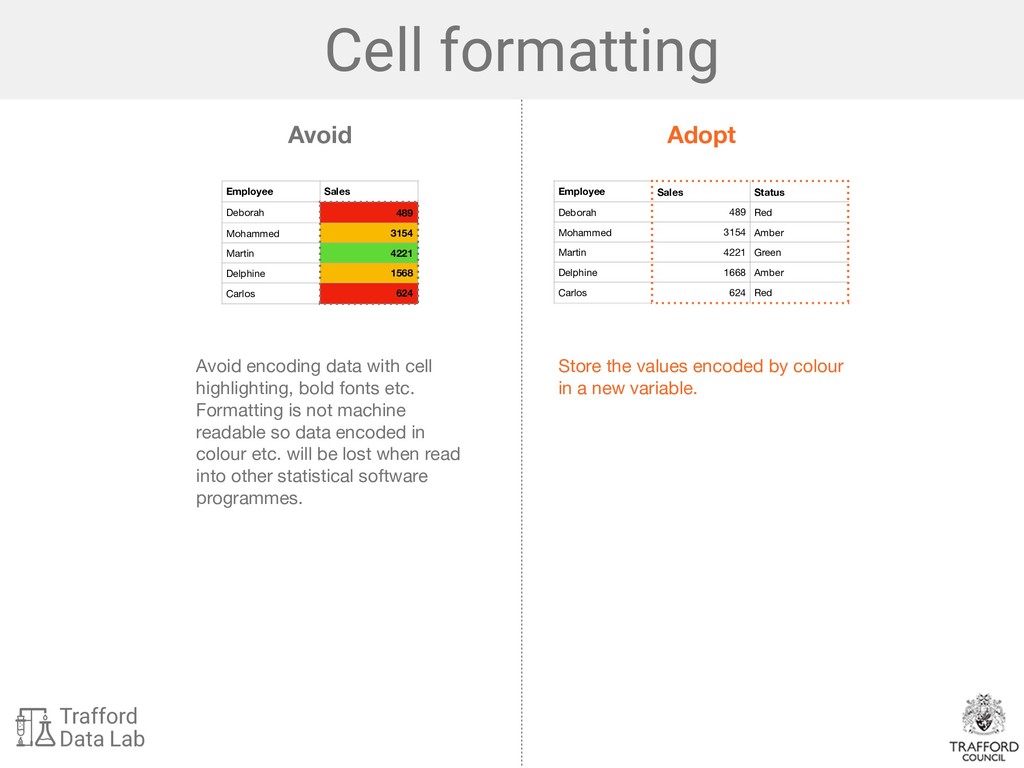
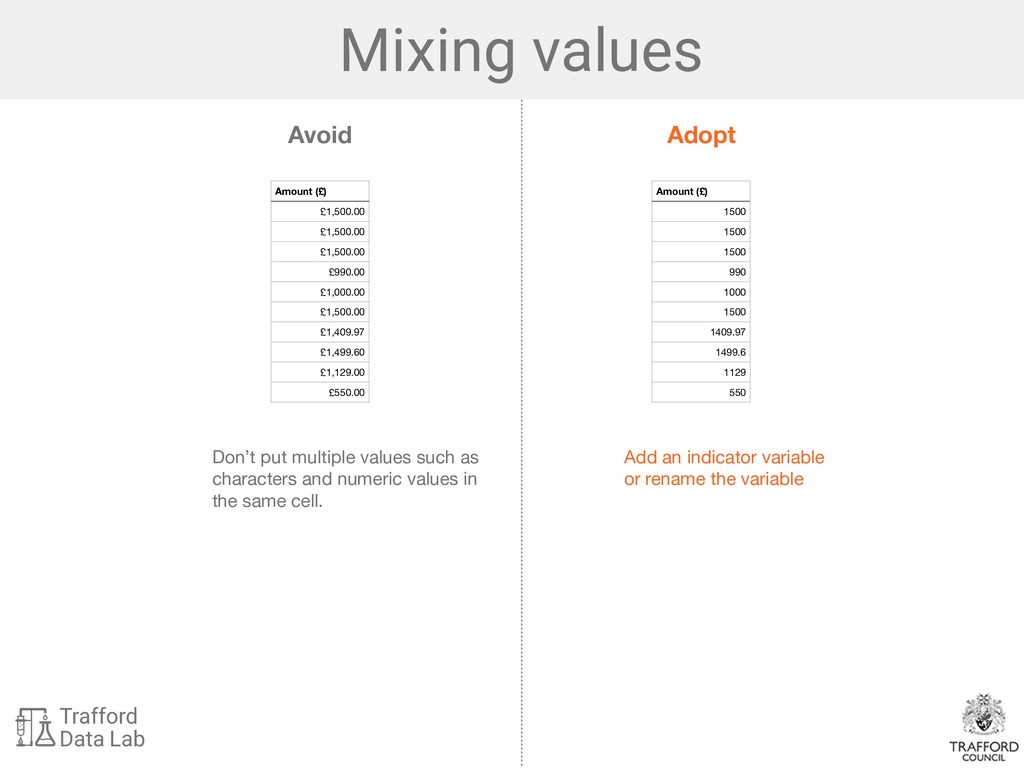
etc. Formatting is not machine readable so data encoded in colour etc. will be lost when read into other statistical software programmes. Store the values encoded by colour in a new variable. Employee Sales Deborah 489 Mohammed 3154 Martin 4221 Delphine 1568 Carlos 624 Employee Sales Status Deborah 489 Red Mohammed 3154 Amber Martin 4221 Green Delphine 1668 Amber Carlos 624 Red Avoid Adopt
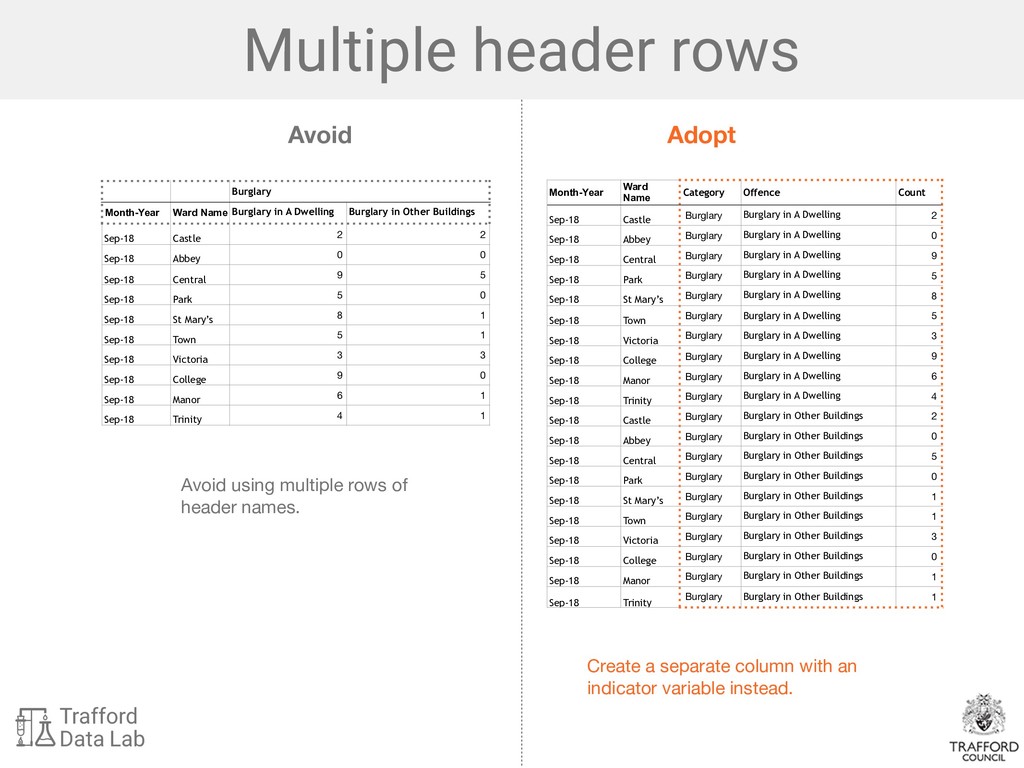
header names. Create a separate column with an indicator variable instead. Burglary Month-Year Ward Name Burglary in A Dwelling Burglary in Other Buildings Sep-18 Castle 2 2 Sep-18 Abbey 0 0 Sep-18 Central 9 5 Sep-18 Park 5 0 Sep-18 St Mary’s 8 1 Sep-18 Town 5 1 Sep-18 Victoria 3 3 Sep-18 College 9 0 Sep-18 Manor 6 1 Sep-18 Trinity 4 1 Month-Year Ward Name Category Offence Count Sep-18 Castle Burglary Burglary in A Dwelling 2 Sep-18 Abbey Burglary Burglary in A Dwelling 0 Sep-18 Central Burglary Burglary in A Dwelling 9 Sep-18 Park Burglary Burglary in A Dwelling 5 Sep-18 St Mary’s Burglary Burglary in A Dwelling 8 Sep-18 Town Burglary Burglary in A Dwelling 5 Sep-18 Victoria Burglary Burglary in A Dwelling 3 Sep-18 College Burglary Burglary in A Dwelling 9 Sep-18 Manor Burglary Burglary in A Dwelling 6 Sep-18 Trinity Burglary Burglary in A Dwelling 4 Sep-18 Castle Burglary Burglary in Other Buildings 2 Sep-18 Abbey Burglary Burglary in Other Buildings 0 Sep-18 Central Burglary Burglary in Other Buildings 5 Sep-18 Park Burglary Burglary in Other Buildings 0 Sep-18 St Mary’s Burglary Burglary in Other Buildings 1 Sep-18 Town Burglary Burglary in Other Buildings 1 Sep-18 Victoria Burglary Burglary in Other Buildings 3 Sep-18 College Burglary Burglary in Other Buildings 0 Sep-18 Manor Burglary Burglary in Other Buildings 1 Sep-18 Trinity Burglary Burglary in Other Buildings 1
This will ensure that you have a clean copy of the data in case you corrupt your dataset. • Save raw data in a plain text format like CSV that can be read in other spreadsheet and statistical software. • Add metadata to explain variable names and provide provenance information, licence etc. Recommendations