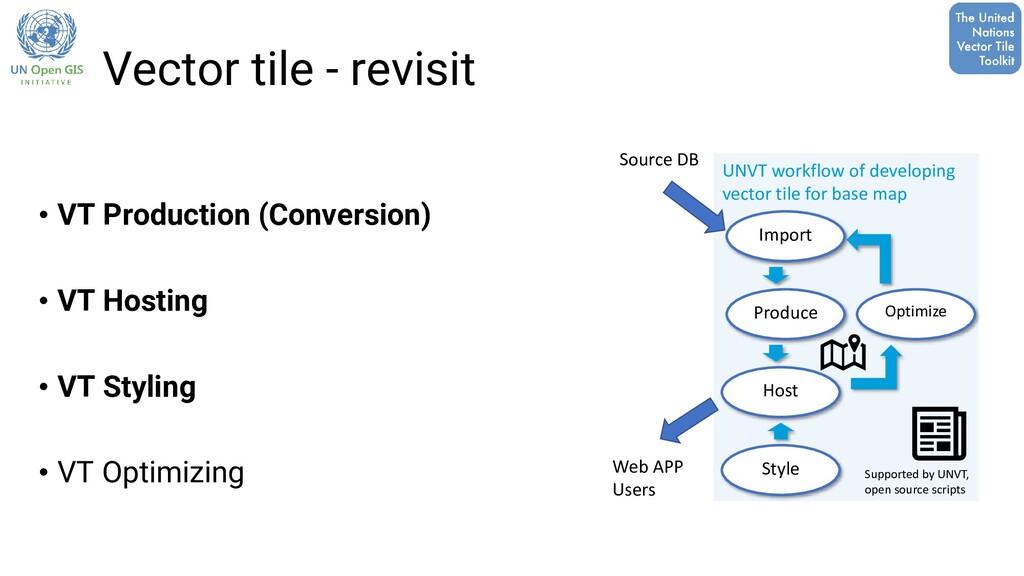
Hosting • VT Styling • VT Optimizing Produce Host Style Optimize Import UNVT workflow of developing vector tile for base map Supported by UNVT, open source scripts Source DB Web APP Users
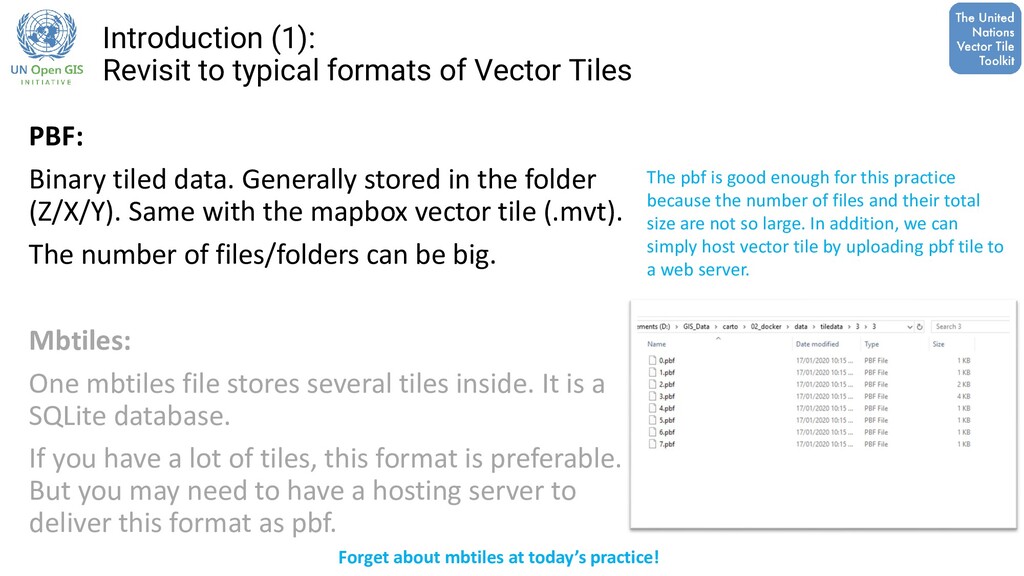
Binary tiled data. Generally stored in the folder (Z/X/Y). Same with the mapbox vector tile (.mvt). The number of files/folders can be big. Mbtiles: One mbtiles file stores several tiles inside. It is a SQLite database. If you have a lot of tiles, this format is preferable. But you may need to have a hosting server to deliver this format as pbf. The pbf is good enough for this practice because the number of files and their total size are not so large. In addition, we can simply host vector tile by uploading pbf tile to a web server. Forget about mbtiles at today’s practice!
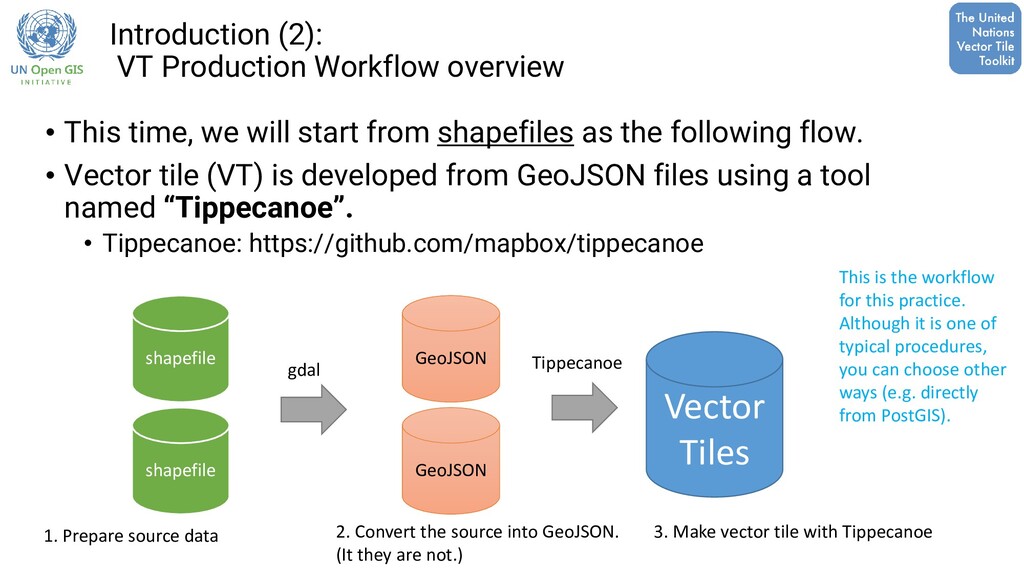
will start from shapefiles as the following flow. • Vector tile (VT) is developed from GeoJSON files using a tool named “Tippecanoe”. • Tippecanoe: https://github.com/mapbox/tippecanoe Vector Tiles shapefile GeoJSON shapefile GeoJSON 2. Convert the source into GeoJSON. (It they are not.) 1. Prepare source data 3. Make vector tile with Tippecanoe This is the workflow for this practice. Although it is one of typical procedures, you can choose other ways (e.g. directly from PostGIS). gdal Tippecanoe
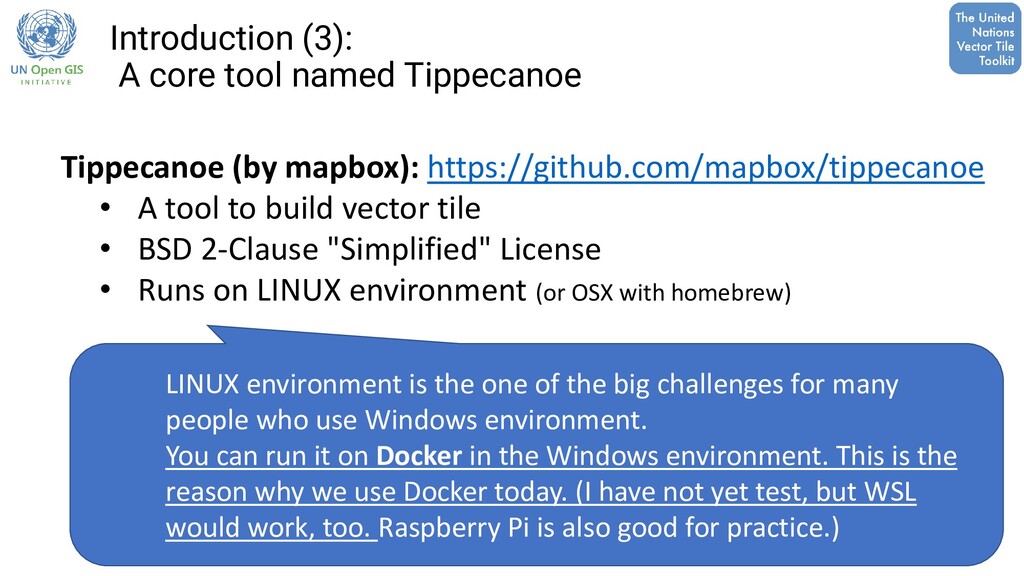
https://github.com/mapbox/tippecanoe • A tool to build vector tile • BSD 2-Clause "Simplified" License • Runs on LINUX environment (or OSX with homebrew) LINUX environment is the one of the big challenges for many people who use Windows environment. You can run it on Docker in the Windows environment. This is the reason why we use Docker today. (I have not yet test, but WSL would work, too. Raspberry Pi is also good for practice.)
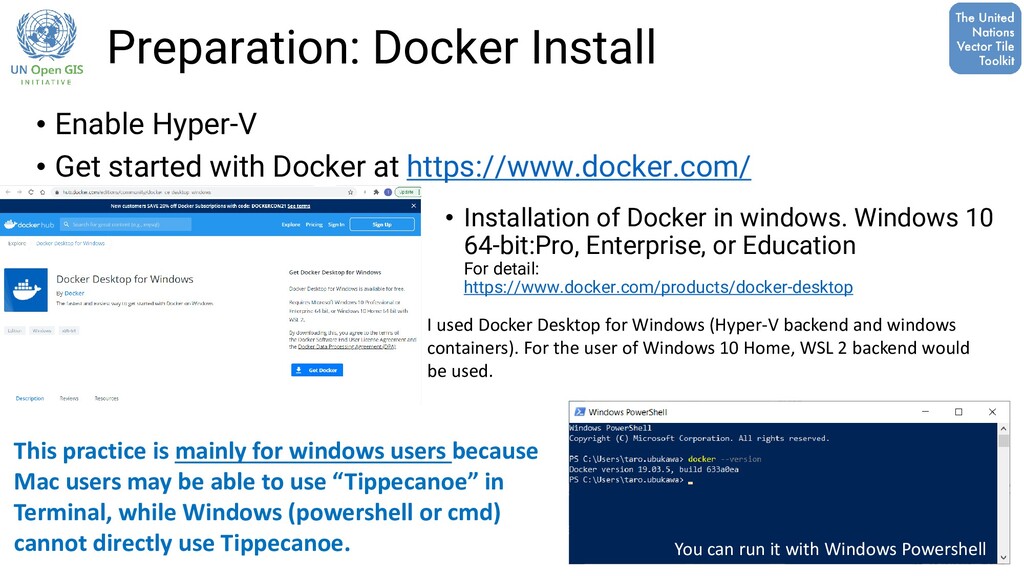
Docker at https://www.docker.com/ You can run it with Windows Powershell • Installation of Docker in windows. Windows 10 64-bit:Pro, Enterprise, or Education For detail: https://www.docker.com/products/docker-desktop I used Docker Desktop for Windows (Hyper-V backend and windows containers). For the user of Windows 10 Home, WSL 2 backend would be used. This practice is mainly for windows users because Mac users may be able to use “Tippecanoe” in Terminal, while Windows (powershell or cmd) cannot directly use Tippecanoe.
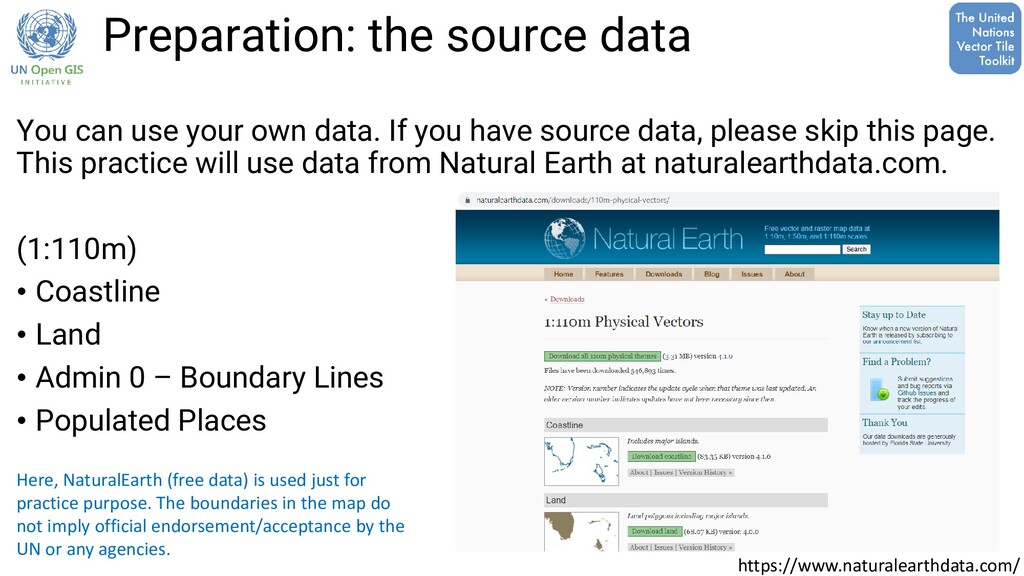
If you have source data, please skip this page. This practice will use data from Natural Earth at naturalearthdata.com. (1:110m) • Coastline • Land • Admin 0 – Boundary Lines • Populated Places Here, NaturalEarth (free data) is used just for practice purpose. The boundaries in the map do not imply official endorsement/acceptance by the UN or any agencies. https://www.naturalearthdata.com/
data source for your practice. • location.shp (point) • Locations of UNGIS, UNGSC and UNMISS. (Only 3 for testing purpose.) • It has “name” attribution. • Projection is not the same with other (World Mercator projection)
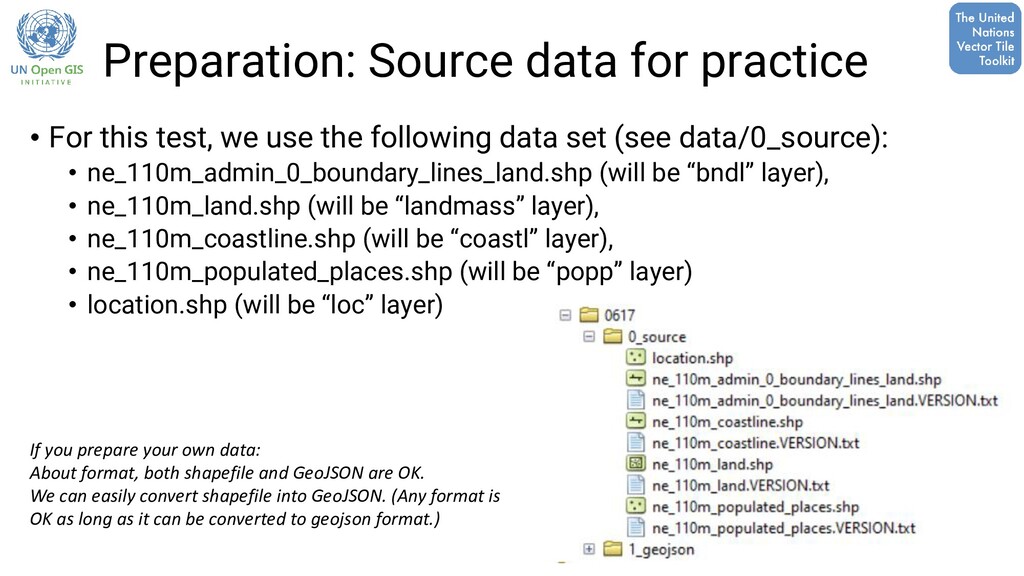
use the following data set (see data/0_source): • ne_110m_admin_0_boundary_lines_land.shp (will be “bndl” layer), • ne_110m_land.shp (will be “landmass” layer), • ne_110m_coastline.shp (will be “coastl” layer), • ne_110m_populated_places.shp (will be “popp” layer) • location.shp (will be “loc” layer) If you prepare your own data: About format, both shapefile and GeoJSON are OK. We can easily convert shapefile into GeoJSON. (Any format is OK as long as it can be converted to geojson format.)
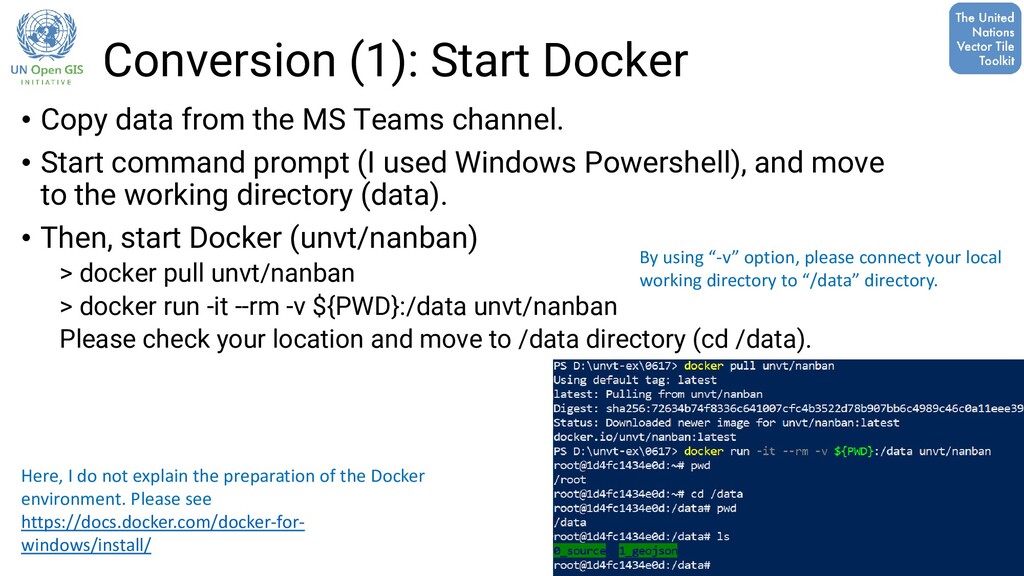
Teams channel. • Start command prompt (I used Windows Powershell), and move to the working directory (data). • Then, start Docker (unvt/nanban) > docker pull unvt/nanban > docker run -it --rm -v ${PWD}:/data unvt/nanban Please check your location and move to /data directory (cd /data). By using “-v” option, please connect your local working directory to “/data” directory. Here, I do not explain the preparation of the Docker environment. Please see https://docs.docker.com/docker-for- windows/install/
Toolkit. This is a developer friendly UNVT Dockerfile. Developed by Mr. Fujimura in July 2020. I think this tool helps windows users to easily use UNVT. • Features: • based on Ubuntu/Intel → This is the base of the various tools • Tippecanoe is contained. → It can be used for vector tile data conversion. • gdal is included → It can be used for basic GIS data processing. • HOCON Parse is also available → It can be used for style editing (advanced). • The name nanban is from Tamil language. It means friend. You can find detailed information at https://github.com/unvt/nanban
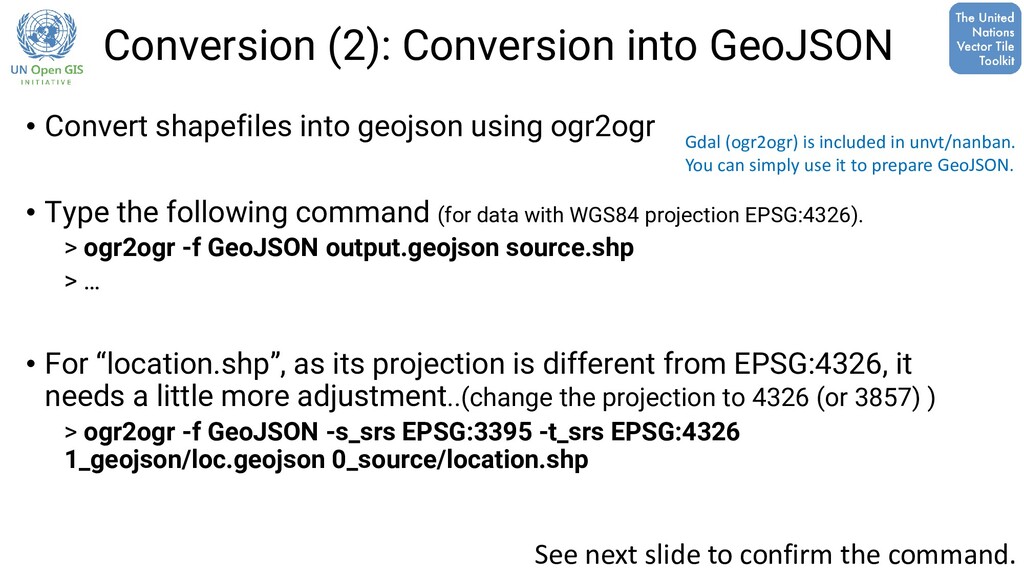
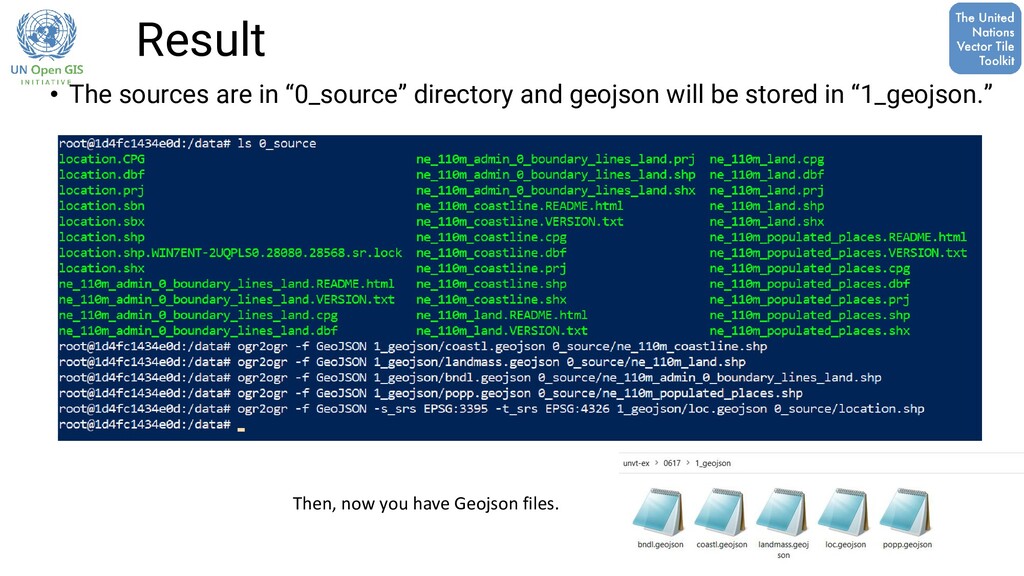
using ogr2ogr • Type the following command (for data with WGS84 projection EPSG:4326). > ogr2ogr -f GeoJSON output.geojson source.shp > … • For “location.shp”, as its projection is different from EPSG:4326, it needs a little more adjustment..(change the projection to 4326 (or 3857) ) > ogr2ogr -f GeoJSON -s_srs EPSG:3395 -t_srs EPSG:4326 1_geojson/loc.geojson 0_source/location.shp Gdal (ogr2ogr) is included in unvt/nanban. You can simply use it to prepare GeoJSON. See next slide to confirm the command.
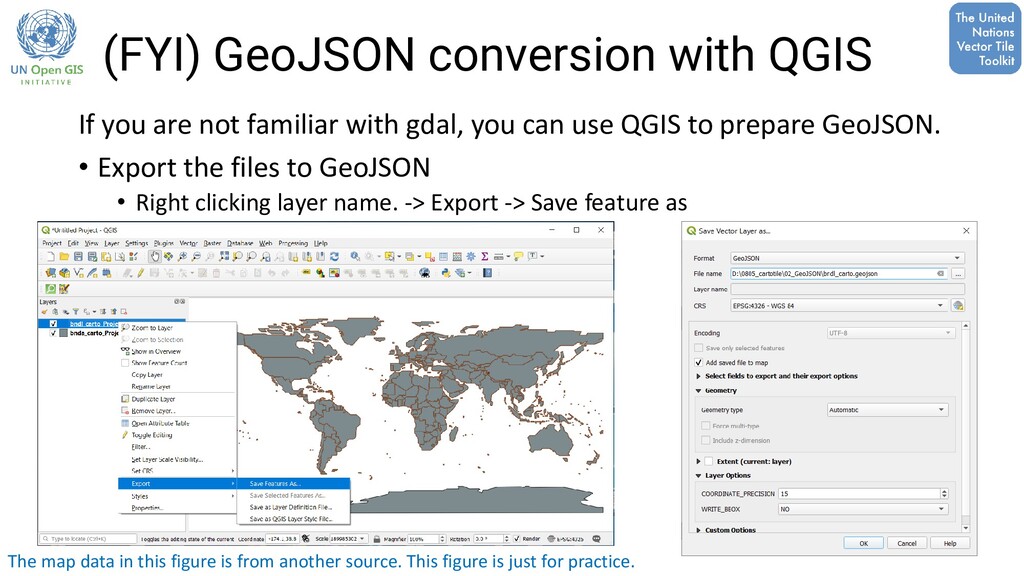
with gdal, you can use QGIS to prepare GeoJSON. • Export the files to GeoJSON • Right clicking layer name. -> Export -> Save feature as The map data in this figure is from another source. This figure is just for practice.
• Vector tile can have several layers in it. You need to think about the structure of your Vector Tile based on your source data. This practice will use the following settings. • Max Zoom: 3, Min Zoom: 0 • Layers: Theme GeoJSON name VT layer name (fyi) key Attributes Coastline coastl.geojson coastl featurecla Land landmass.geojson landmass featurecla Admin 0 Boundary (National level) bndl.geojson bndl featurecla Populated place popp.geojson popp featurecla, name Test Location.geojson loc name, location Attributes comes from original data. You do not have to work on it, but please check their value if necessary.
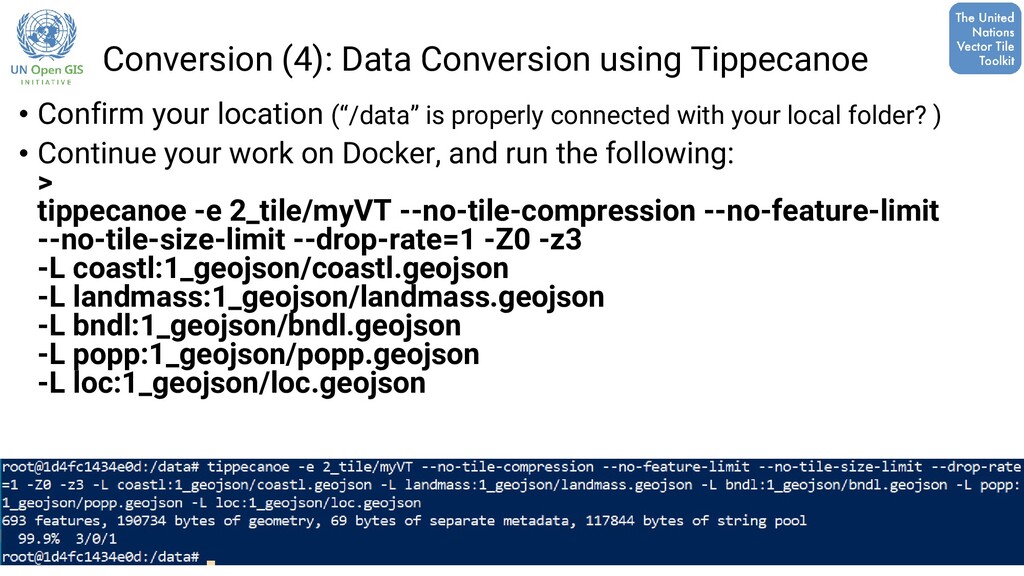
(“/data” is properly connected with your local folder? ) • Continue your work on Docker, and run the following: > tippecanoe -e 2_tile/myVT --no-tile-compression --no-feature-limit --no-tile-size-limit --drop-rate=1 -Z0 -z3 -L coastl:1_geojson/coastl.geojson -L landmass:1_geojson/landmass.geojson -L bndl:1_geojson/bndl.geojson -L popp:1_geojson/popp.geojson -L loc:1_geojson/loc.geojson
• -e 2_tile/myVT → export file. Option “e” for pbf format, “o” for mbtiles format. • --no-tile-compression → compressed pbf cannot be read by some APP. Please add this option. • --no-feature-limit → eliminate the limit of the number of the tile per tile. • --no-tile-size-limit → eliminate the limit of the data size per tile. • --drop-rate → Points will be dropped with this rate at smaller zoom, based on its base-scale (in general, largest zoom of the tile). Keep this as 1 if you do not want to drop any point. • -z, -Z → Specifies min and max zoom of the tile. • -L → defines each layer. Each layer is defined by -L Layername:source.geojson, you can add more than one See https://github.com/mapbox/tippecanoe for details If you forget –no-tile- compression option, you may not be able to see the tile in your web map app.
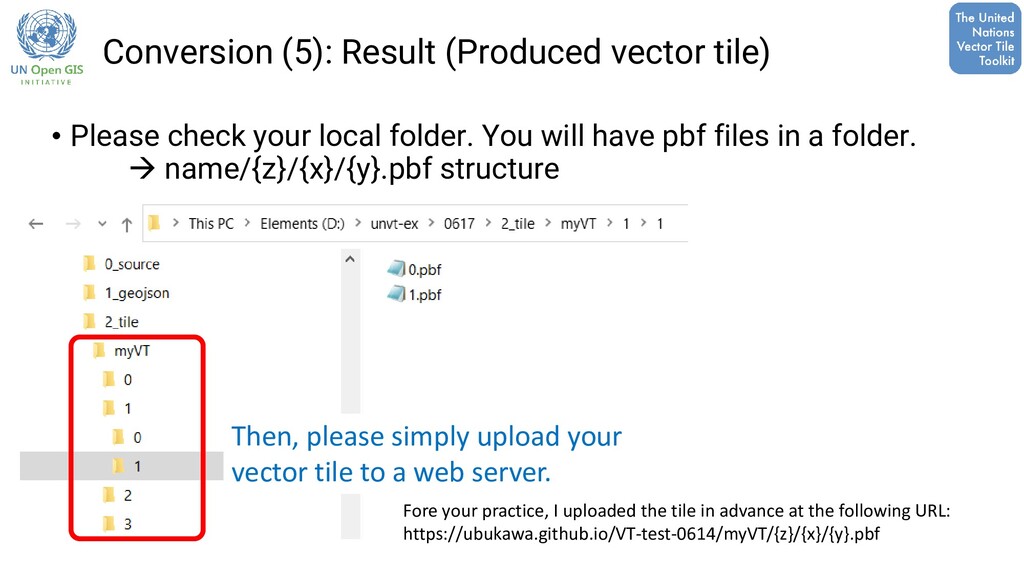
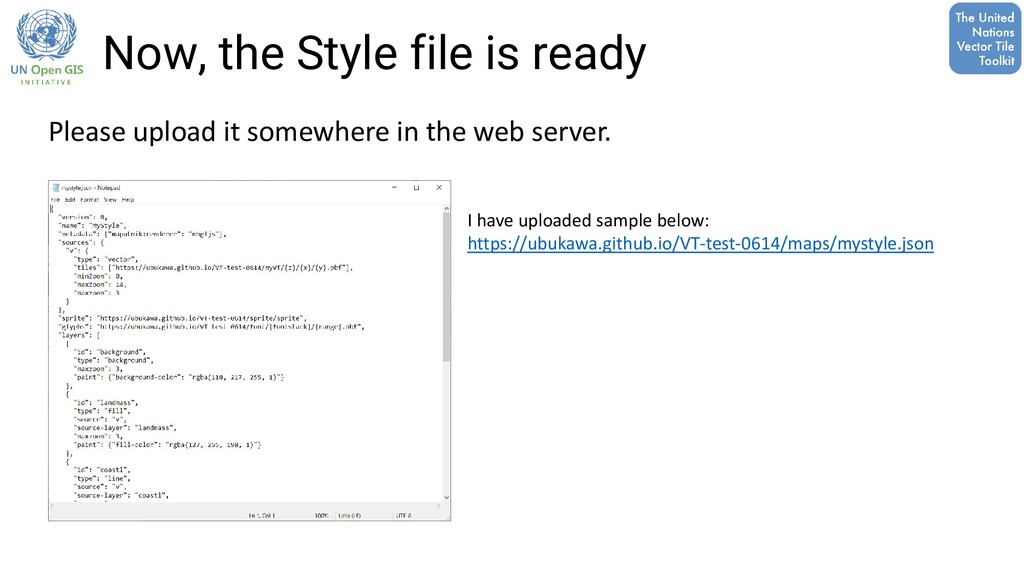
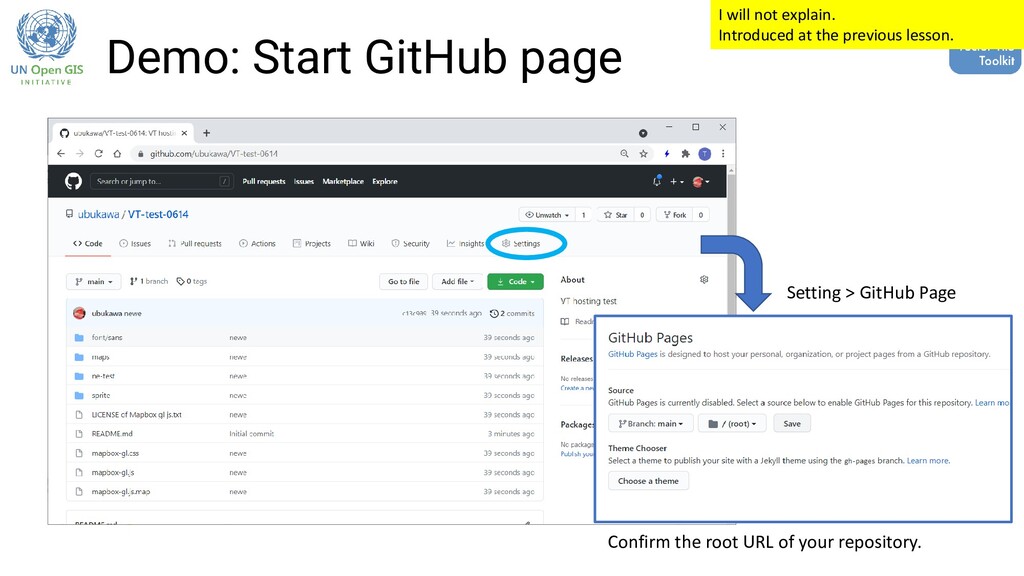
local folder. You will have pbf files in a folder. → name/{z}/{x}/{y}.pbf structure Then, please simply upload your vector tile to a web server. Fore your practice, I uploaded the tile in advance at the following URL: https://ubukawa.github.io/VT-test-0614/myVT/{z}/{x}/{y}.pbf
how to make VT with Docker. Here are next steps of your vector tiles. We will practice the following steps in another exercise. • Vector tile hosing • You can just simply upload the folder to the web server. • Then, you can refer to your vector tile. • Styling • You can add your style. Uploading the file to GitHub page, then you can easily see your VT with Maputnik.
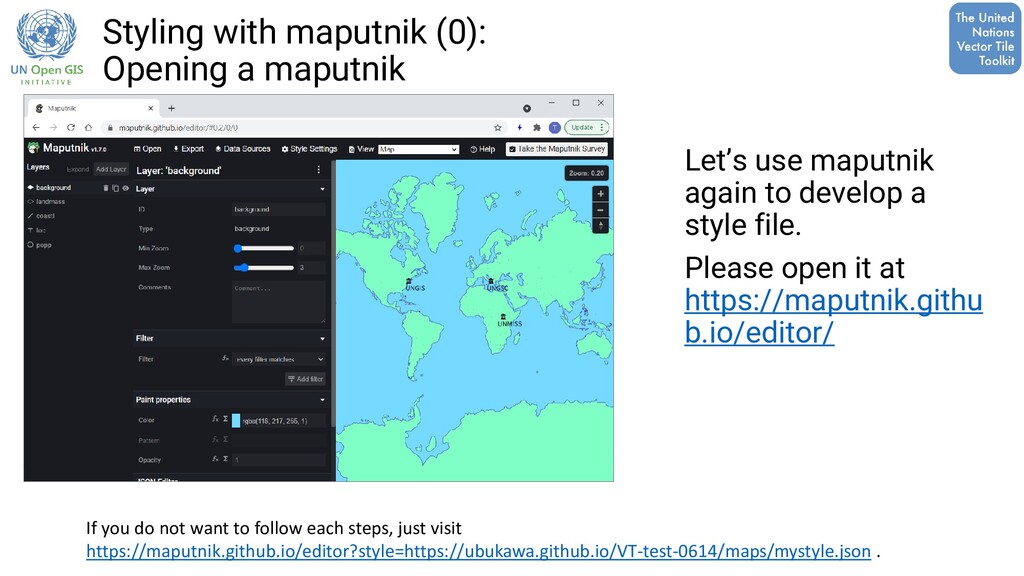
open it at https://maputnik.githu b.io/editor/ Styling with maputnik (0): Opening a maputnik If you do not want to follow each steps, just visit https://maputnik.github.io/editor?style=https://ubukawa.github.io/VT-test-0614/maps/mystyle.json .
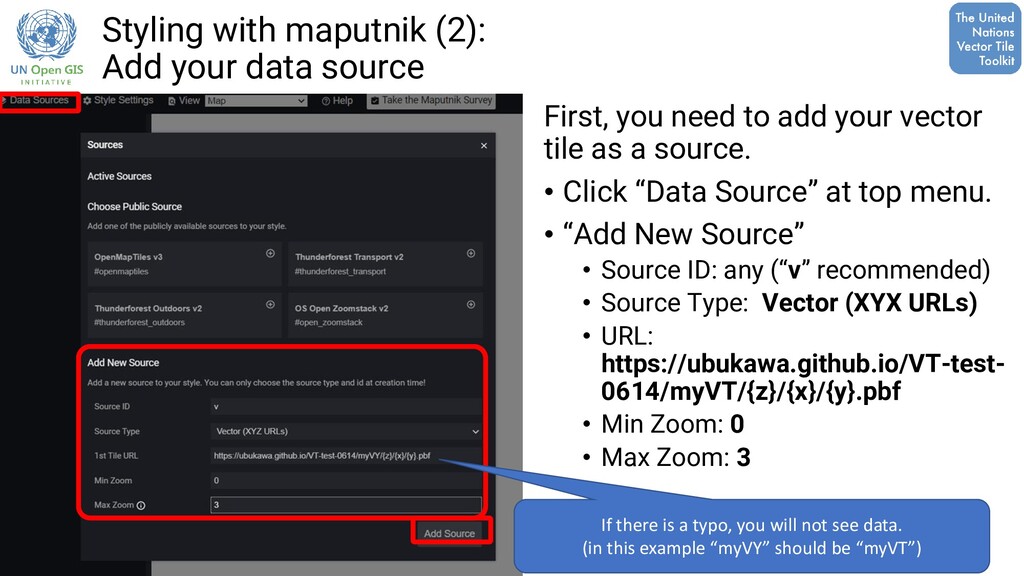
need to add your vector tile as a source. • Click “Data Source” at top menu. • “Add New Source” • Source ID: any (“v” recommended) • Source Type: Vector (XYX URLs) • URL: https://ubukawa.github.io/VT-test- 0614/myVT/{z}/{x}/{y}.pbf • Min Zoom: 0 • Max Zoom: 3 If there is a typo, you will not see data. (in this example “myVY” should be “myVT”)
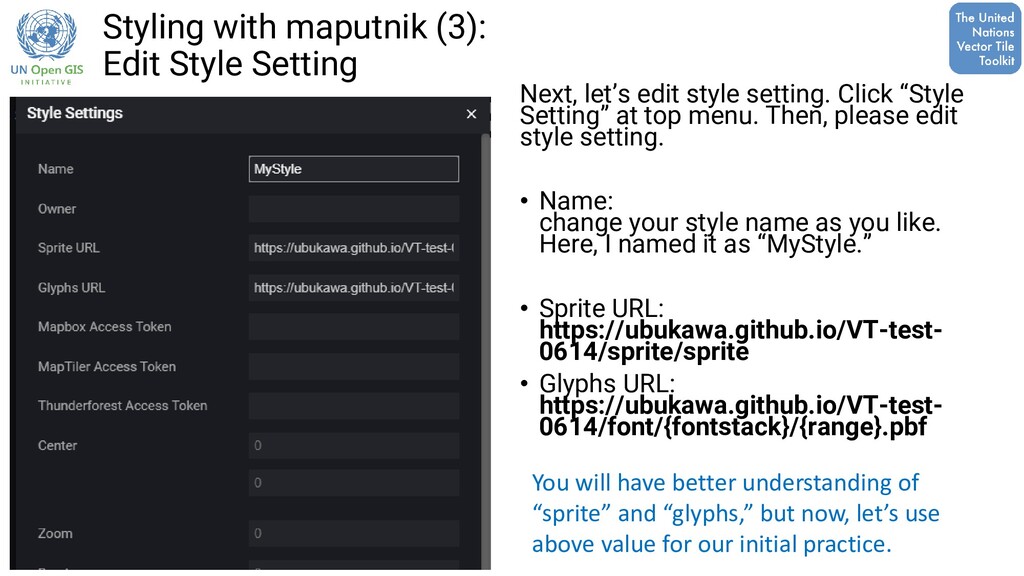
style setting. Click “Style Setting” at top menu. Then, please edit style setting. • Name: change your style name as you like. Here, I named it as “MyStyle.” • Sprite URL: https://ubukawa.github.io/VT-test- 0614/sprite/sprite • Glyphs URL: https://ubukawa.github.io/VT-test- 0614/font/{fontstack}/{range}.pbf You will have better understanding of “sprite” and “glyphs,” but now, let’s use above value for our initial practice.
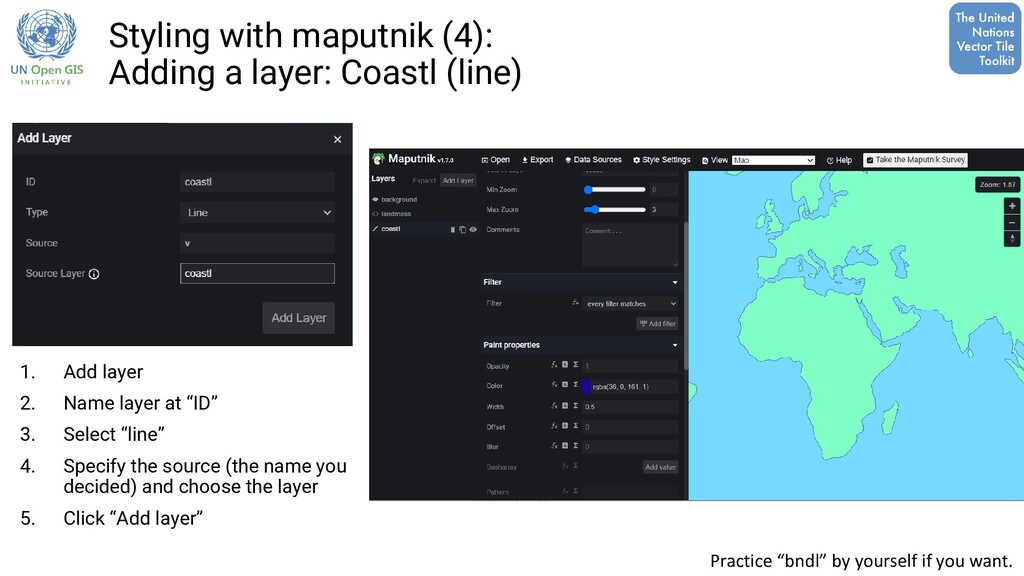
Add layer 2. Name layer at “ID” 3. Select “line” 4. Specify the source (the name you decided) and choose the layer 5. Click “Add layer” Practice “bndl” by yourself if you want.
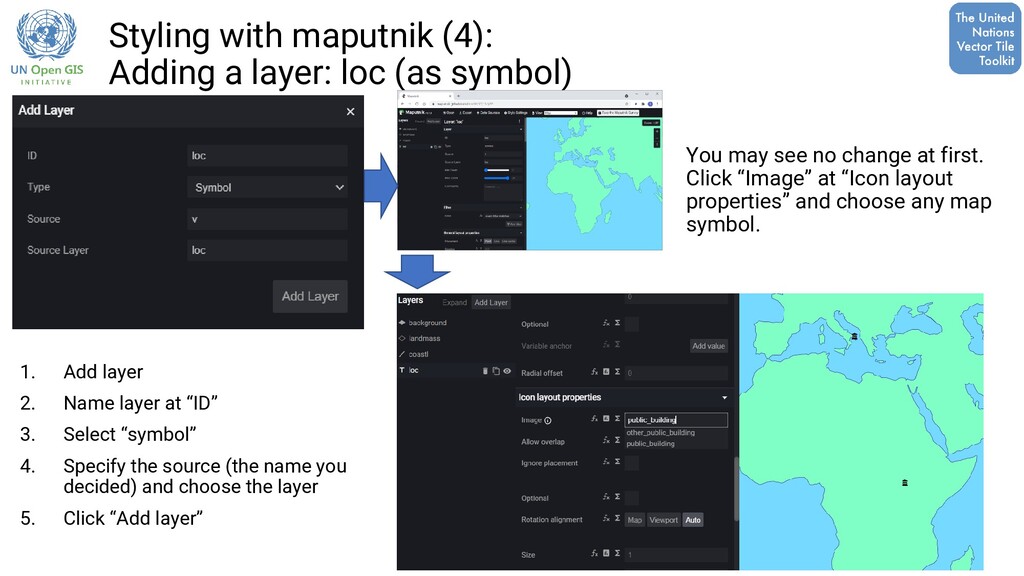
1. Add layer 2. Name layer at “ID” 3. Select “symbol” 4. Specify the source (the name you decided) and choose the layer 5. Click “Add layer” You may see no change at first. Click “Image” at “Icon layout properties” and choose any map symbol.
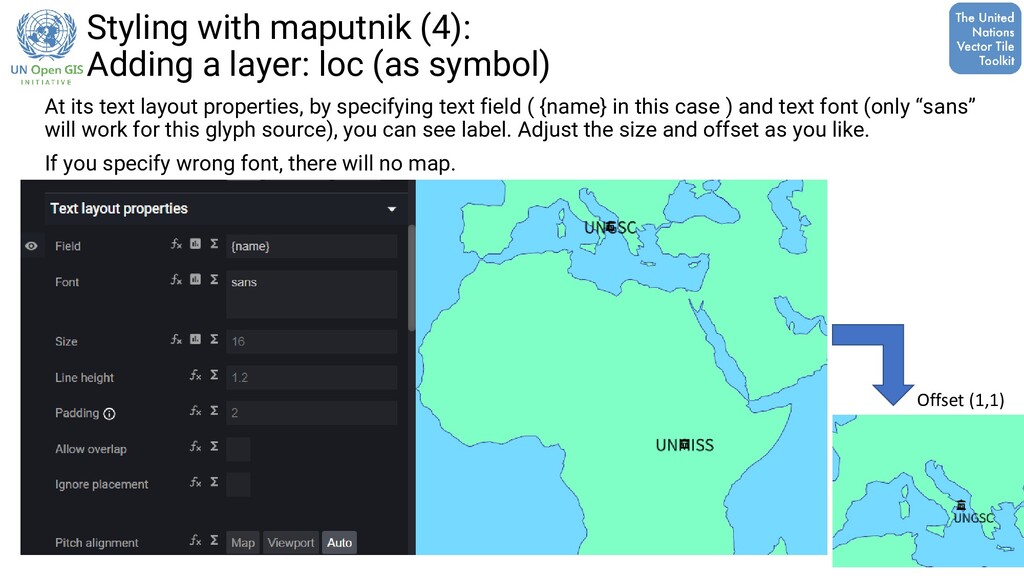
At its text layout properties, by specifying text field ( {name} in this case ) and text font (only “sans” will work for this glyph source), you can see label. Adjust the size and offset as you like. If you specify wrong font, there will no map. Offset (1,1)
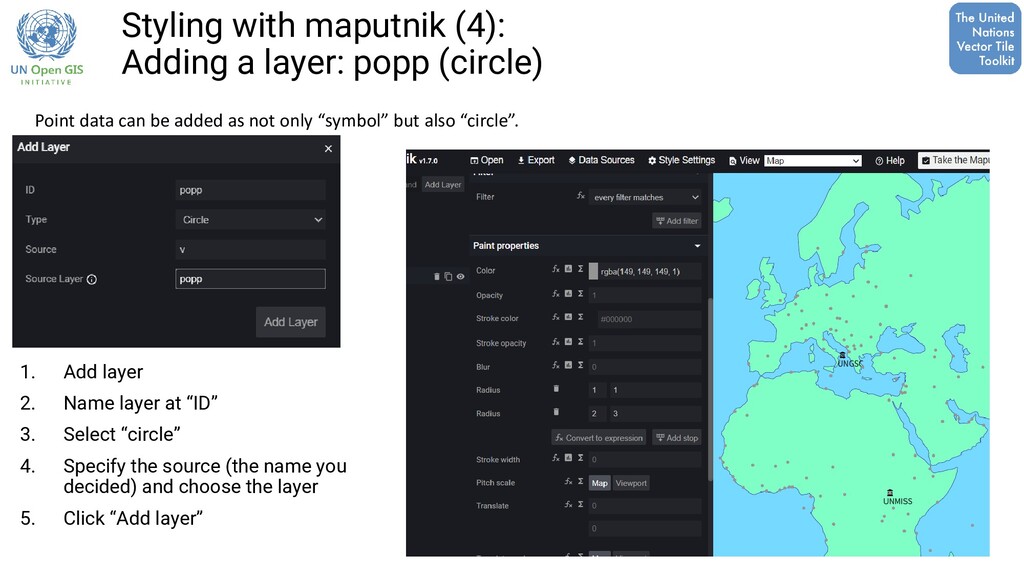
Add layer 2. Name layer at “ID” 3. Select “circle” 4. Specify the source (the name you decided) and choose the layer 5. Click “Add layer” Point data can be added as not only “symbol” but also “circle”.
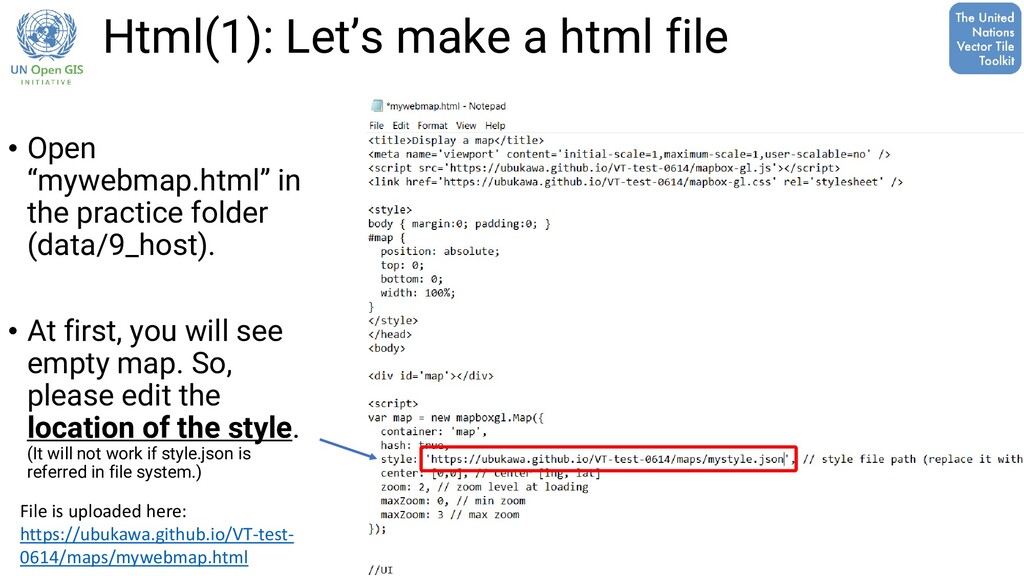
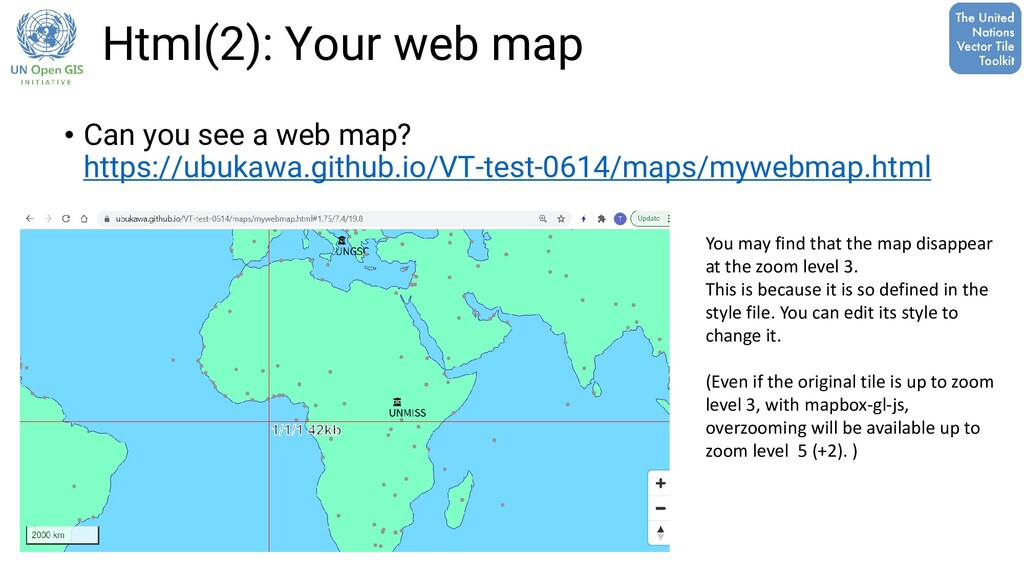
the practice folder (data/9_host). • At first, you will see empty map. So, please edit the location of the style. (It will not work if style.json is referred in file system.) File is uploaded here: https://ubukawa.github.io/VT-test- 0614/maps/mywebmap.html
map? https://ubukawa.github.io/VT-test-0614/maps/mywebmap.html You may find that the map disappear at the zoom level 3. This is because it is so defined in the style file. You can edit its style to change it. (Even if the original tile is up to zoom level 3, with mapbox-gl-js, overzooming will be available up to zoom level 5 (+2). )
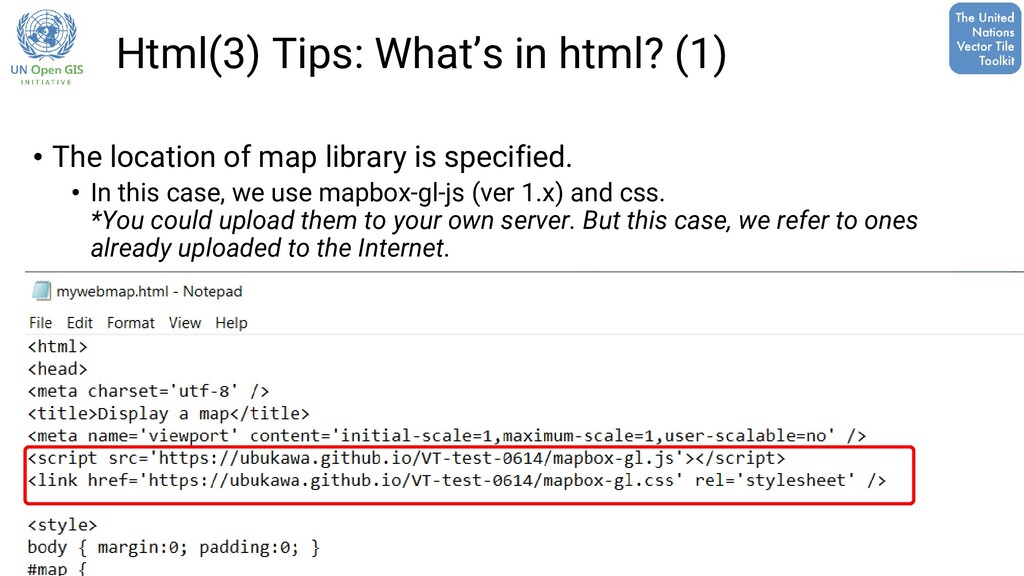
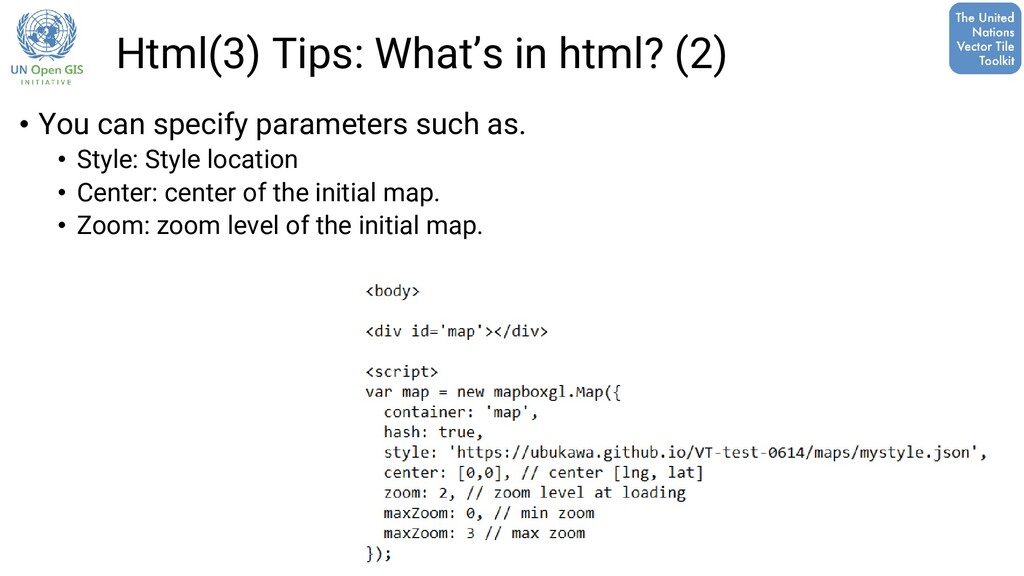
map library is specified. • In this case, we use mapbox-gl-js (ver 1.x) and css. *You could upload them to your own server. But this case, we refer to ones already uploaded to the Internet.
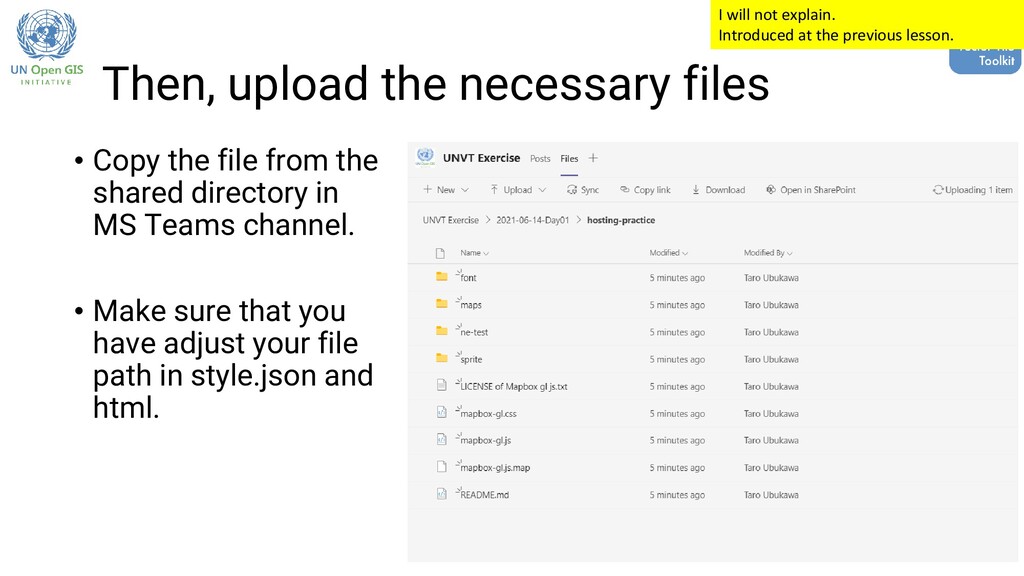
the shared directory in MS Teams channel. • Make sure that you have adjust your file path in style.json and html. I will not explain. Introduced at the previous lesson.
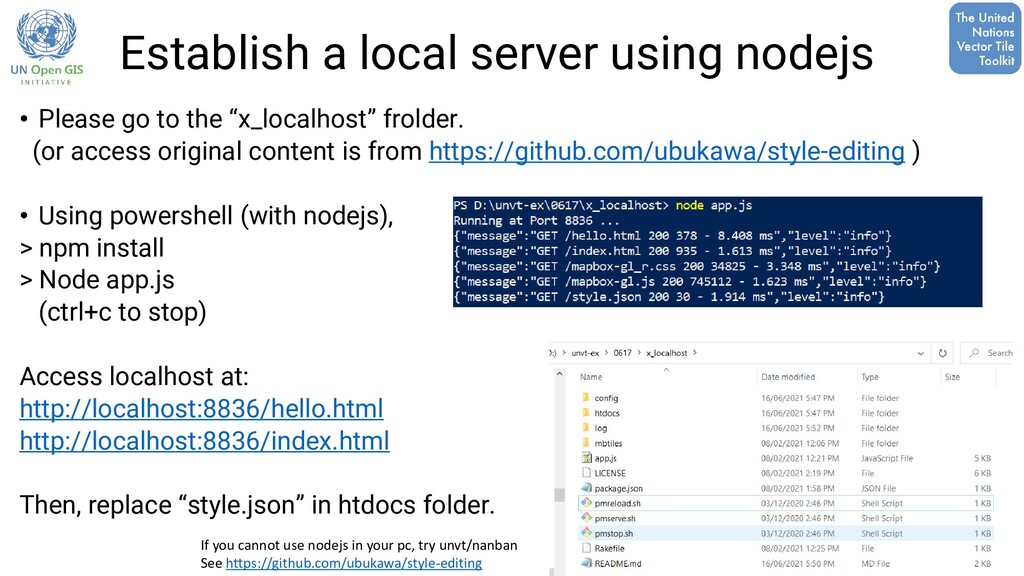
the “x_localhost” frolder. (or access original content is from https://github.com/ubukawa/style-editing ) • Using powershell (with nodejs), > npm install > Node app.js (ctrl+c to stop) Access localhost at: http://localhost:8836/hello.html http://localhost:8836/index.html Then, replace “style.json” in htdocs folder. If you cannot use nodejs in your pc, try unvt/nanban See https://github.com/ubukawa/style-editing
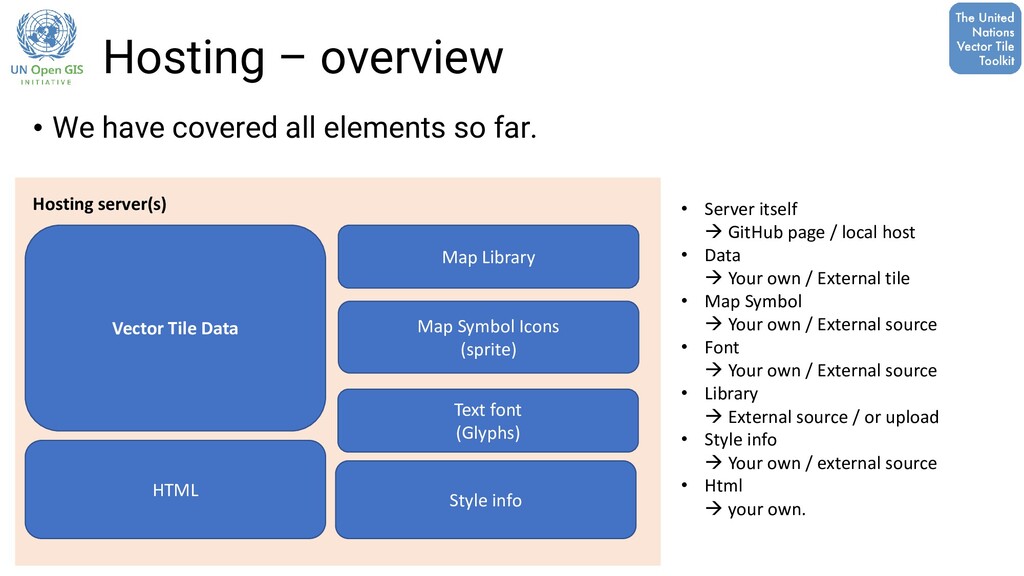
far. Vector Tile Data Map Library Map Symbol Icons (sprite) Text font (Glyphs) HTML Hosting server(s) • Server itself → GitHub page / local host • Data → Your own / External tile • Map Symbol → Your own / External source • Font → Your own / External source • Library → External source / or upload • Style info → Your own / external source • Html → your own. Style info
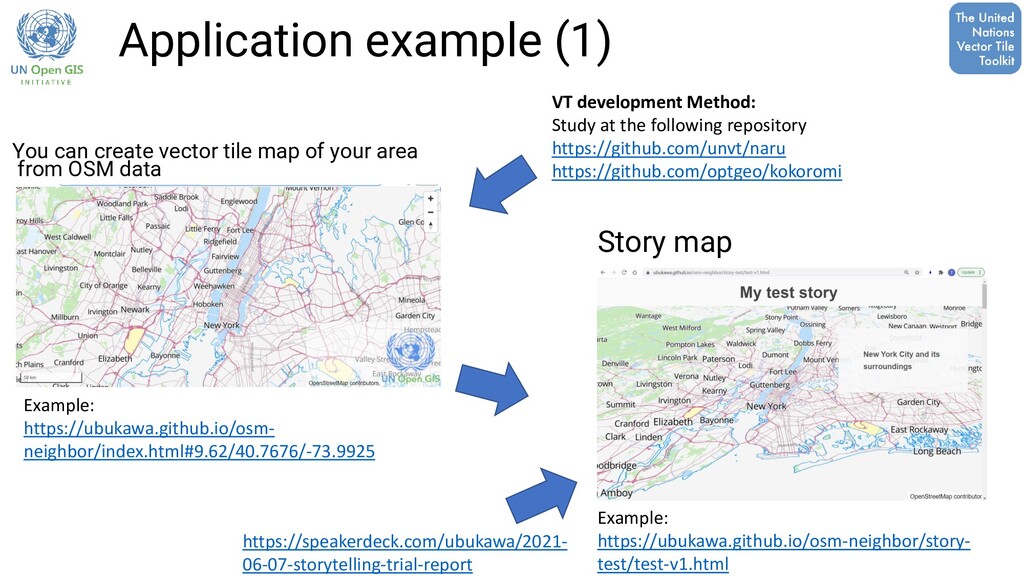
your area from OSM data Example: https://ubukawa.github.io/osm- neighbor/index.html#9.62/40.7676/-73.9925 VT development Method: Study at the following repository https://github.com/unvt/naru https://github.com/optgeo/kokoromi Example: https://ubukawa.github.io/osm-neighbor/story- test/test-v1.html Story map https://speakerdeck.com/ubukawa/2021- 06-07-storytelling-trial-report
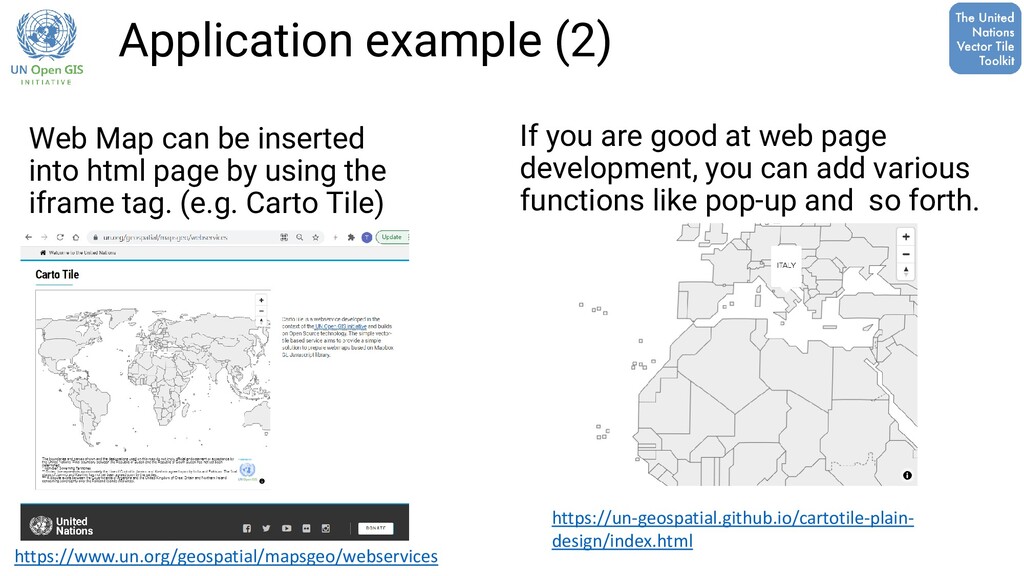
the iframe tag. (e.g. Carto Tile) https://www.un.org/geospatial/mapsgeo/webservices https://un-geospatial.github.io/cartotile-plain- design/index.html If you are good at web page development, you can add various functions like pop-up and so forth. Application example (2)
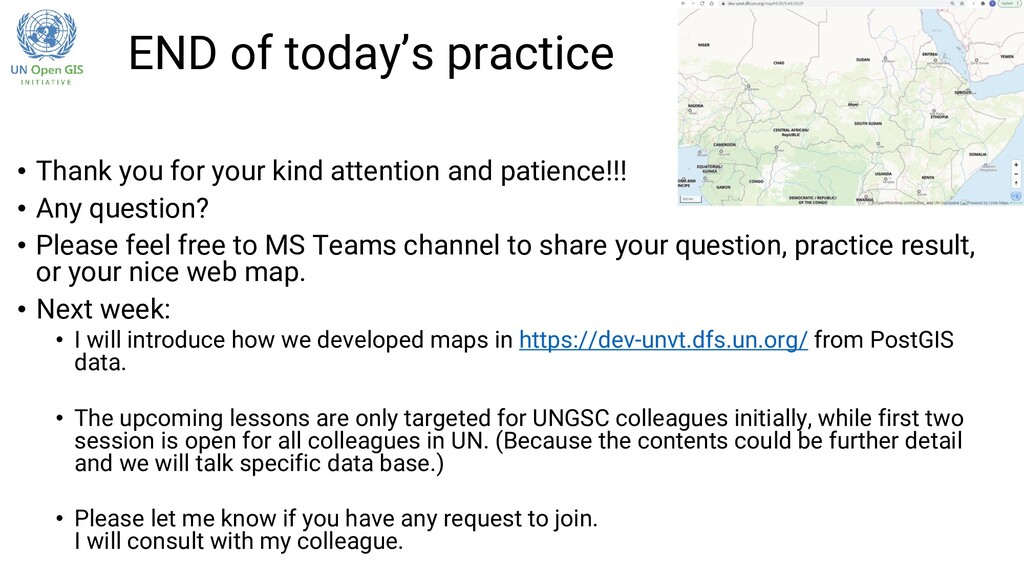
attention and patience!!! • Any question? • Please feel free to MS Teams channel to share your question, practice result, or your nice web map. • Next week: • I will introduce how we developed maps in https://dev-unvt.dfs.un.org/ from PostGIS data. • The upcoming lessons are only targeted for UNGSC colleagues initially, while first two session is open for all colleagues in UN. (Because the contents could be further detail and we will talk specific data base.) • Please let me know if you have any request to join. I will consult with my colleague.