(Senior Geospatial Expert at UN Geospatial Information Section) Some slides have been removed from original because they explained our internal contents.
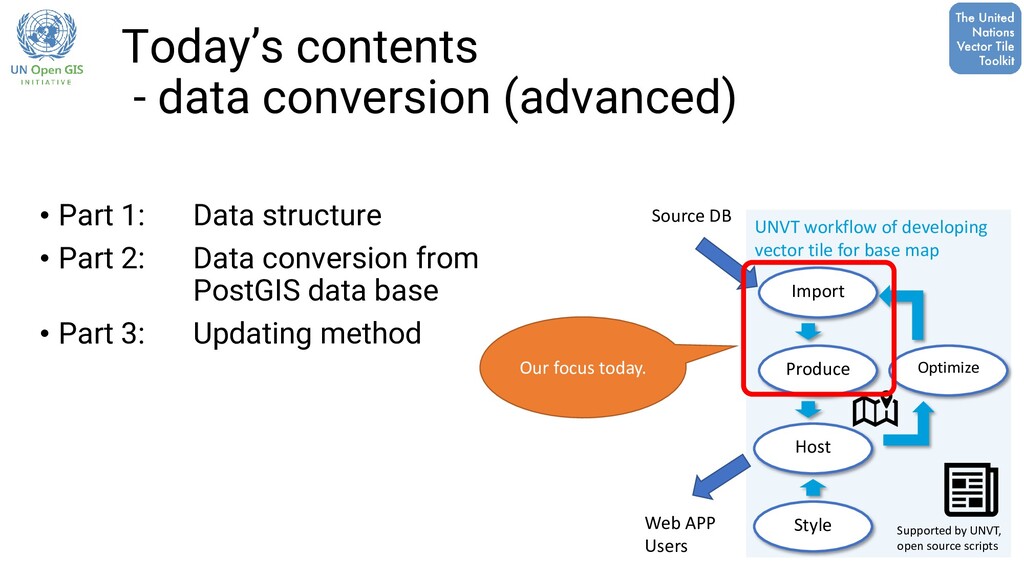
structure • Part 2: Data conversion from PostGIS data base • Part 3: Updating method Produce Host Style Optimize Import UNVT workflow of developing vector tile for base map Supported by UNVT, open source scripts Source DB Web APP Users Our focus today.
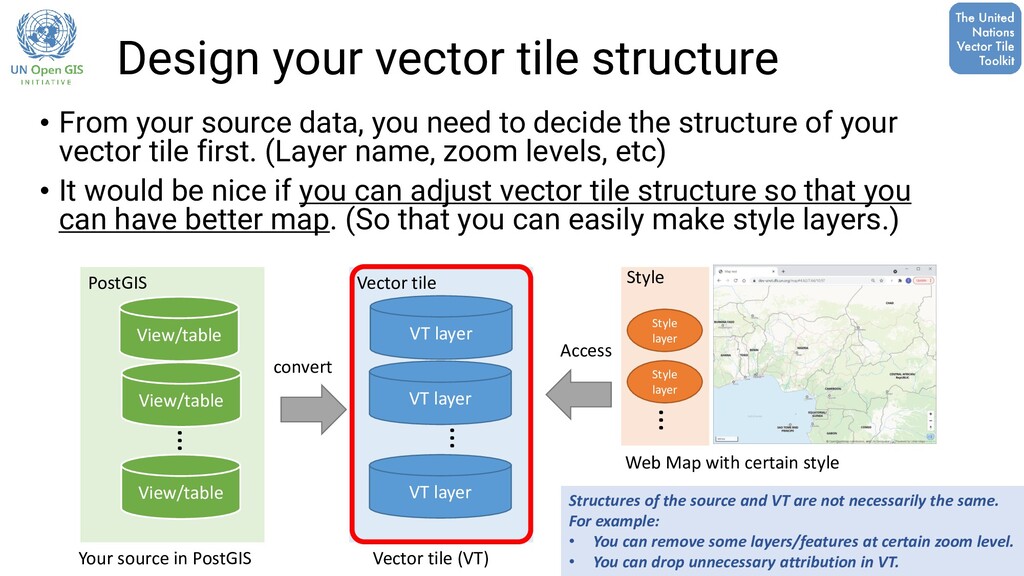
you need to decide the structure of your vector tile first. (Layer name, zoom levels, etc) • It would be nice if you can adjust vector tile structure so that you can have better map. (So that you can easily make style layers.) VT layer Vector tile (VT) Your source in PostGIS Web Map with certain style convert View/table VT layer VT layer View/table View/table … … PostGIS Vector tile Style layer Style layer … Style Access Structures of the source and VT are not necessarily the same. For example: • You can remove some layers/features at certain zoom level. • You can drop unnecessary attribution in VT.
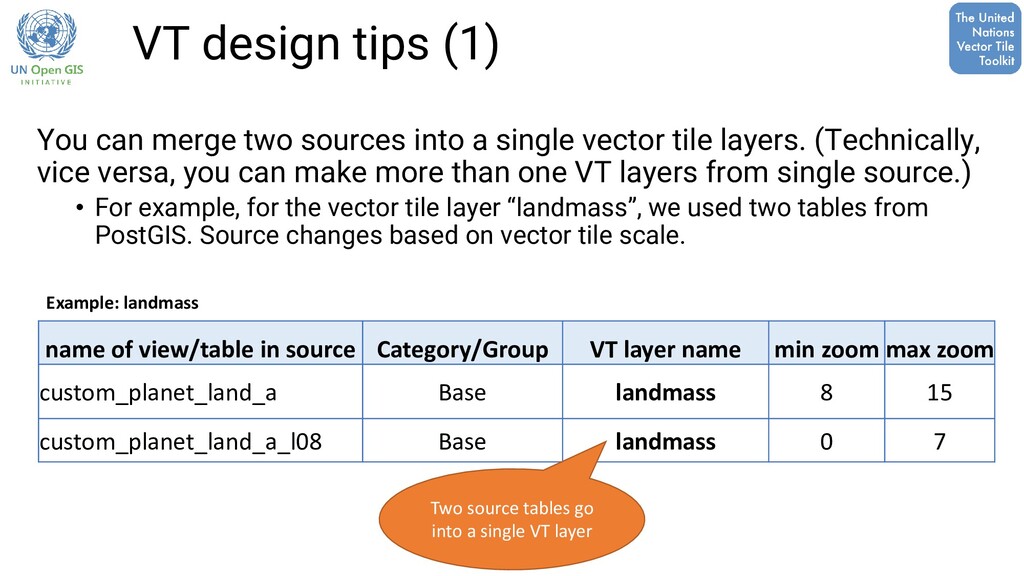
a single vector tile layers. (Technically, vice versa, you can make more than one VT layers from single source.) • For example, for the vector tile layer “landmass”, we used two tables from PostGIS. Source changes based on vector tile scale. name of view/table in source Category/Group VT layer name min zoom max zoom custom_planet_land_a Base landmass 8 15 custom_planet_land_a_l08 Base landmass 0 7 Two source tables go into a single VT layer Example: landmass
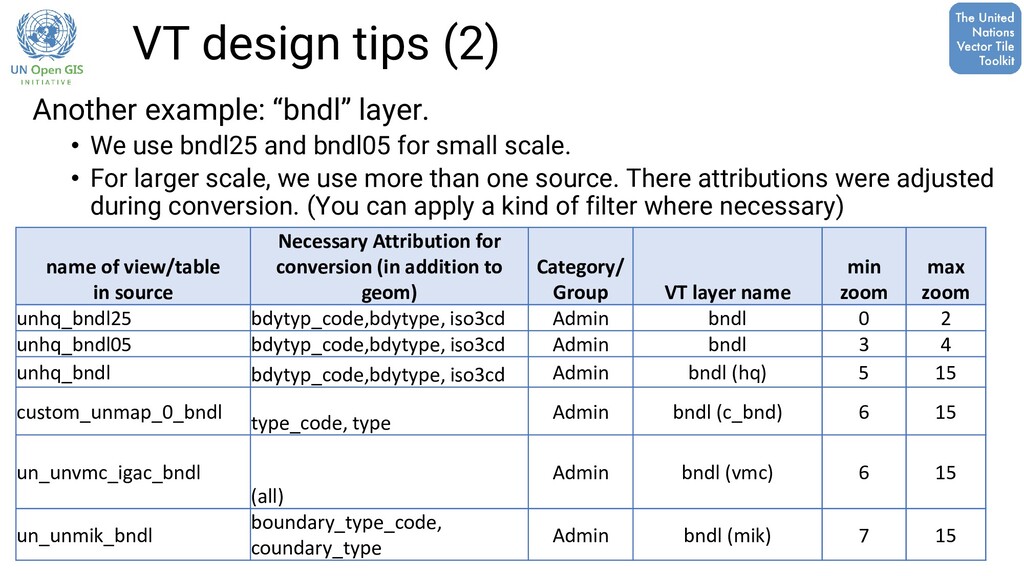
addition to geom) Category/ Group VT layer name min zoom max zoom unhq_bndl25 bdytyp_code,bdytype, iso3cd Admin bndl 0 2 unhq_bndl05 bdytyp_code,bdytype, iso3cd Admin bndl 3 4 unhq_bndl bdytyp_code,bdytype, iso3cd Admin bndl (hq) 5 15 custom_unmap_0_bndl type_code, type Admin bndl (c_bnd) 6 15 un_unvmc_igac_bndl (all) Admin bndl (vmc) 6 15 un_unmik_bndl boundary_type_code, coundary_type Admin bndl (mik) 7 15 Another example: “bndl” layer. • We use bndl25 and bndl05 for small scale. • For larger scale, we use more than one source. There attributions were adjusted during conversion. (You can apply a kind of filter where necessary) VT design tips (2)
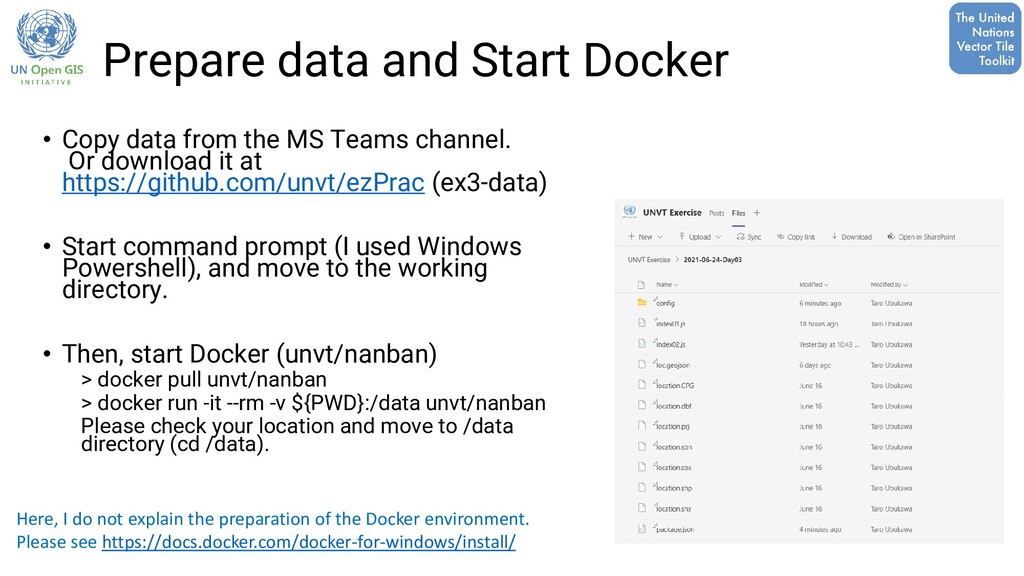
MS Teams channel. Or download it at https://github.com/unvt/ezPrac (ex3-data) • Start command prompt (I used Windows Powershell), and move to the working directory. • Then, start Docker (unvt/nanban) > docker pull unvt/nanban > docker run -it --rm -v ${PWD}:/data unvt/nanban Please check your location and move to /data directory (cd /data). Here, I do not explain the preparation of the Docker environment. Please see https://docs.docker.com/docker-for-windows/install/
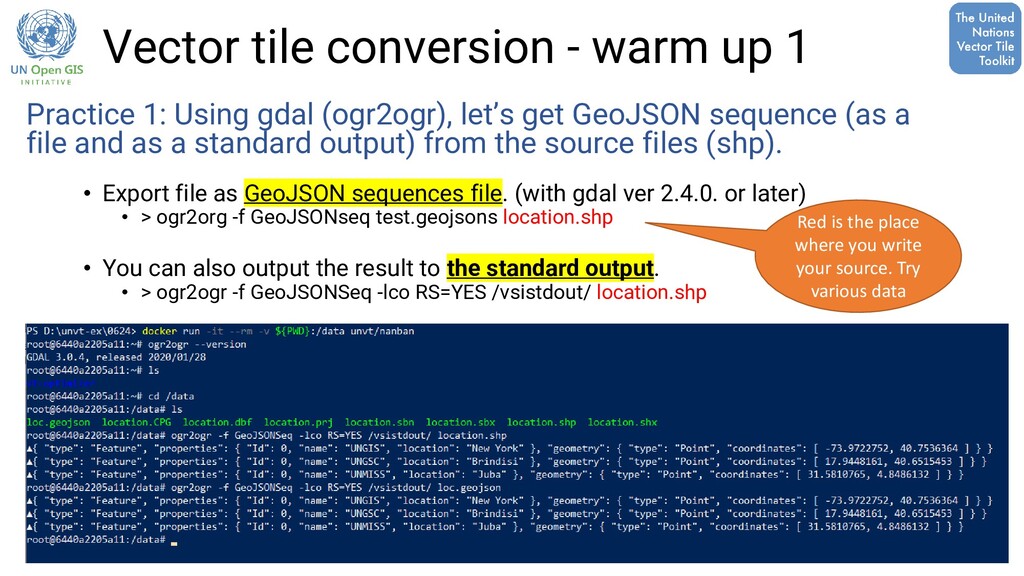
gdal (ogr2ogr), let’s get GeoJSON sequence (as a file and as a standard output) from the source files (shp). • Export file as GeoJSON sequences file. (with gdal ver 2.4.0. or later) • > ogr2org -f GeoJSONseq test.geojsons location.shp • You can also output the result to the standard output. • > ogr2ogr -f GeoJSONSeq -lco RS=YES /vsistdout/ location.shp Red is the place where you write your source. Try various data
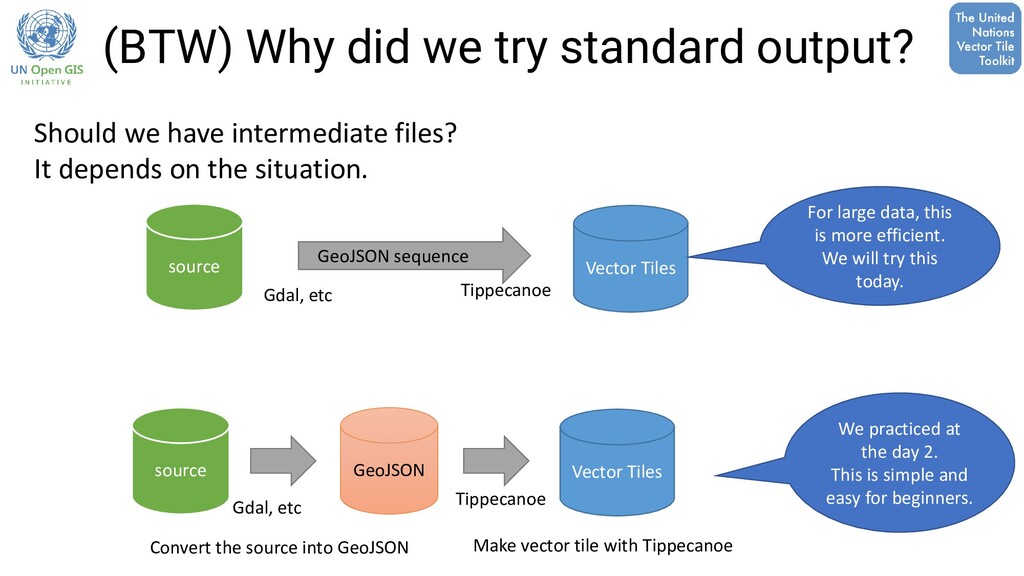
GeoJSON Convert the source into GeoJSON Make vector tile with Tippecanoe Vector Tiles source GeoJSON sequence Tippecanoe Tippecanoe Gdal, etc Gdal, etc We practiced at the day 2. This is simple and easy for beginners. For large data, this is more efficient. We will try this today. Should we have intermediate files? It depends on the situation.
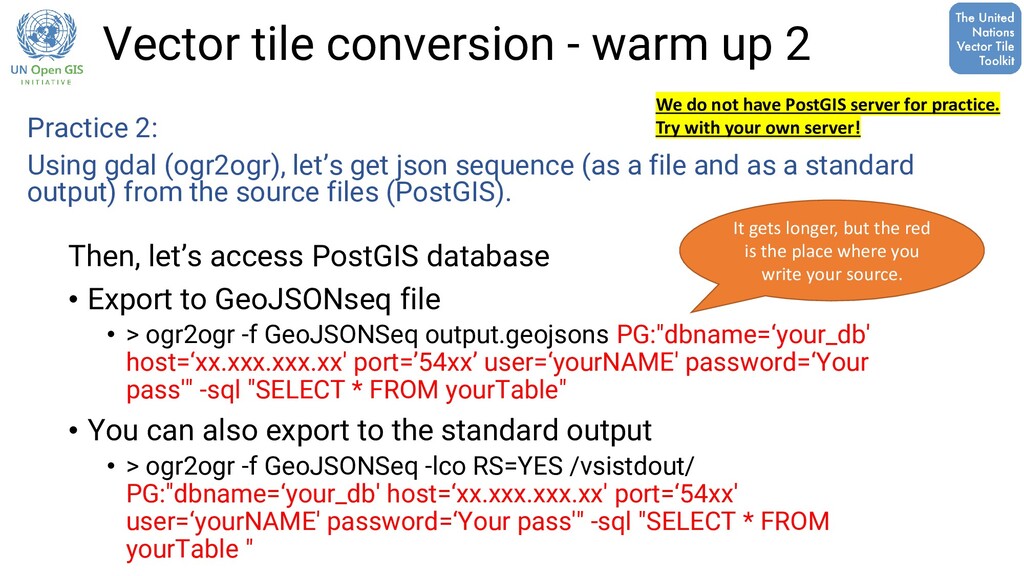
PostGIS database • Export to GeoJSONseq file • > ogr2ogr -f GeoJSONSeq output.geojsons PG:"dbname=‘your_db' host=‘xx.xxx.xxx.xx' port=’54xx’ user=‘yourNAME' password=‘Your pass'" -sql "SELECT * FROM yourTable" • You can also export to the standard output • > ogr2ogr -f GeoJSONSeq -lco RS=YES /vsistdout/ PG:"dbname=‘your_db' host=‘xx.xxx.xxx.xx' port=‘54xx' user=‘yourNAME' password=‘Your pass'" -sql "SELECT * FROM yourTable " Practice 2: Using gdal (ogr2ogr), let’s get json sequence (as a file and as a standard output) from the source files (PostGIS). It gets longer, but the red is the place where you write your source. We do not have PostGIS server for practice. Try with your own server!
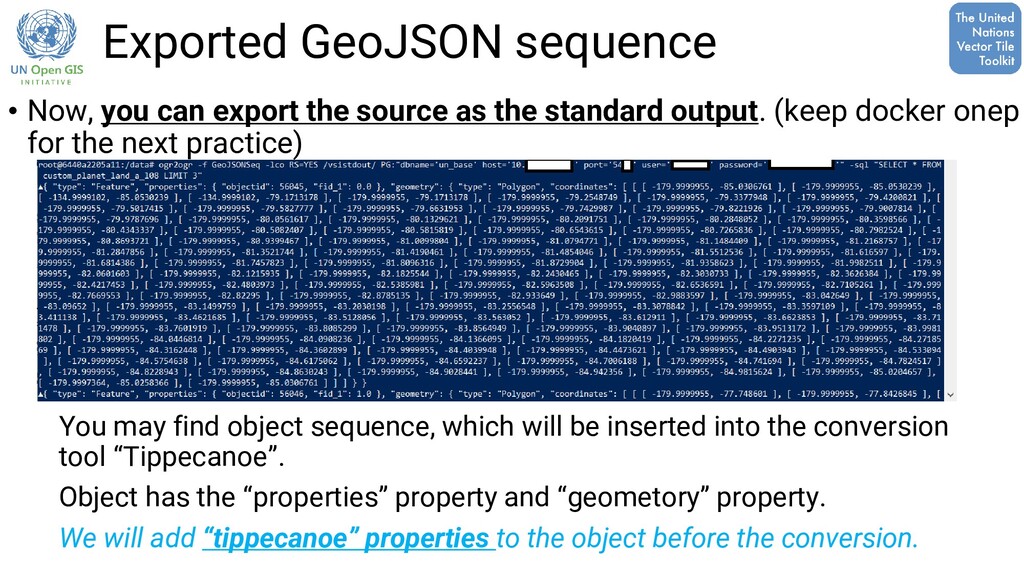
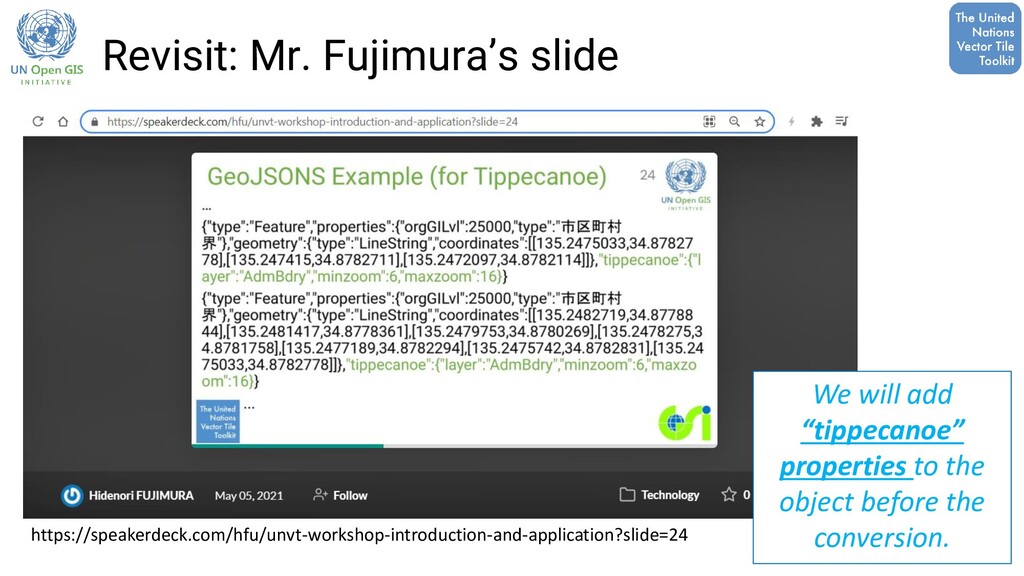
as the standard output. (keep docker onep for the next practice) You may find object sequence, which will be inserted into the conversion tool “Tippecanoe”. Object has the “properties” property and “geometory” property. We will add “tippecanoe” properties to the object before the conversion.
We will add “tippecanoe” properties to the object before the conversion. • We may also need to adjust properties before the conversion. How we can do it efficiently? → We will use nodejs. (Good at asynchronous processing as well. → Efficient conversion.)
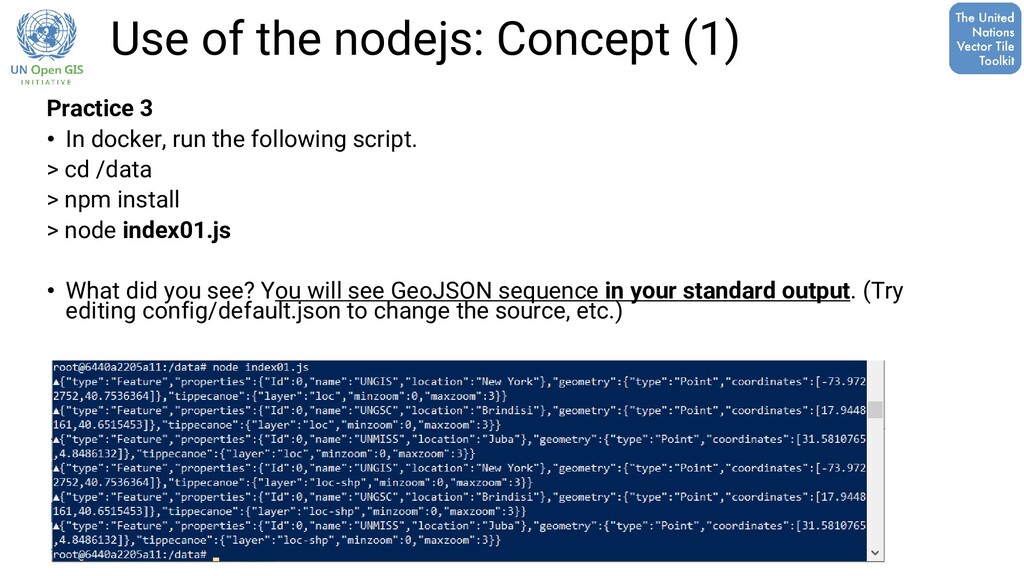
cd /data > npm install > node index01.js • What did you see? You will see GeoJSON sequence in your standard output. (Try editing config/default.json to change the source, etc.) Use of the nodejs: Concept (1)
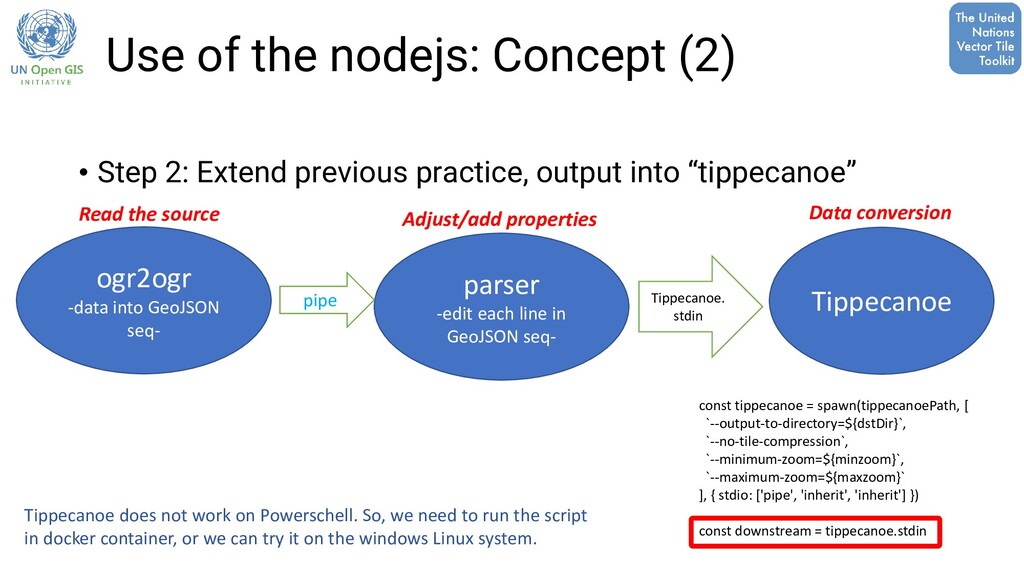
-data into GeoJSON seq- parser -edit each line in GeoJSON seq- pipe Tippecanoe. stdin Tippecanoe const tippecanoe = spawn(tippecanoePath, [ `--output-to-directory=${dstDir}`, `--no-tile-compression`, `--minimum-zoom=${minzoom}`, `--maximum-zoom=${maxzoom}` ], { stdio: ['pipe', 'inherit', 'inherit'] }) const downstream = tippecanoe.stdin Use of the nodejs: Concept (2) Tippecanoe does not work on Powerschell. So, we need to run the script in docker container, or we can try it on the windows Linux system. Read the source Adjust/add properties Data conversion
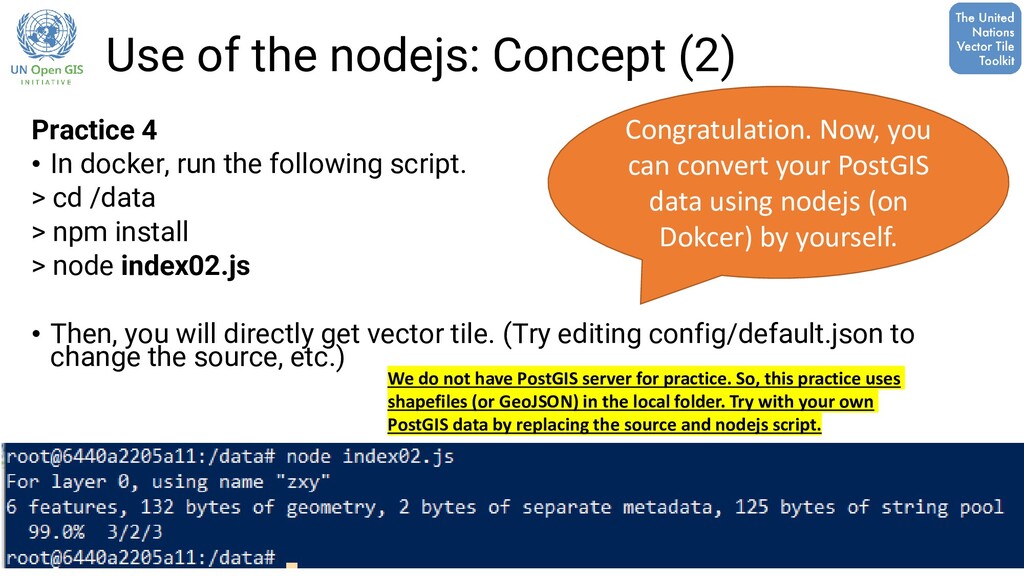
cd /data > npm install > node index02.js • Then, you will directly get vector tile. (Try editing config/default.json to change the source, etc.) Congratulation. Now, you can convert your PostGIS data using nodejs (on Dokcer) by yourself. Use of the nodejs: Concept (2) We do not have PostGIS server for practice. So, this practice uses shapefiles (or GeoJSON) in the local folder. Try with your own PostGIS data by replacing the source and nodejs script.
PostGIS, you can use gdal (ogr2ogr), but you can try one of nodejs packages named “pg”, which is non- blocking PostgreSQL client for nodejs. (Our UNVT tools often use it) Sometimes, PostGIS data is so large. It is hard for gdal to treat the data at once.
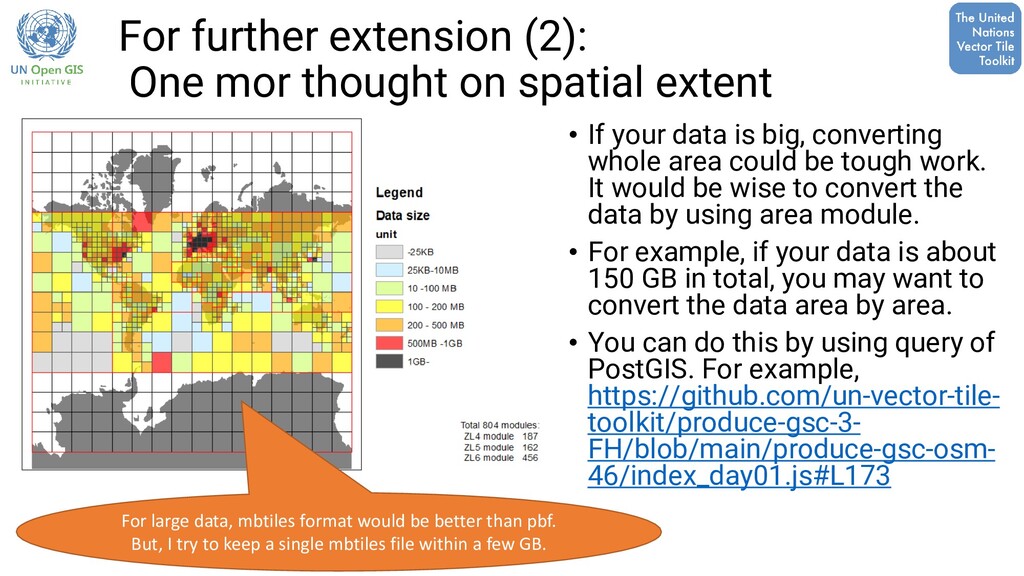
• If your data is big, converting whole area could be tough work. It would be wise to convert the data by using area module. • For example, if your data is about 150 GB in total, you may want to convert the data area by area. • You can do this by using query of PostGIS. For example, https://github.com/un-vector-tile- toolkit/produce-gsc-3- FH/blob/main/produce-gsc-osm- 46/index_day01.js#L173 For large data, mbtiles format would be better than pbf. But, I try to keep a single mbtiles file within a few GB.
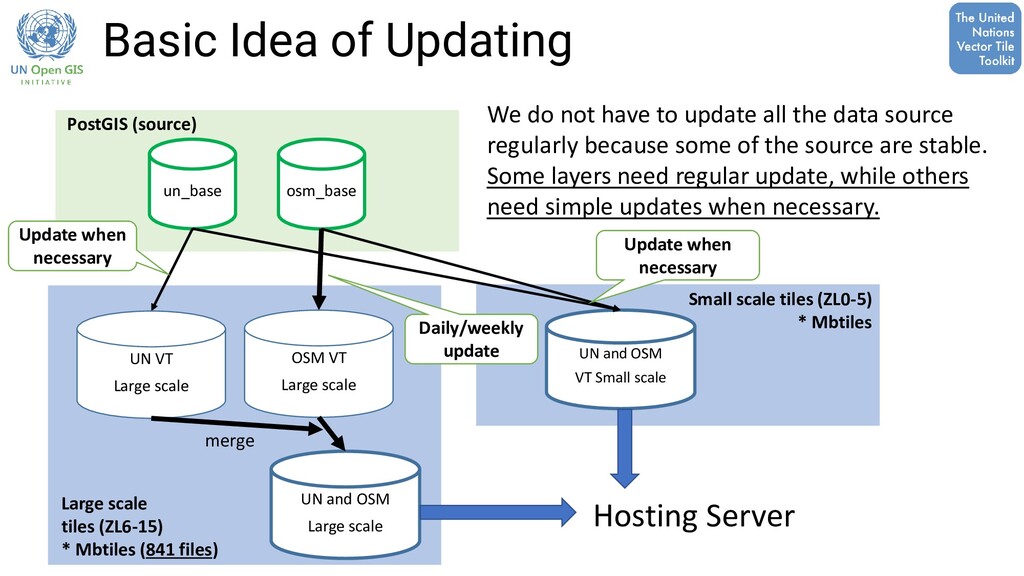
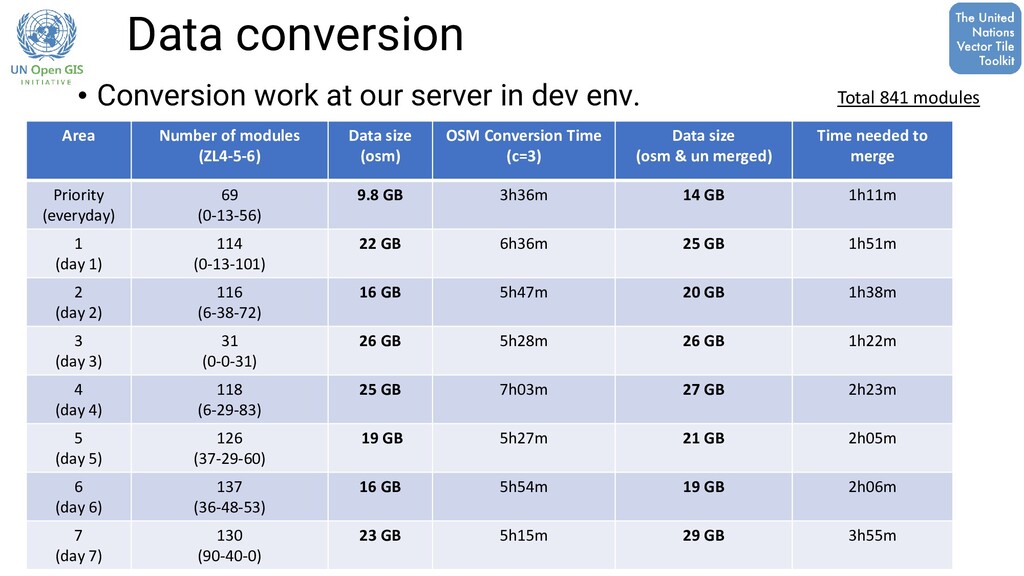
* Mbtiles (841 files) PostGIS (source) Small scale tiles (ZL0-5) * Mbtiles UN and OSM VT Small scale UN VT Large scale OSM VT Large scale UN and OSM Large scale Daily/weekly update Update when necessary We do not have to update all the data source regularly because some of the source are stable. Some layers need regular update, while others need simple updates when necessary. merge Hosting Server Update when necessary
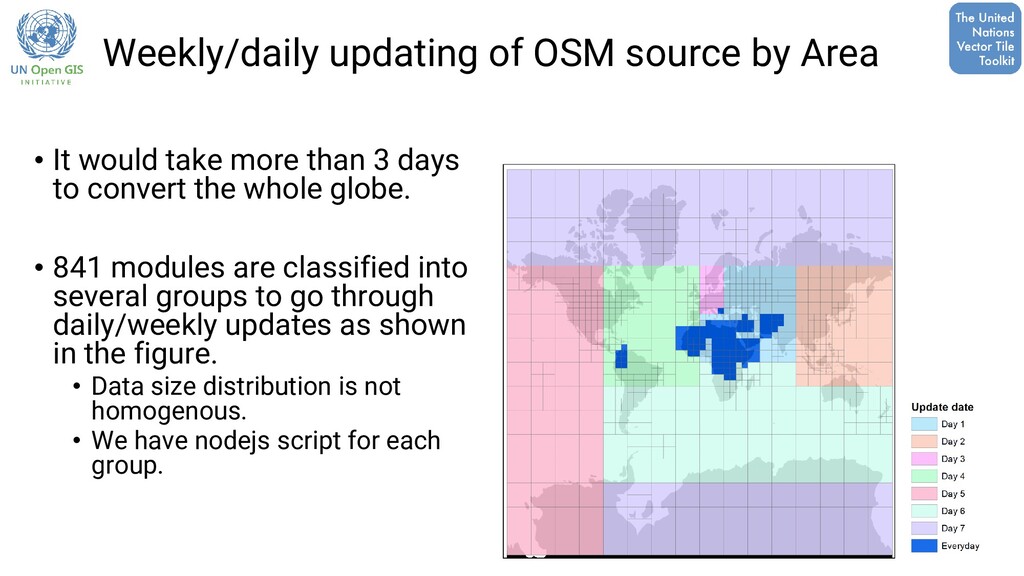
take more than 3 days to convert the whole globe. • 841 modules are classified into several groups to go through daily/weekly updates as shown in the figure. • Data size distribution is not homogenous. • We have nodejs script for each group.
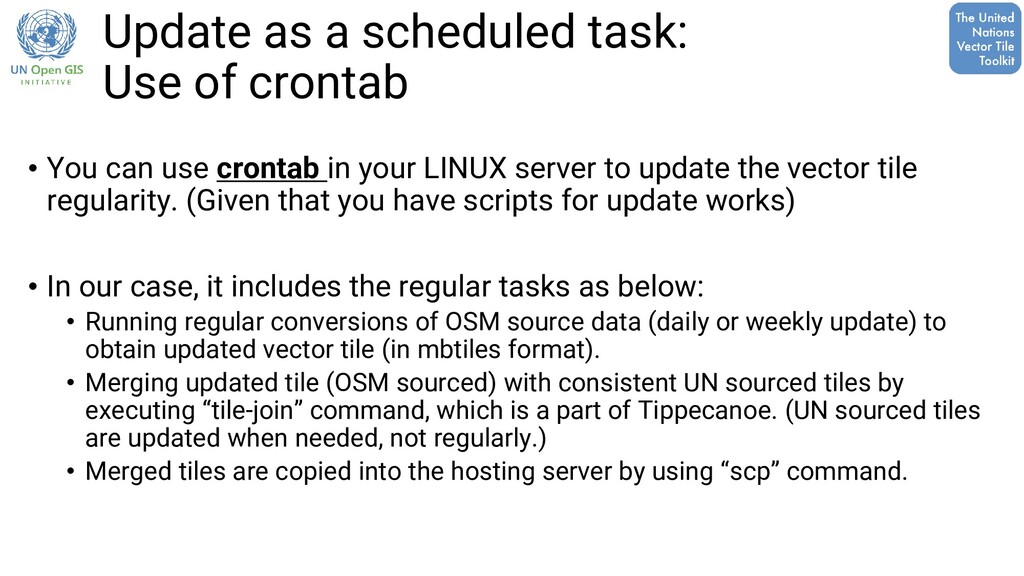
can use crontab in your LINUX server to update the vector tile regularity. (Given that you have scripts for update works) • In our case, it includes the regular tasks as below: • Running regular conversions of OSM source data (daily or weekly update) to obtain updated vector tile (in mbtiles format). • Merging updated tile (OSM sourced) with consistent UN sourced tiles by executing “tile-join” command, which is a part of Tippecanoe. (UN sourced tiles are updated when needed, not regularly.) • Merged tiles are copied into the hosting server by using “scp” command.
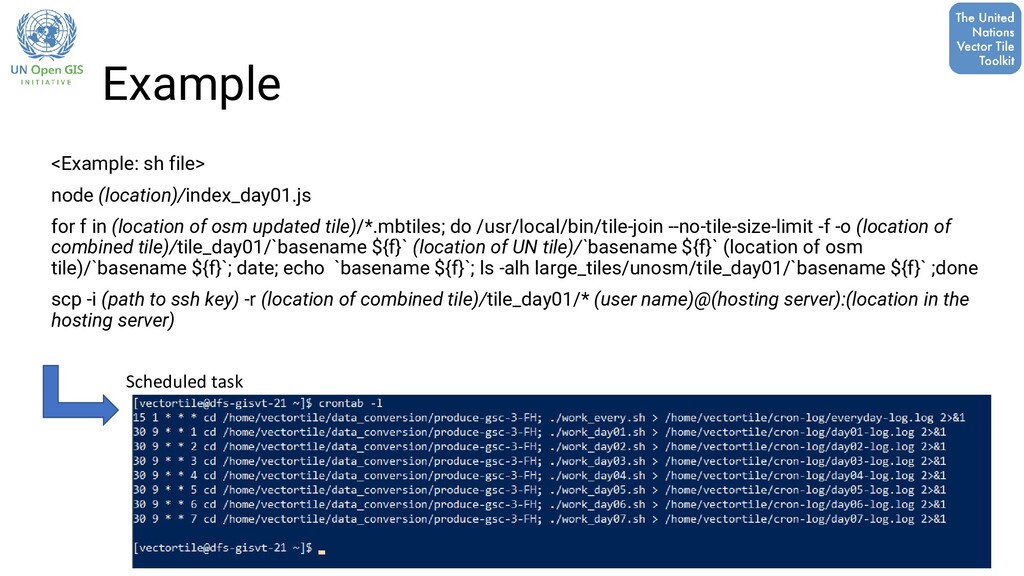
of osm updated tile)/*.mbtiles; do /usr/local/bin/tile-join --no-tile-size-limit -f -o (location of combined tile)/tile_day01/`basename ${f}` (location of UN tile)/`basename ${f}` (location of osm tile)/`basename ${f}`; date; echo `basename ${f}`; ls -alh large_tiles/unosm/tile_day01/`basename ${f}` ;done scp -i (path to ssh key) -r (location of combined tile)/tile_day01/* (user name)@(hosting server):(location in the hosting server) Scheduled task
design your vector tile structure. It is not necessarily the same with the source PostGIS table/view structure. • Part 2: You learned the basic idea of data conversion using nodejs. • Part 3: You learned how I update the vector tile in Linux server.