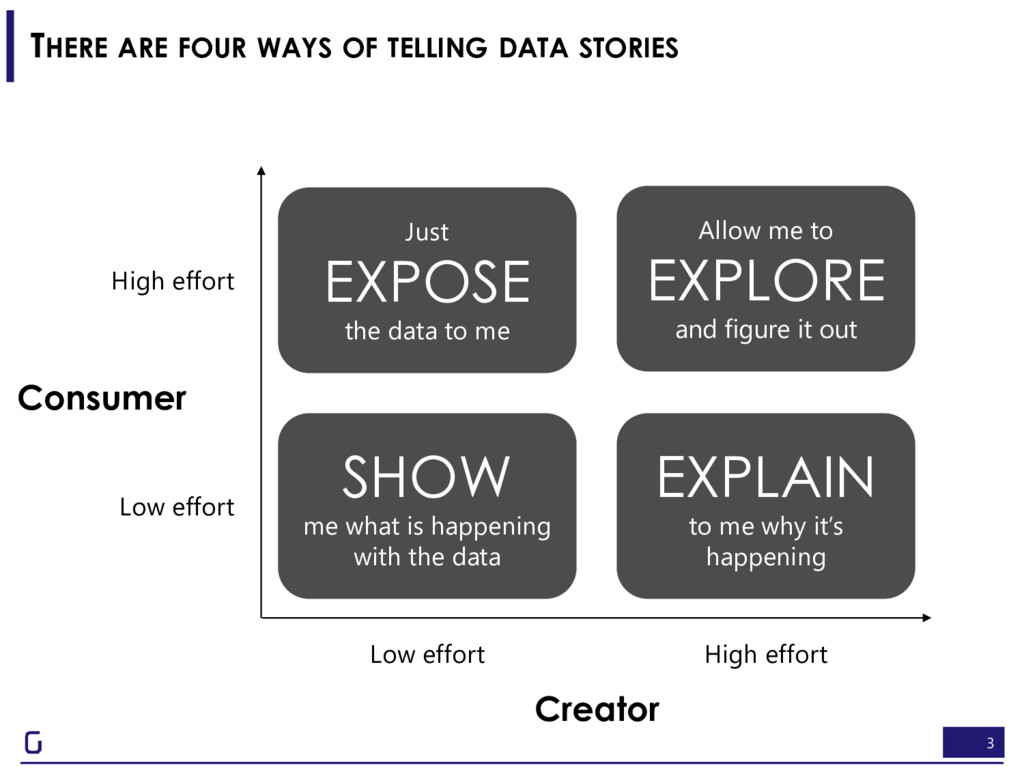
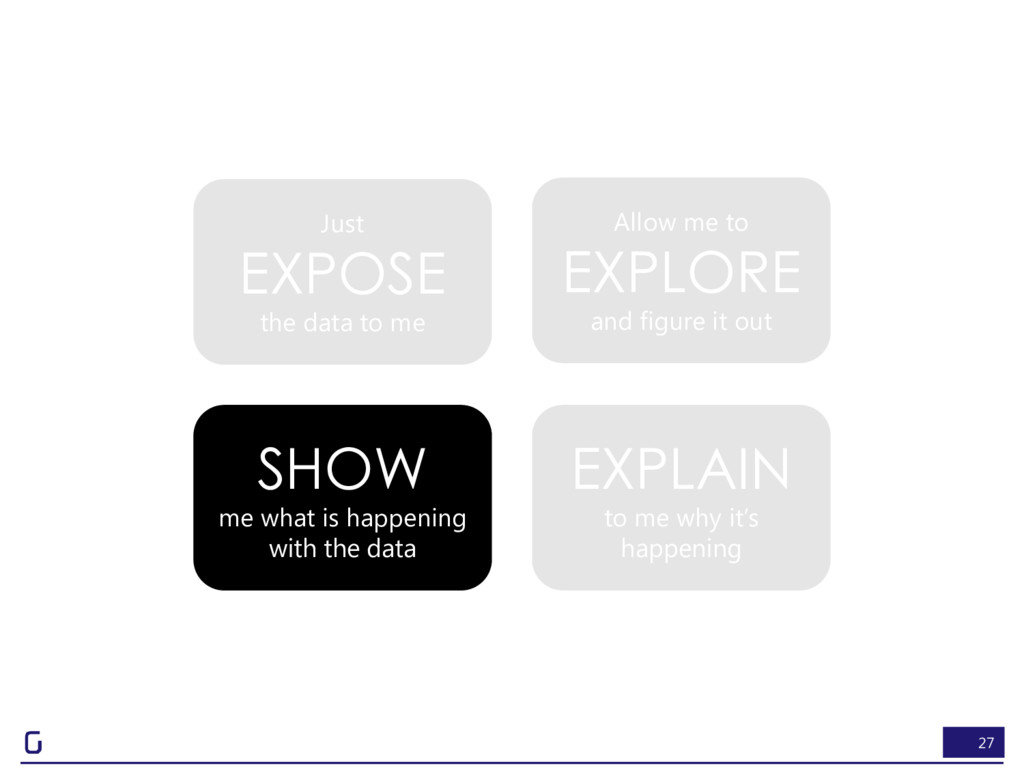
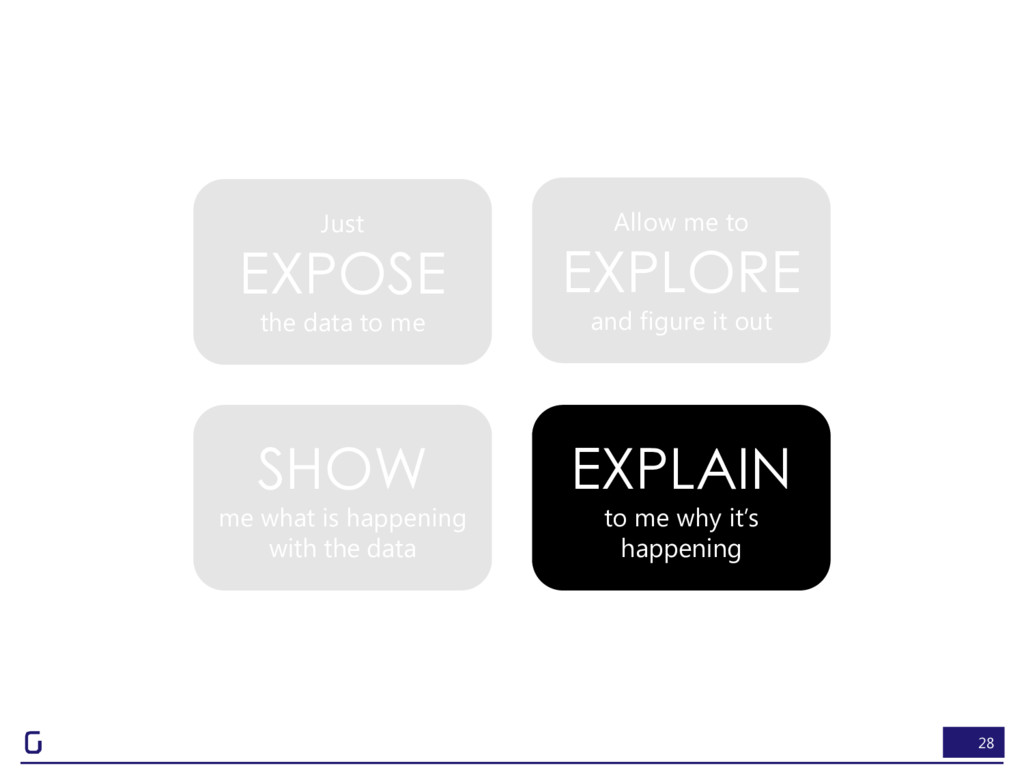
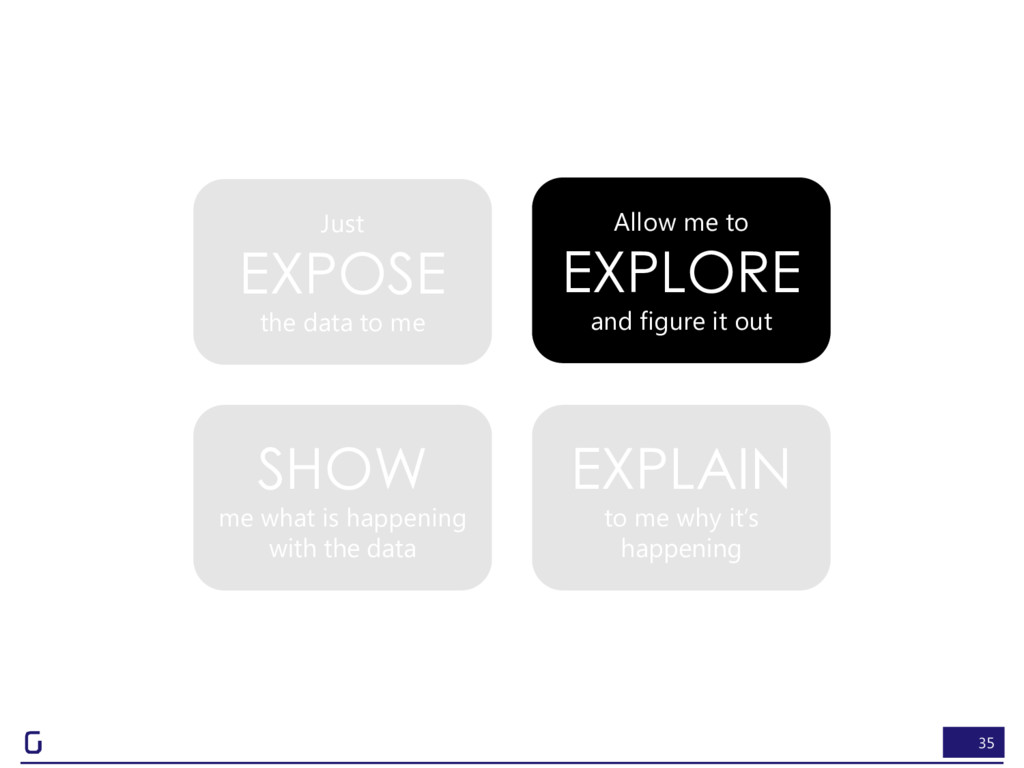
to me why it‟s happening Allow me to EXPLORE and figure it out Just EXPOSE the data to me Low effort High effort High effort Low effort Creator Consumer THERE ARE FOUR WAYS OF TELLING DATA STORIES
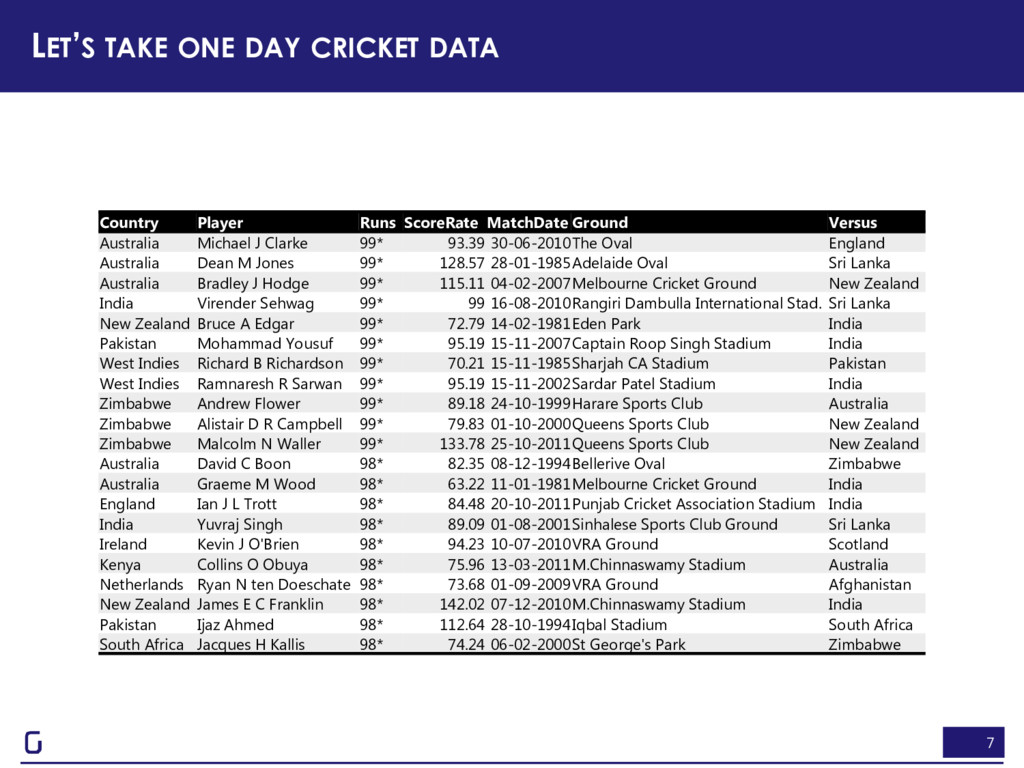
ScoreRate MatchDate Ground Versus Australia Michael J Clarke 99* 93.39 30-06-2010 The Oval England Australia Dean M Jones 99* 128.57 28-01-1985 Adelaide Oval Sri Lanka Australia Bradley J Hodge 99* 115.11 04-02-2007 Melbourne Cricket Ground New Zealand India Virender Sehwag 99* 99 16-08-2010 Rangiri Dambulla International Stad. Sri Lanka New Zealand Bruce A Edgar 99* 72.79 14-02-1981 Eden Park India Pakistan Mohammad Yousuf 99* 95.19 15-11-2007 Captain Roop Singh Stadium India West Indies Richard B Richardson 99* 70.21 15-11-1985 Sharjah CA Stadium Pakistan West Indies Ramnaresh R Sarwan 99* 95.19 15-11-2002 Sardar Patel Stadium India Zimbabwe Andrew Flower 99* 89.18 24-10-1999 Harare Sports Club Australia Zimbabwe Alistair D R Campbell 99* 79.83 01-10-2000 Queens Sports Club New Zealand Zimbabwe Malcolm N Waller 99* 133.78 25-10-2011 Queens Sports Club New Zealand Australia David C Boon 98* 82.35 08-12-1994 Bellerive Oval Zimbabwe Australia Graeme M Wood 98* 63.22 11-01-1981 Melbourne Cricket Ground India England Ian J L Trott 98* 84.48 20-10-2011 Punjab Cricket Association Stadium India India Yuvraj Singh 98* 89.09 01-08-2001 Sinhalese Sports Club Ground Sri Lanka Ireland Kevin J O'Brien 98* 94.23 10-07-2010 VRA Ground Scotland Kenya Collins O Obuya 98* 75.96 13-03-2011 M.Chinnaswamy Stadium Australia Netherlands Ryan N ten Doeschate 98* 73.68 01-09-2009 VRA Ground Afghanistan New Zealand James E C Franklin 98* 142.02 07-12-2010 M.Chinnaswamy Stadium India Pakistan Ijaz Ahmed 98* 112.64 28-10-1994 Iqbal Stadium South Africa South Africa Jacques H Kallis 98* 74.24 06-02-2000 St George's Park Zimbabwe
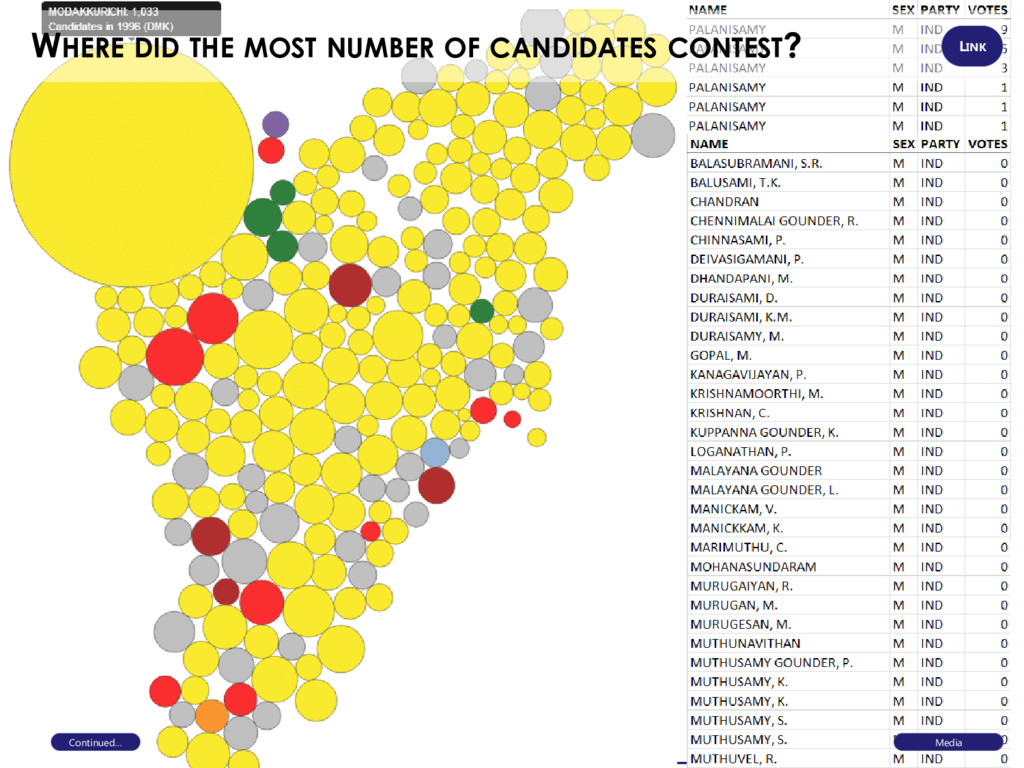
the children in schools know and can do at different stages of elementary education? Have the inputs made into the elementary education system had a beneficial effect or not? Education LINK Analytics Autolysis
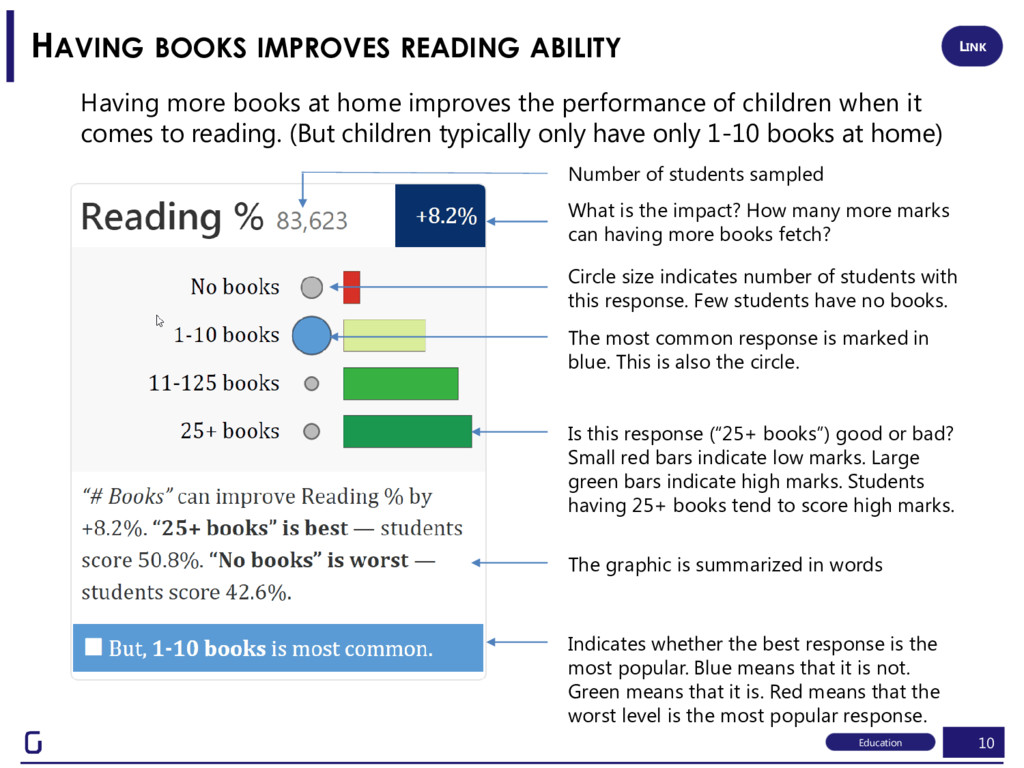
home improves the performance of children when it comes to reading. (But children typically only have only 1-10 books at home) Number of students sampled What is the impact? How many more marks can having more books fetch? Circle size indicates number of students with this response. Few students have no books. Is this response (“25+ books”) good or bad? Small red bars indicate low marks. Large green bars indicate high marks. Students having 25+ books tend to score high marks. The most common response is marked in blue. This is also the circle. The graphic is summarized in words Indicates whether the best response is the most popular. Blue means that it is not. Green means that it is. Red means that the worst level is the most popular response. Education LINK
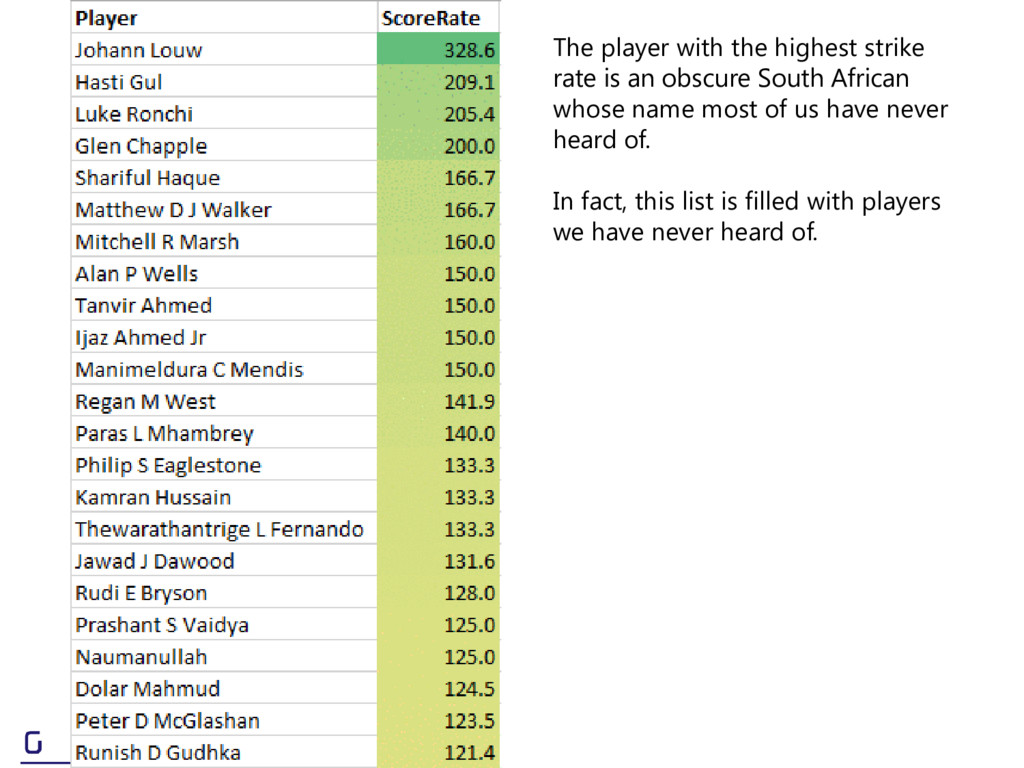
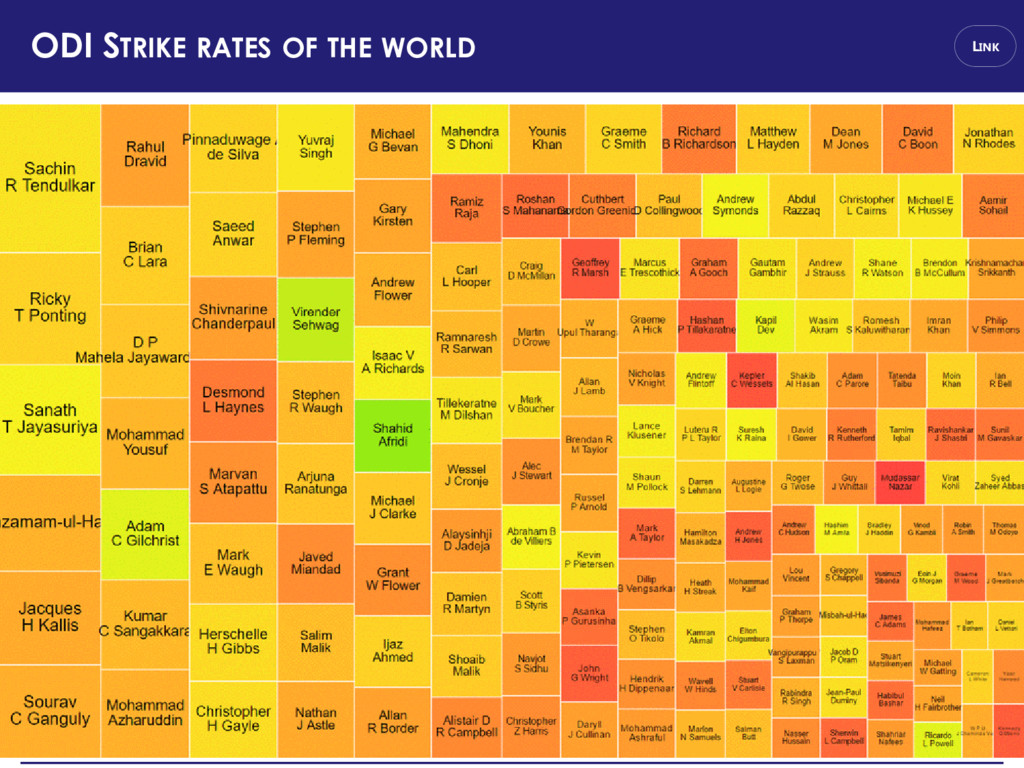
with the highest strike rate is an obscure South African whose name most of us have never heard of. In fact, this list is filled with players we have never heard of.
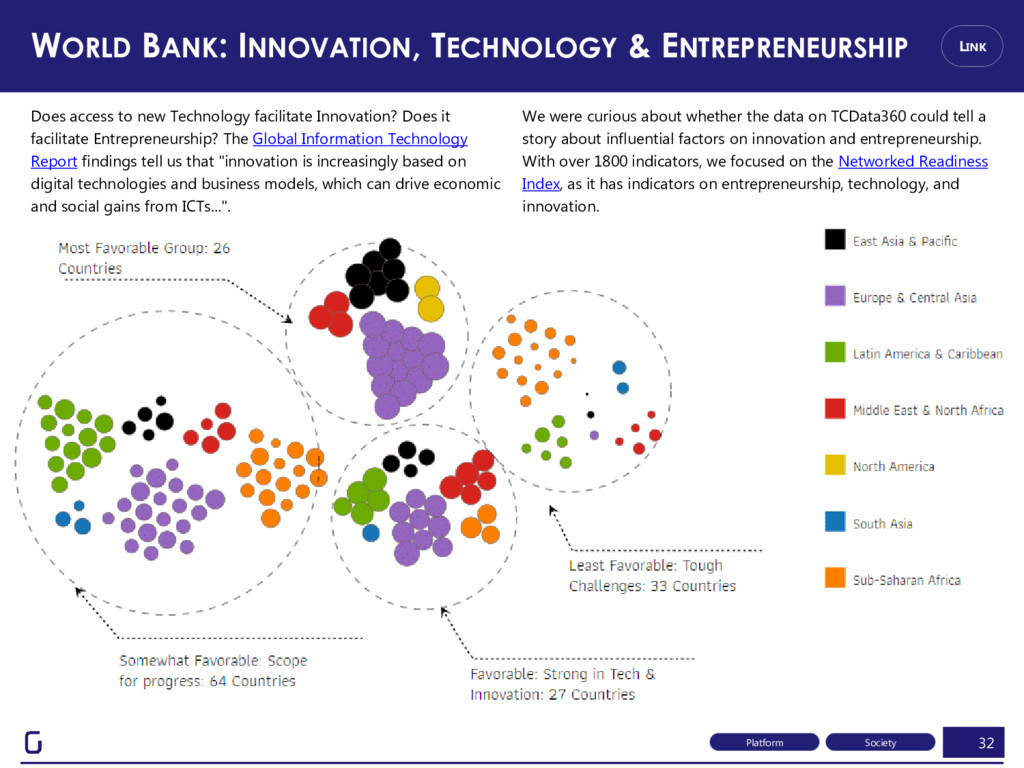
new Technology facilitate Innovation? Does it facilitate Entrepreneurship? The Global Information Technology Report findings tell us that "innovation is increasingly based on digital technologies and business models, which can drive economic and social gains from ICTs...". We were curious about whether the data on TCData360 could tell a story about influential factors on innovation and entrepreneurship. With over 1800 indicators, we focused on the Networked Readiness Index, as it has indicators on entrepreneurship, technology, and innovation. LINK Society Platform
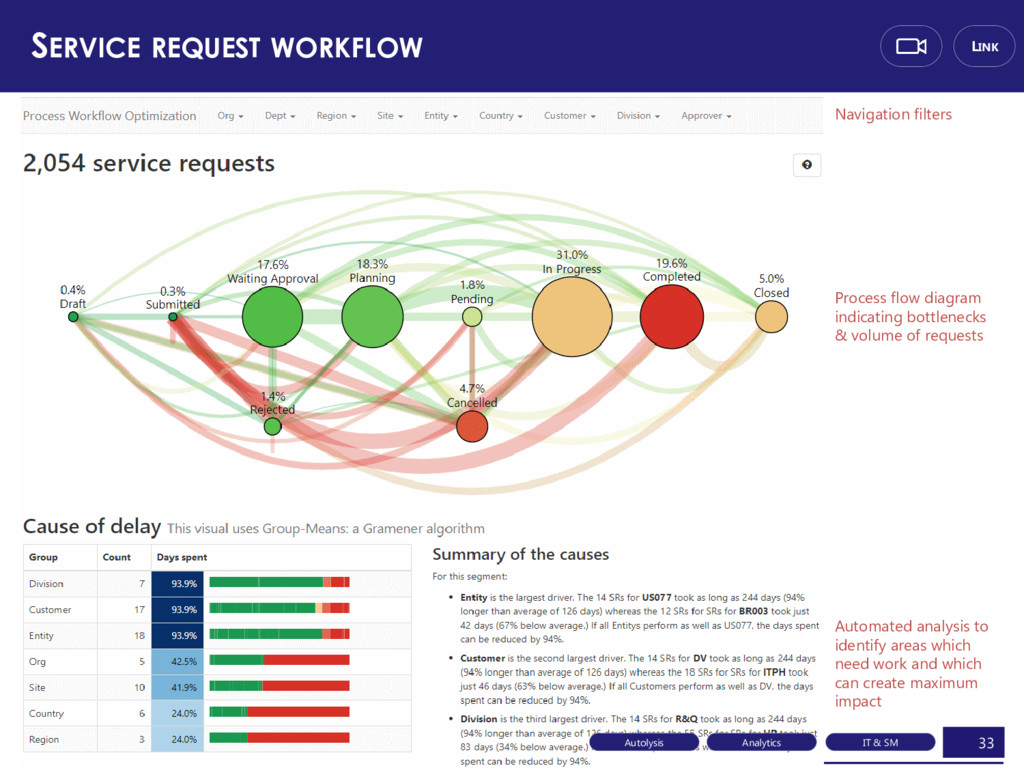
bottlenecks & volume of requests Automated analysis to identify areas which need work and which can create maximum impact LINK IT & SM Analytics Autolysis
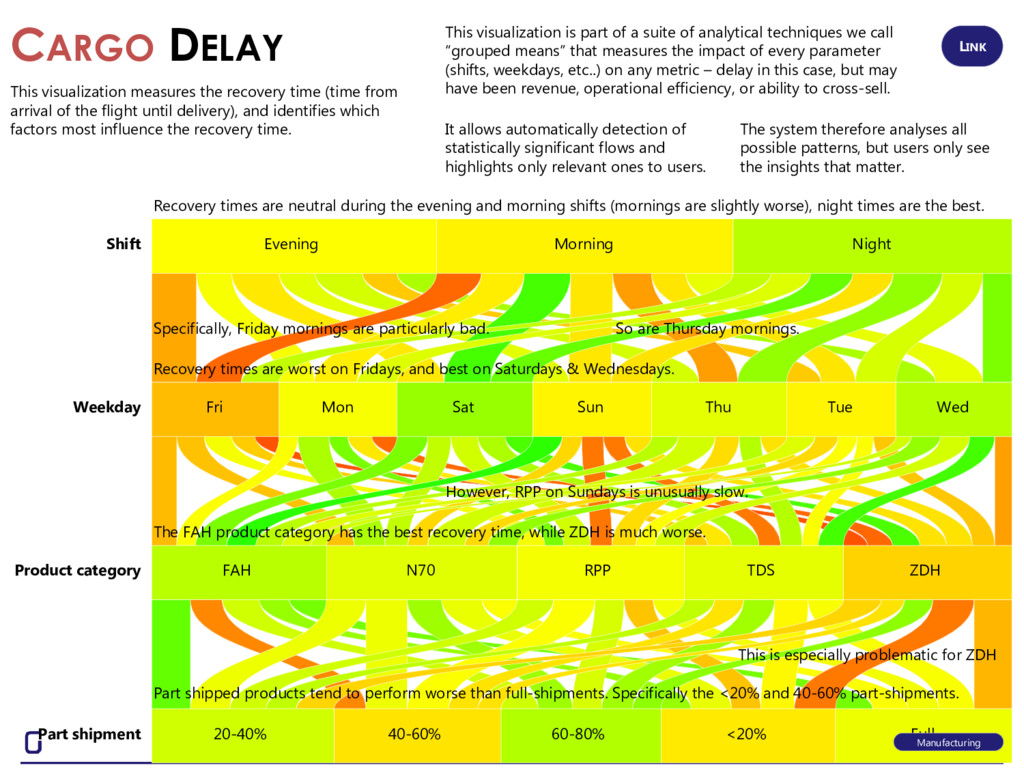
Thu Tue Wed Product category FAH N70 RPP TDS ZDH Part shipment 20-40% 40-60% 60-80% <20% Full This visualization measures the recovery time (time from arrival of the flight until delivery), and identifies which factors most influence the recovery time. Recovery times are neutral during the evening and morning shifts (mornings are slightly worse), night times are the best. Recovery times are worst on Fridays, and best on Saturdays & Wednesdays. Specifically, Friday mornings are particularly bad. So are Thursday mornings. The FAH product category has the best recovery time, while ZDH is much worse. However, RPP on Sundays is unusually slow. Part shipped products tend to perform worse than full-shipments. Specifically the <20% and 40-60% part-shipments. This is especially problematic for ZDH It allows automatically detection of statistically significant flows and highlights only relevant ones to users. The system therefore analyses all possible patterns, but users only see the insights that matter. CARGO DELAY This visualization is part of a suite of analytical techniques we call “grouped means” that measures the impact of every parameter (shifts, weekdays, etc..) on any metric – delay in this case, but may have been revenue, operational efficiency, or ability to cross-sell. Manufacturing LINK
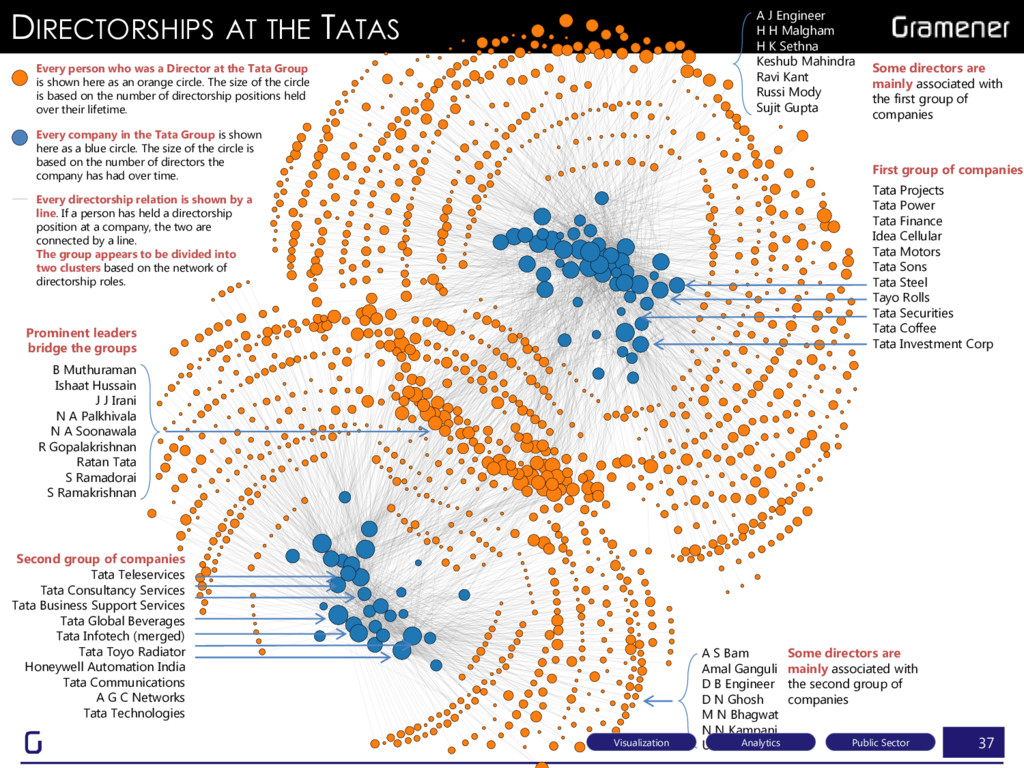
Tata Global Beverages Tata Infotech (merged) Tata Toyo Radiator Honeywell Automation India Tata Communications A G C Networks Tata Technologies Tata Projects Tata Power Tata Finance Idea Cellular Tata Motors Tata Sons Tata Steel Tayo Rolls Tata Securities Tata Coffee Tata Investment Corp A J Engineer H H Malgham H K Sethna Keshub Mahindra Ravi Kant Russi Mody Sujit Gupta A S Bam Amal Ganguli D B Engineer D N Ghosh M N Bhagwat N N Kampani U M Rao B Muthuraman Ishaat Hussain J J Irani N A Palkhivala N A Soonawala R Gopalakrishnan Ratan Tata S Ramadorai S Ramakrishnan DIRECTORSHIPS AT THE TATAS Every person who was a Director at the Tata Group is shown here as an orange circle. The size of the circle is based on the number of directorship positions held over their lifetime. Every company in the Tata Group is shown here as a blue circle. The size of the circle is based on the number of directors the company has had over time. Every directorship relation is shown by a line. If a person has held a directorship position at a company, the two are connected by a line. The group appears to be divided into two clusters based on the network of directorship roles. Prominent leaders bridge the groups Second group of companies First group of companies Some directors are mainly associated with the first group of companies Some directors are mainly associated with the second group of companies Public Sector Analytics Visualization
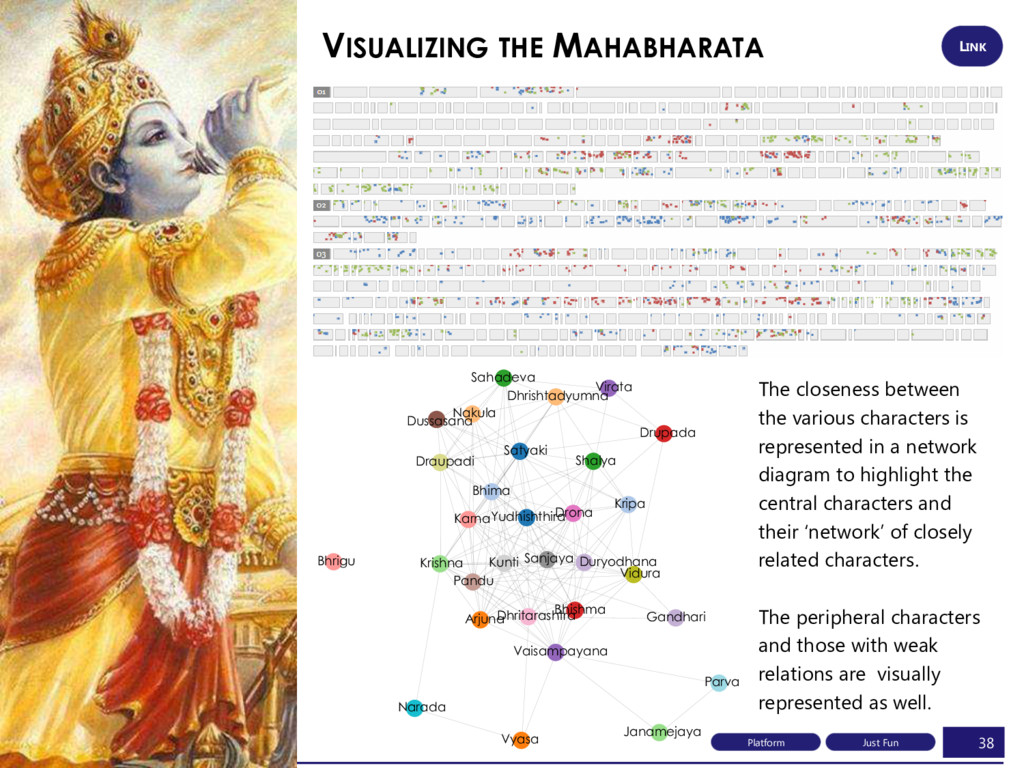
Krishna Bhishma Karna Vaisampayana Duryodhana Dussasana Pandu Drona Dhritarashtra Sanjaya Kunti Vidura Draupadi Narada Parva Satyaki Kripa Vyasa Dhrishtadyumna Shalya Janamejaya Drupada Bhrigu Virata Gandhari The closeness between the various characters is represented in a network diagram to highlight the central characters and their „network‟ of closely related characters. The peripheral characters and those with weak relations are visually represented as well. Just Fun Platform
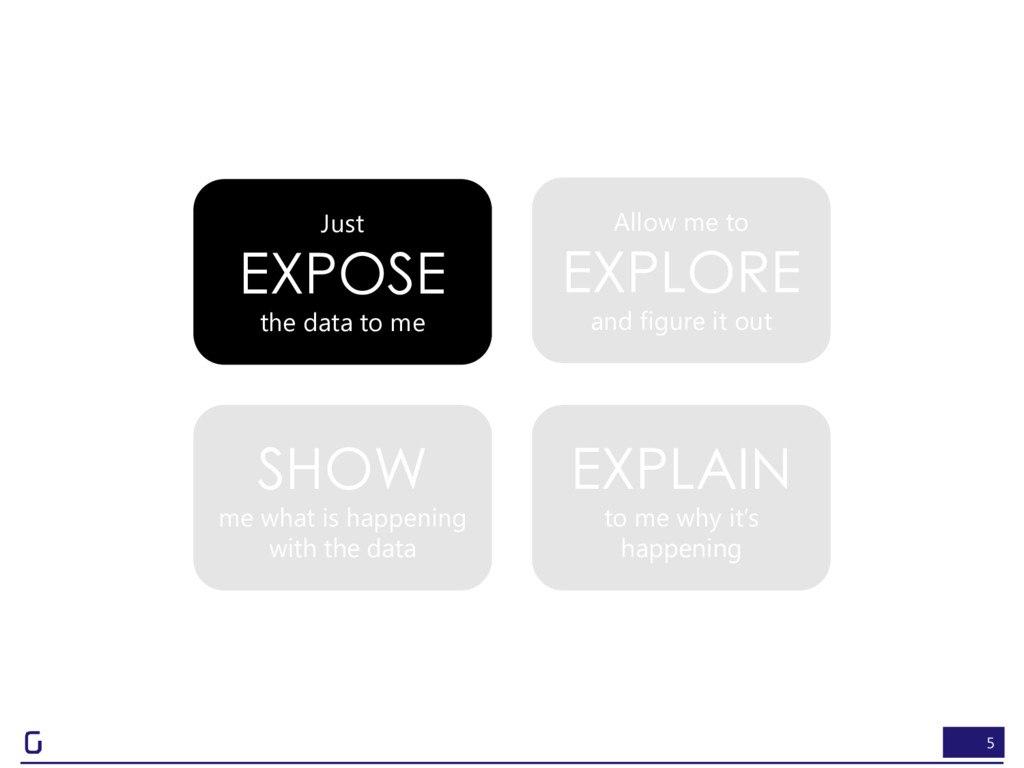
to me why it‟s happening Allow me to EXPLORE and figure it out Just EXPOSE the data to me Low effort High effort High effort Low effort Creator Consumer THERE ARE FOUR WAYS OF TELLING DATA STORIES