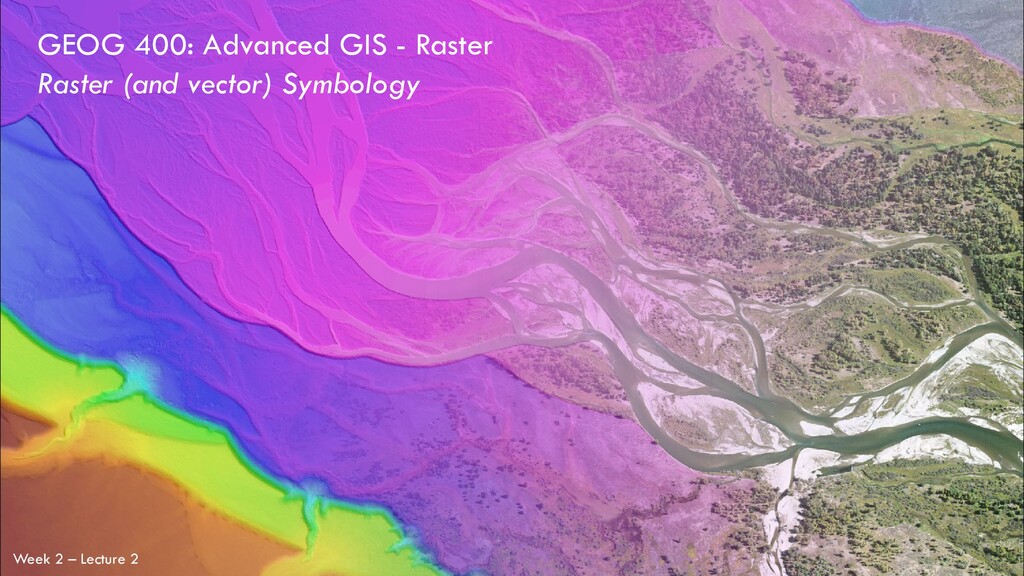
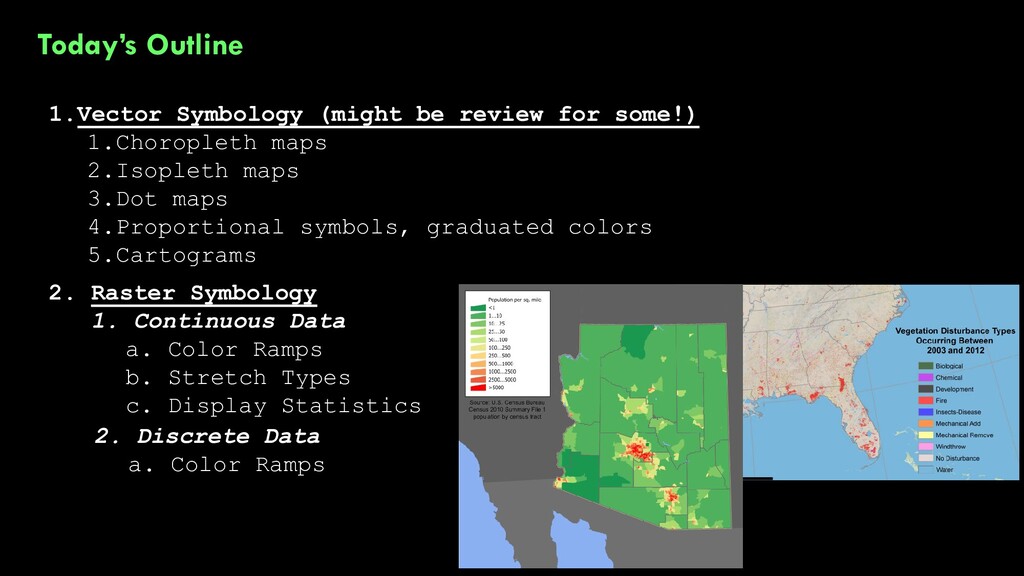
maps 2.Isopleth maps 3.Dot maps 4.Proportional symbols, graduated colors 5.Cartograms 2. Raster Symbology 1. Continuous Data a. Color Ramps b. Stretch Types c. Display Statistics 2. Discrete Data a. Color Ramps
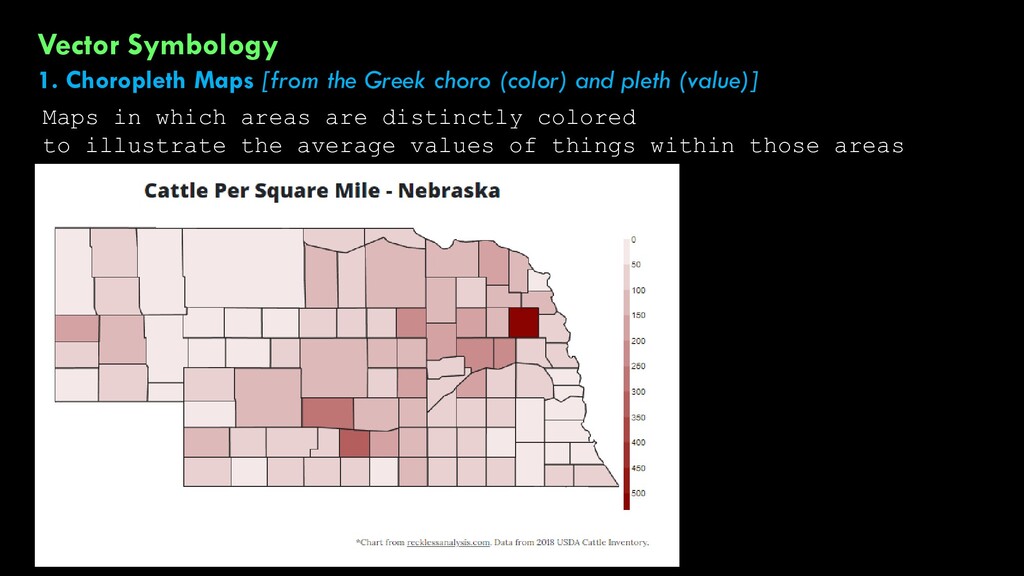
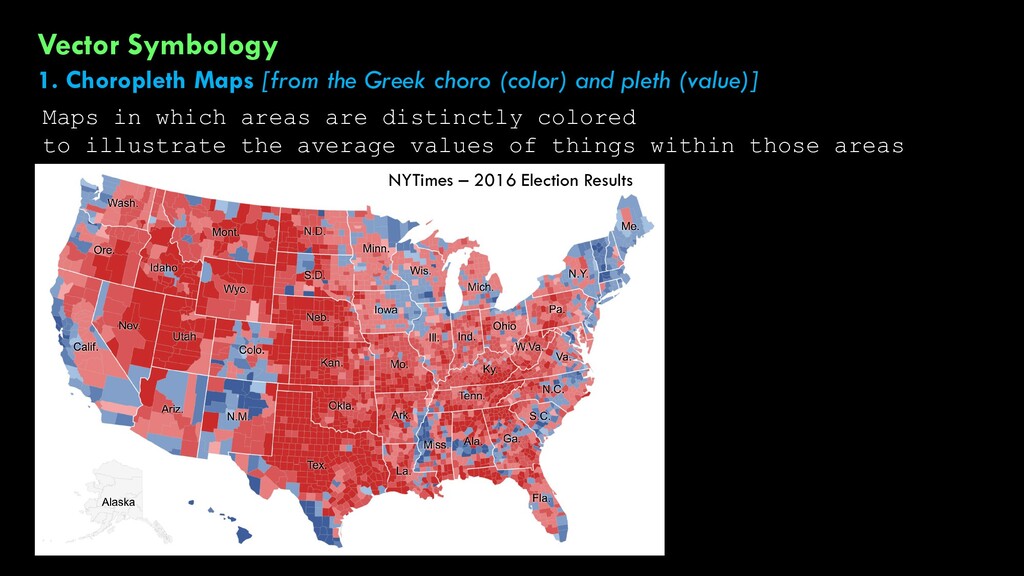
and pleth (value)] Maps in which areas are distinctly colored to illustrate the average values of things within those areas NYTimes – 2016 Election Results
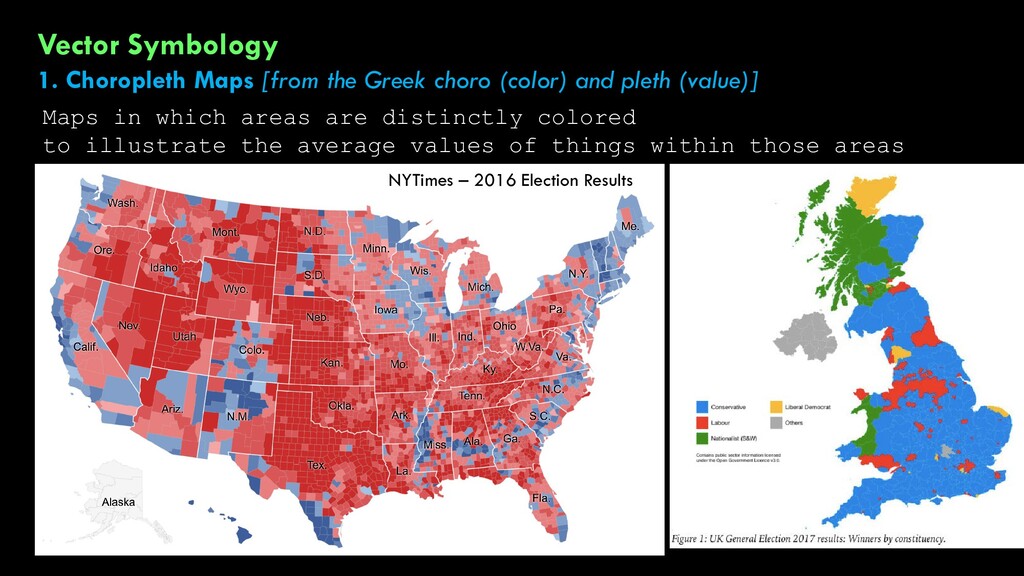
and pleth (value)] Maps in which areas are distinctly colored to illustrate the average values of things within those areas NYTimes – 2016 Election Results
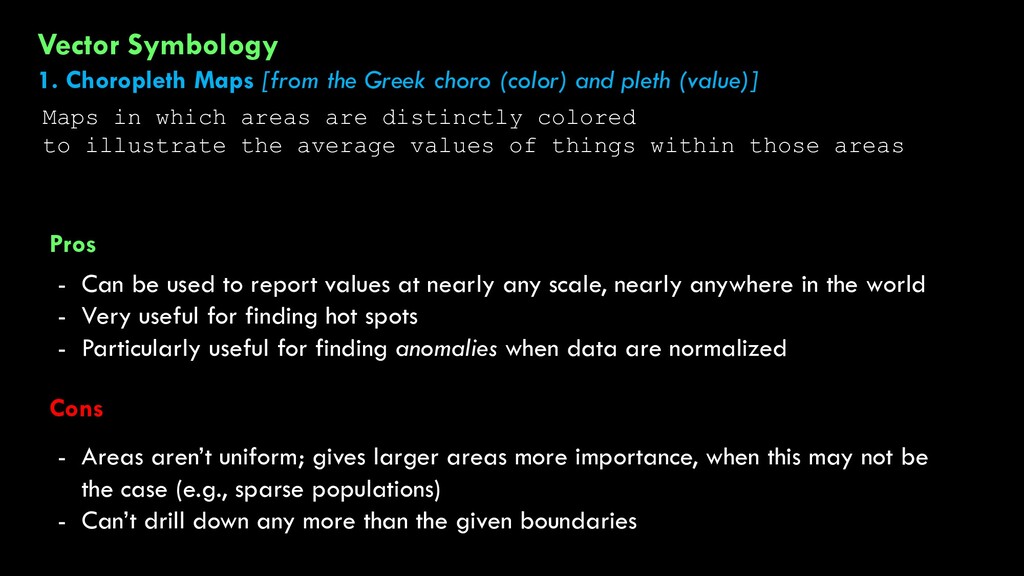
and pleth (value)] Maps in which areas are distinctly colored to illustrate the average values of things within those areas NYTimes – 2016 Election Results Pros Cons - Can be used to report values at nearly any scale, nearly anywhere in the world - Very useful for finding hot spots - Particularly useful for finding anomalies when data are normalized - Areas aren’t uniform; gives larger areas more importance, when this may not be the case (e.g., sparse populations) - Can’t drill down any more than the given boundaries
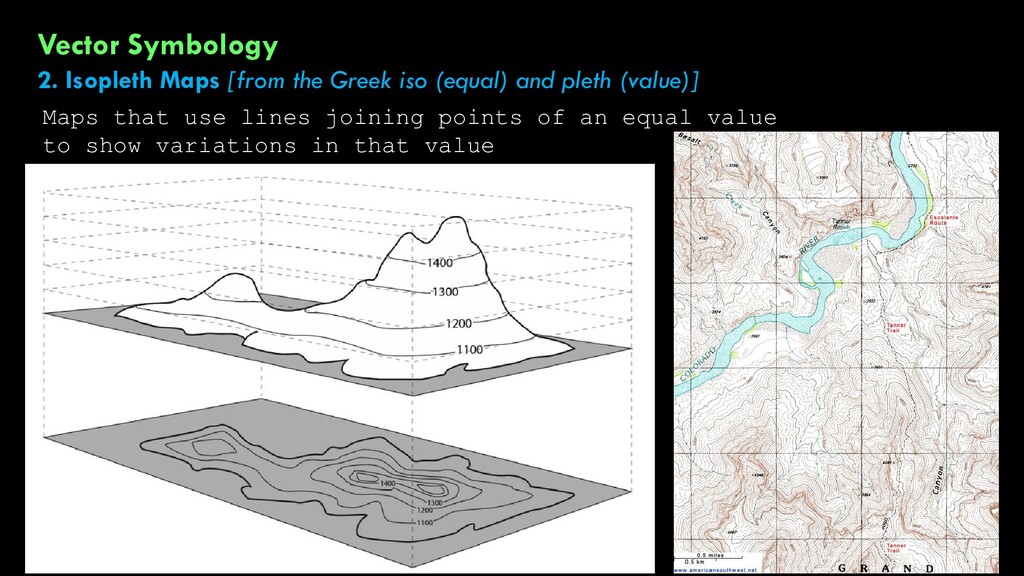
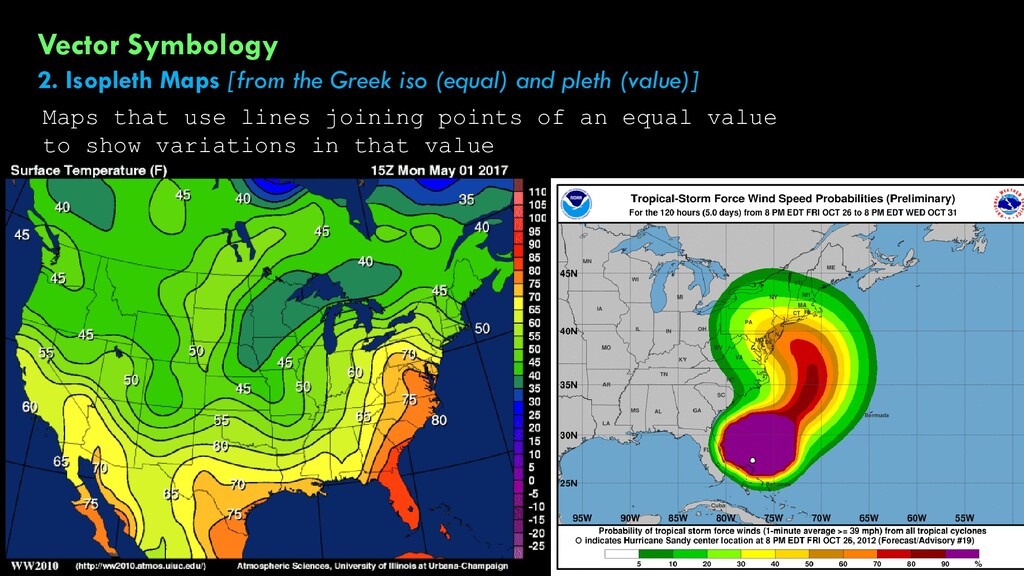
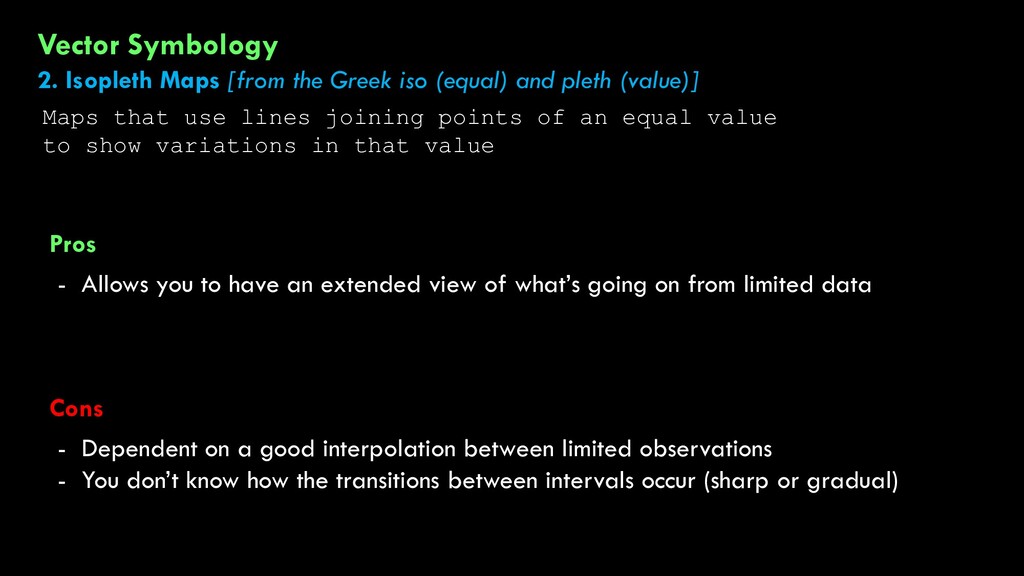
of what’s going on from limited data Vector Symbology 2. Isopleth Maps [from the Greek iso (equal) and pleth (value)] Maps that use lines joining points of an equal value to show variations in that value - Dependent on a good interpolation between limited observations - You don’t know how the transitions between intervals occur (sharp or gradual)
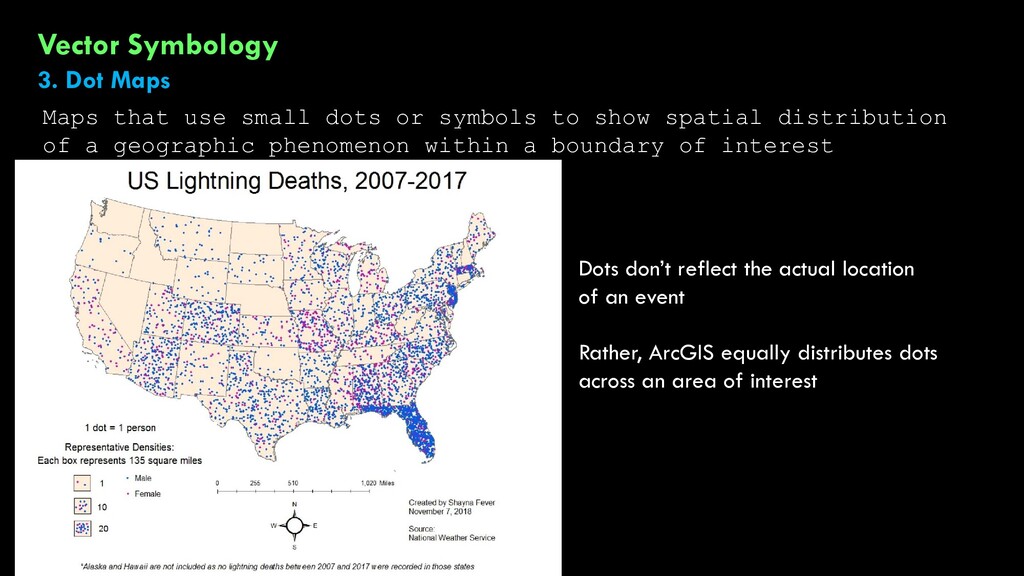
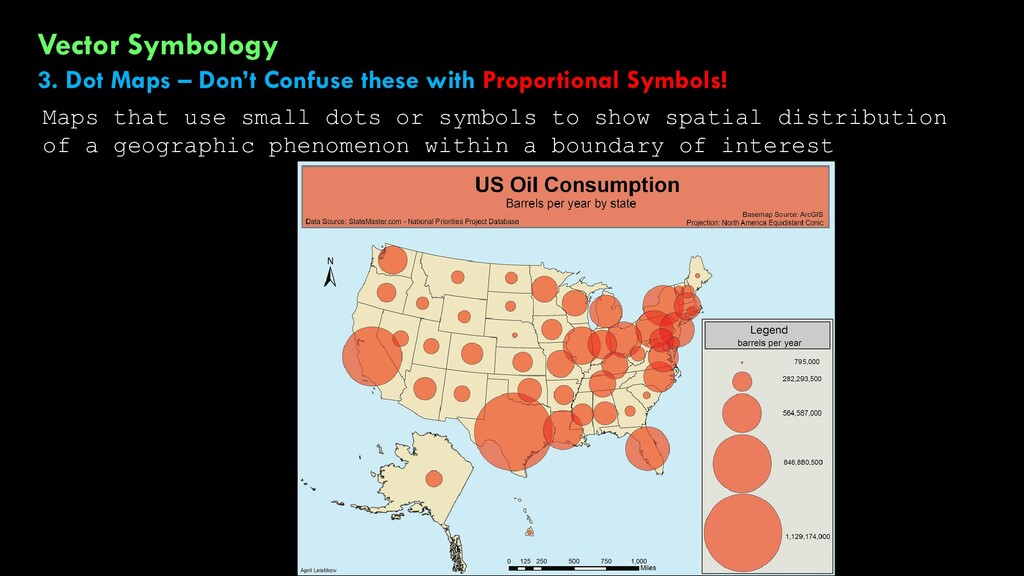
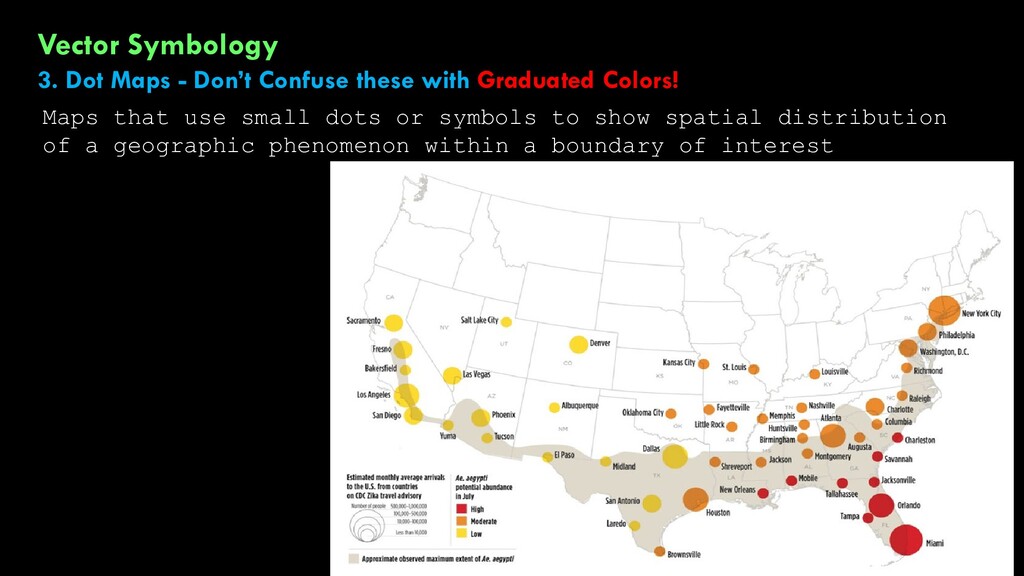
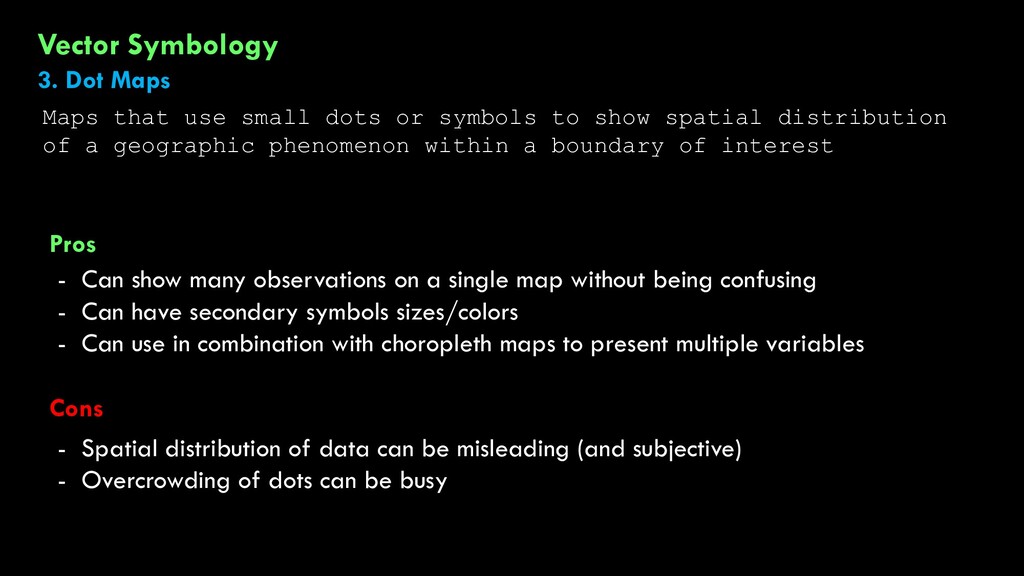
or symbols to show spatial distribution of a geographic phenomenon within a boundary of interest Dots don’t reflect the actual location of an event Rather, ArcGIS equally distributes dots across an area of interest
or symbols to show spatial distribution of a geographic phenomenon within a boundary of interest Dots don’t reflect the actual location of an event Rather, ArcGIS equally distributes dots across an area of interest
or symbols to show spatial distribution of a geographic phenomenon within a boundary of interest Pros Cons - Spatial distribution of data can be misleading (and subjective) - Overcrowding of dots can be busy - Can show many observations on a single map without being confusing - Can have secondary symbols sizes/colors - Can use in combination with choropleth maps to present multiple variables
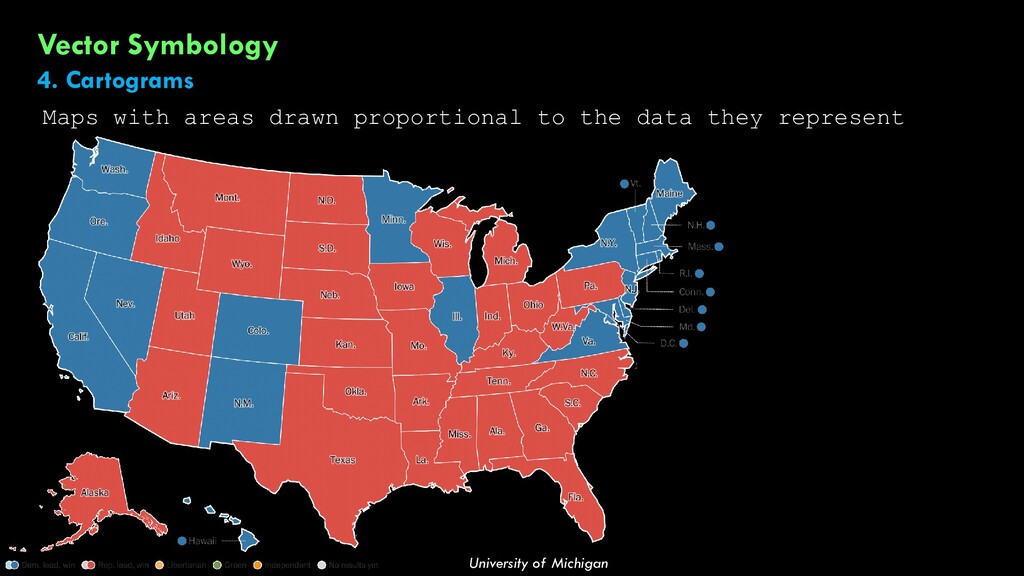
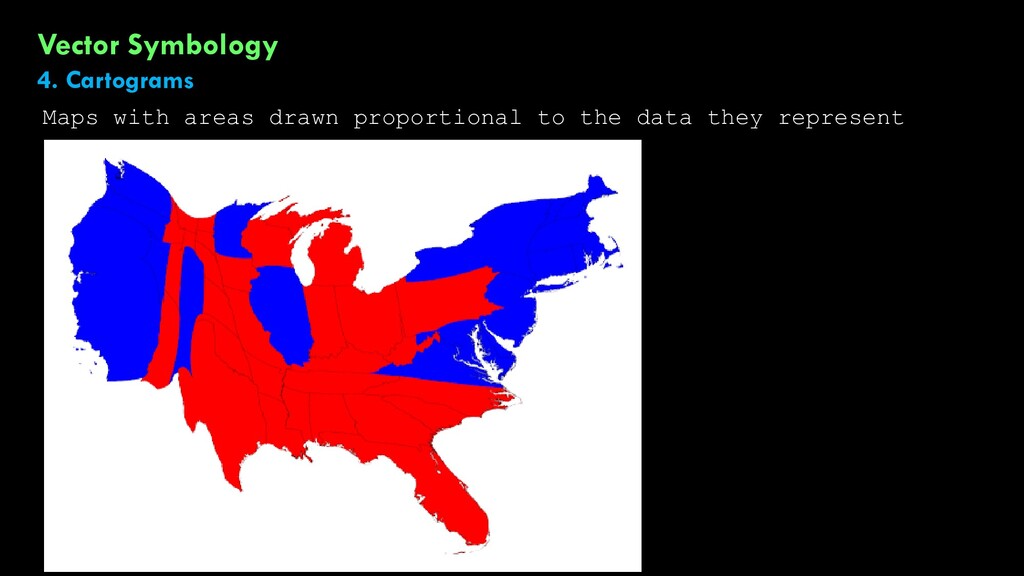
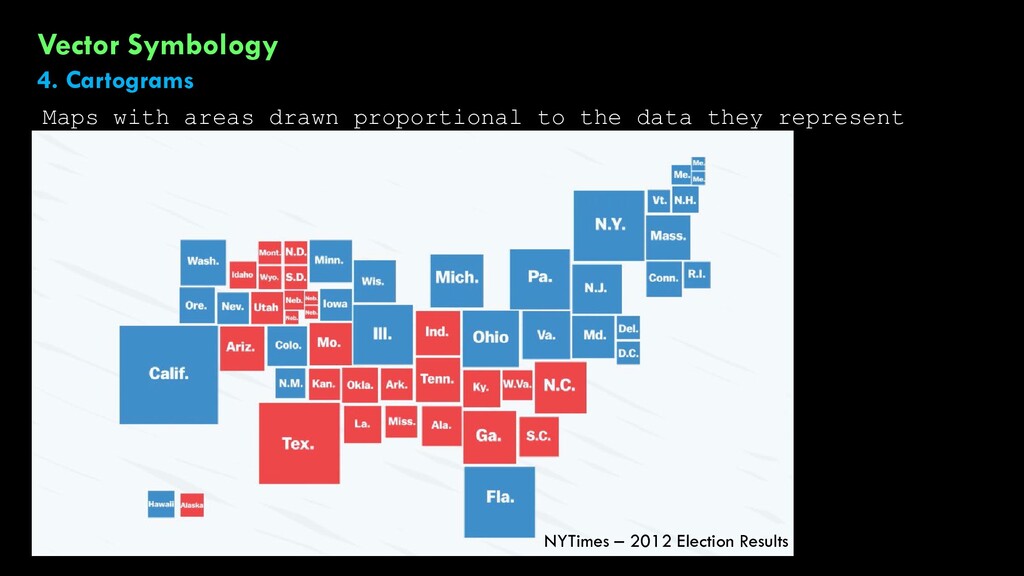
the data they represent NYTimes – 2012 Election Results Pros Cons - Give impression of being inaccurate - Logic of mapping is not well understood - Spatial locations are difficult to identify because of distortions - Shocks the reader with unexpected spatial peculiarities - No data lost through classification/simplification
gradually changing data Color Ramps for Continuous Data: CLASSIFIED You can choose (a) the number of bins, (b) bin boundaries, and (c) the color ramp to use!
gradually changing data Color Ramps for Continuous Data: STRETCHED There are many different ways of stretching the color ramp across your range of values! Here are three common ones: “Minimum-Maximum”: colors are evenly split between the low and high values FAITHFULLY DISPLAYS THE WHOLE RANGE HISTOGRAM STRETCHES
gradually changing data Color Ramps for Continuous Data: STRETCHED There are many different ways of stretching the color ramp across your range of values! Here are three common ones: “Minimum-Maximum”: colors are evenly split between the low and high values FAITHFULLY DISPLAYS THE WHOLE RANGE “Percent Clip”: highest 5% and lowest 5% of values are smushed into one color SUPRESSES OUTLIER VALUES HISTOGRAM STRETCHES
gradually changing data Color Ramps for Continuous Data: STRETCHED There are many different ways of stretching the color ramp across your range of values! Here are three common ones: “Minimum-Maximum”: colors are evenly split between the low and high values FAITHFULLY DISPLAYS THE WHOLE RANGE “Percent Clip”: highest 5% and lowest 5% of values are smushed into one color SUPRESSES OUTLIER VALUES “Histogram Equalize”: stretches out the most common values in the raster CREATES MORE CONTRAST IN THE DATA HISTOGRAM STRETCHES
WHEN ZOOMED IN Static (colors are the same no matter the scale) vs Dynamic Range Adjustment (whole range shown no matter the scale) But note that Arc doesn’t adjust the legend values!
![Raster Symbology 1. Continuous Data [example: elevation] Grid cells with](https://files.speakerdeck.com/presentations/2303b26efa9d4e77b8d1ad38b944b843/slide_24.jpg)
![Raster Symbology 1. Continuous Data [example: elevation] Grid cells with](https://files.speakerdeck.com/presentations/2303b26efa9d4e77b8d1ad38b944b843/slide_25.jpg)
![Raster Symbology 1. Continuous Data [example: elevation] Grid cells with](https://files.speakerdeck.com/presentations/2303b26efa9d4e77b8d1ad38b944b843/slide_26.jpg)
![Raster Symbology 1. Continuous Data [example: elevation] Grid cells with](https://files.speakerdeck.com/presentations/2303b26efa9d4e77b8d1ad38b944b843/slide_27.jpg)
![Raster Symbology 1. Continuous Data [example: elevation] Grid cells with](https://files.speakerdeck.com/presentations/2303b26efa9d4e77b8d1ad38b944b843/slide_28.jpg)
![Raster Symbology 1. Continuous Data [example: elevation] Grid cells with](https://files.speakerdeck.com/presentations/2303b26efa9d4e77b8d1ad38b944b843/slide_29.jpg)
![Raster Symbology 1. Continuous Data [example: elevation] Grid cells with](https://files.speakerdeck.com/presentations/2303b26efa9d4e77b8d1ad38b944b843/slide_30.jpg)
![Raster Symbology 1. Continuous Data [example: elevation] Grid cells with](https://files.speakerdeck.com/presentations/2303b26efa9d4e77b8d1ad38b944b843/slide_31.jpg)
![Raster Symbology 1. Continuous Data [example: elevation] Grid cells with](https://files.speakerdeck.com/presentations/2303b26efa9d4e77b8d1ad38b944b843/slide_32.jpg)
![Raster Symbology 1. Continuous Data [example: elevation] CREATING MORE CONTRAST](https://files.speakerdeck.com/presentations/2303b26efa9d4e77b8d1ad38b944b843/slide_33.jpg)
![Raster Symbology 1. Continuous Data [example: elevation] CREATING MORE CONTRAST](https://files.speakerdeck.com/presentations/2303b26efa9d4e77b8d1ad38b944b843/slide_34.jpg)
![Raster Symbology 1. Continuous Data [example: elevation] CREATING MORE CONTRAST](https://files.speakerdeck.com/presentations/2303b26efa9d4e77b8d1ad38b944b843/slide_35.jpg)
![Raster Symbology 2. Discrete Data [example: land cover] Grid cells](https://files.speakerdeck.com/presentations/2303b26efa9d4e77b8d1ad38b944b843/slide_36.jpg)
![Raster Symbology 2. Discrete Data [example: land cover] Grid cells](https://files.speakerdeck.com/presentations/2303b26efa9d4e77b8d1ad38b944b843/slide_37.jpg)
![Raster Symbology 2. Discrete Data [example: land cover] Grid cells](https://files.speakerdeck.com/presentations/2303b26efa9d4e77b8d1ad38b944b843/slide_38.jpg)