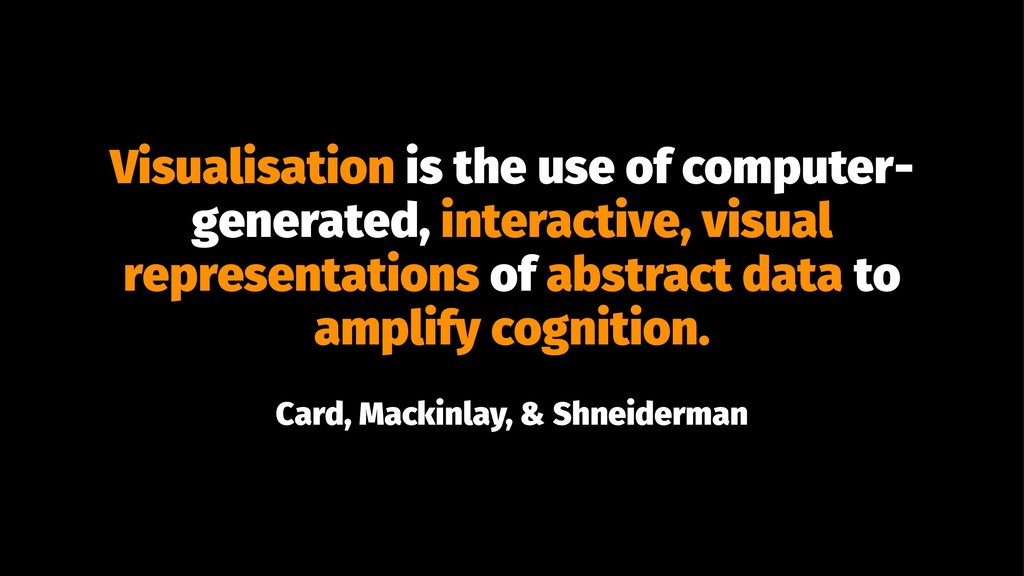
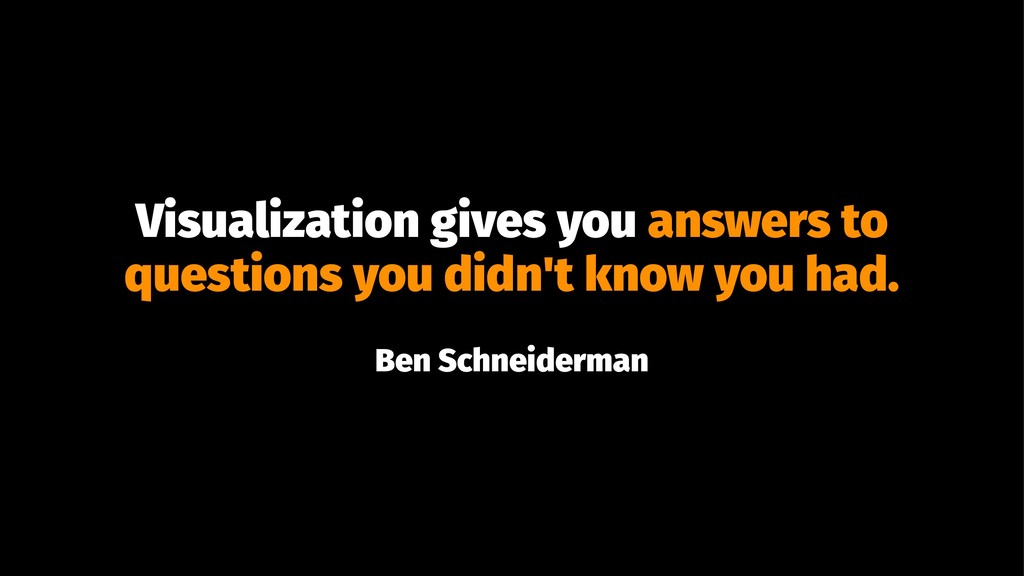
Visual data stories can enable us to move from analysis to synthesis, from numbers to visuals, and from an argument to a story. In this talk I talk about the purpose of data visualisation, the principles of storytelling and how we can combine the two together to craft visual stories with data.