Upgrade to Pro — share decks privately, control downloads, hide ads and more …

VESPA: Visual Event-Stream Progressive Analytics

VESPA: Visual Event-Stream Progressive Analytics

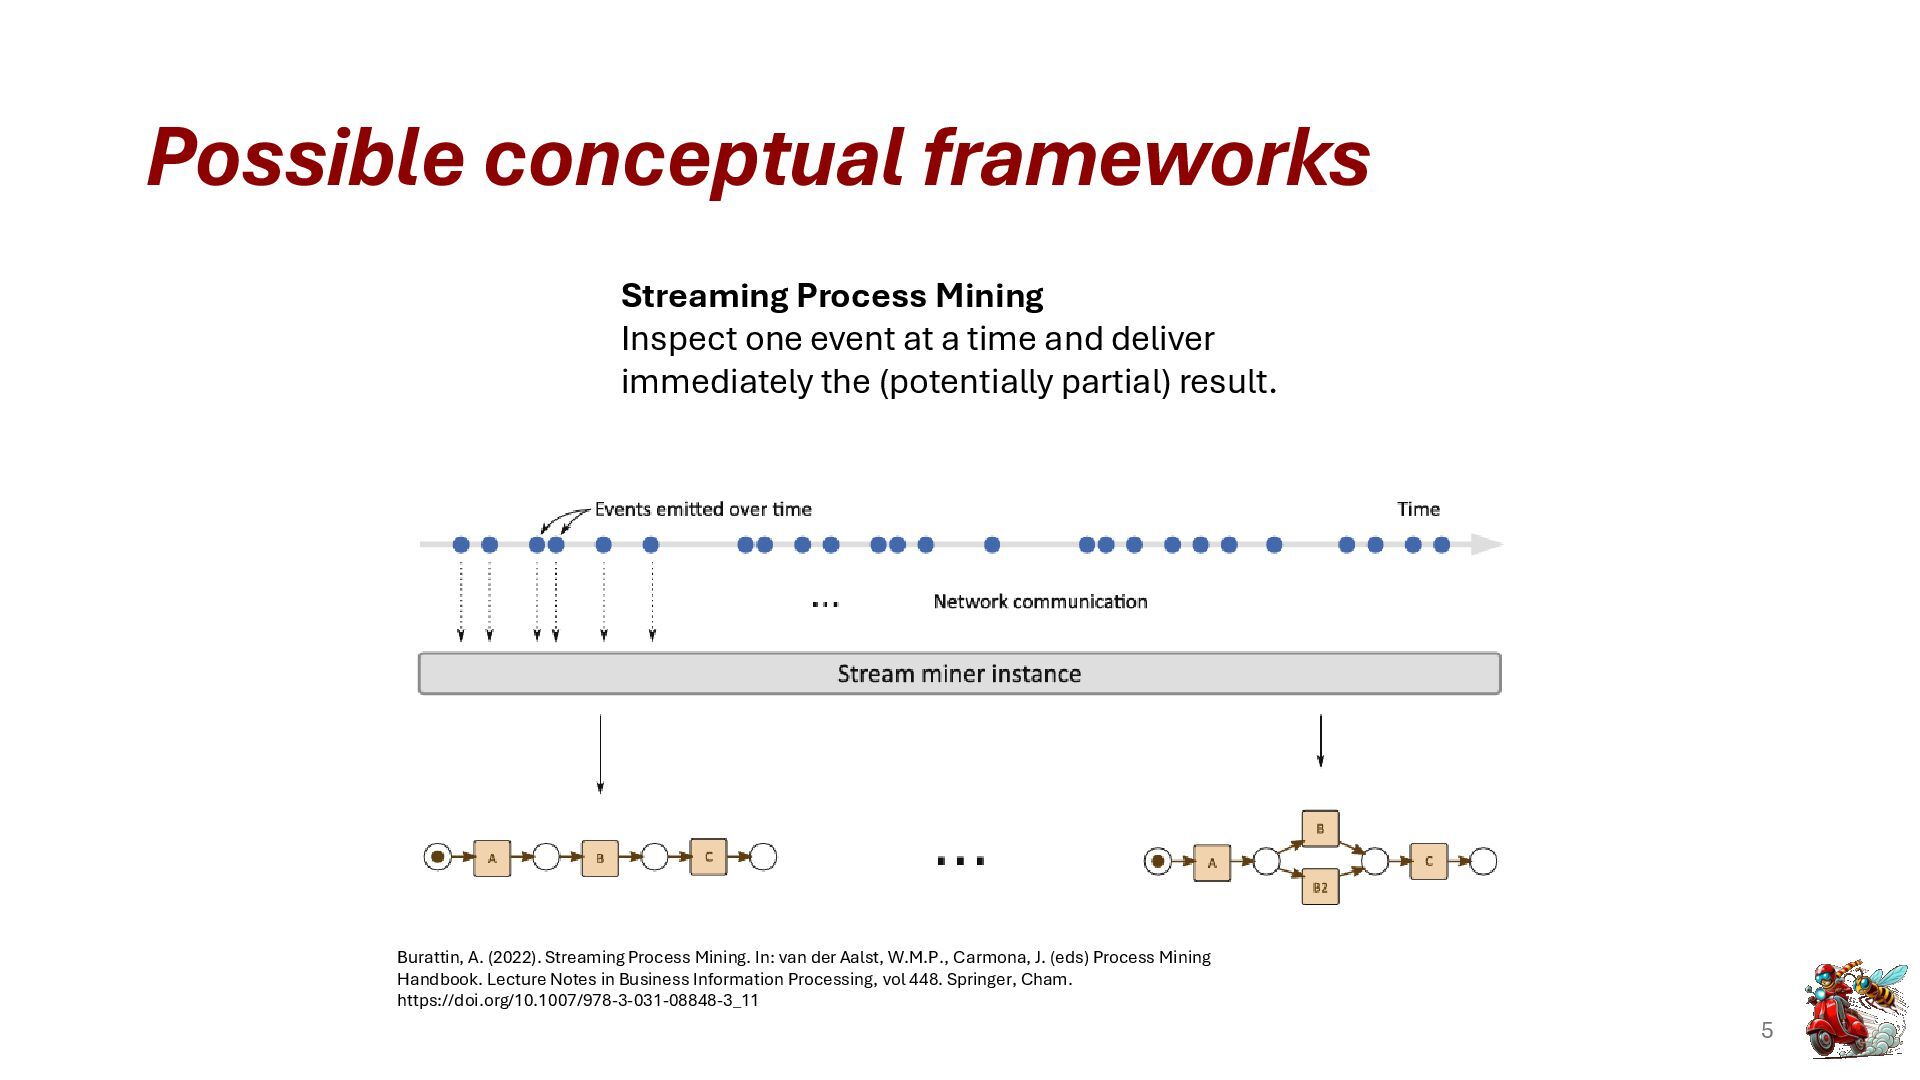
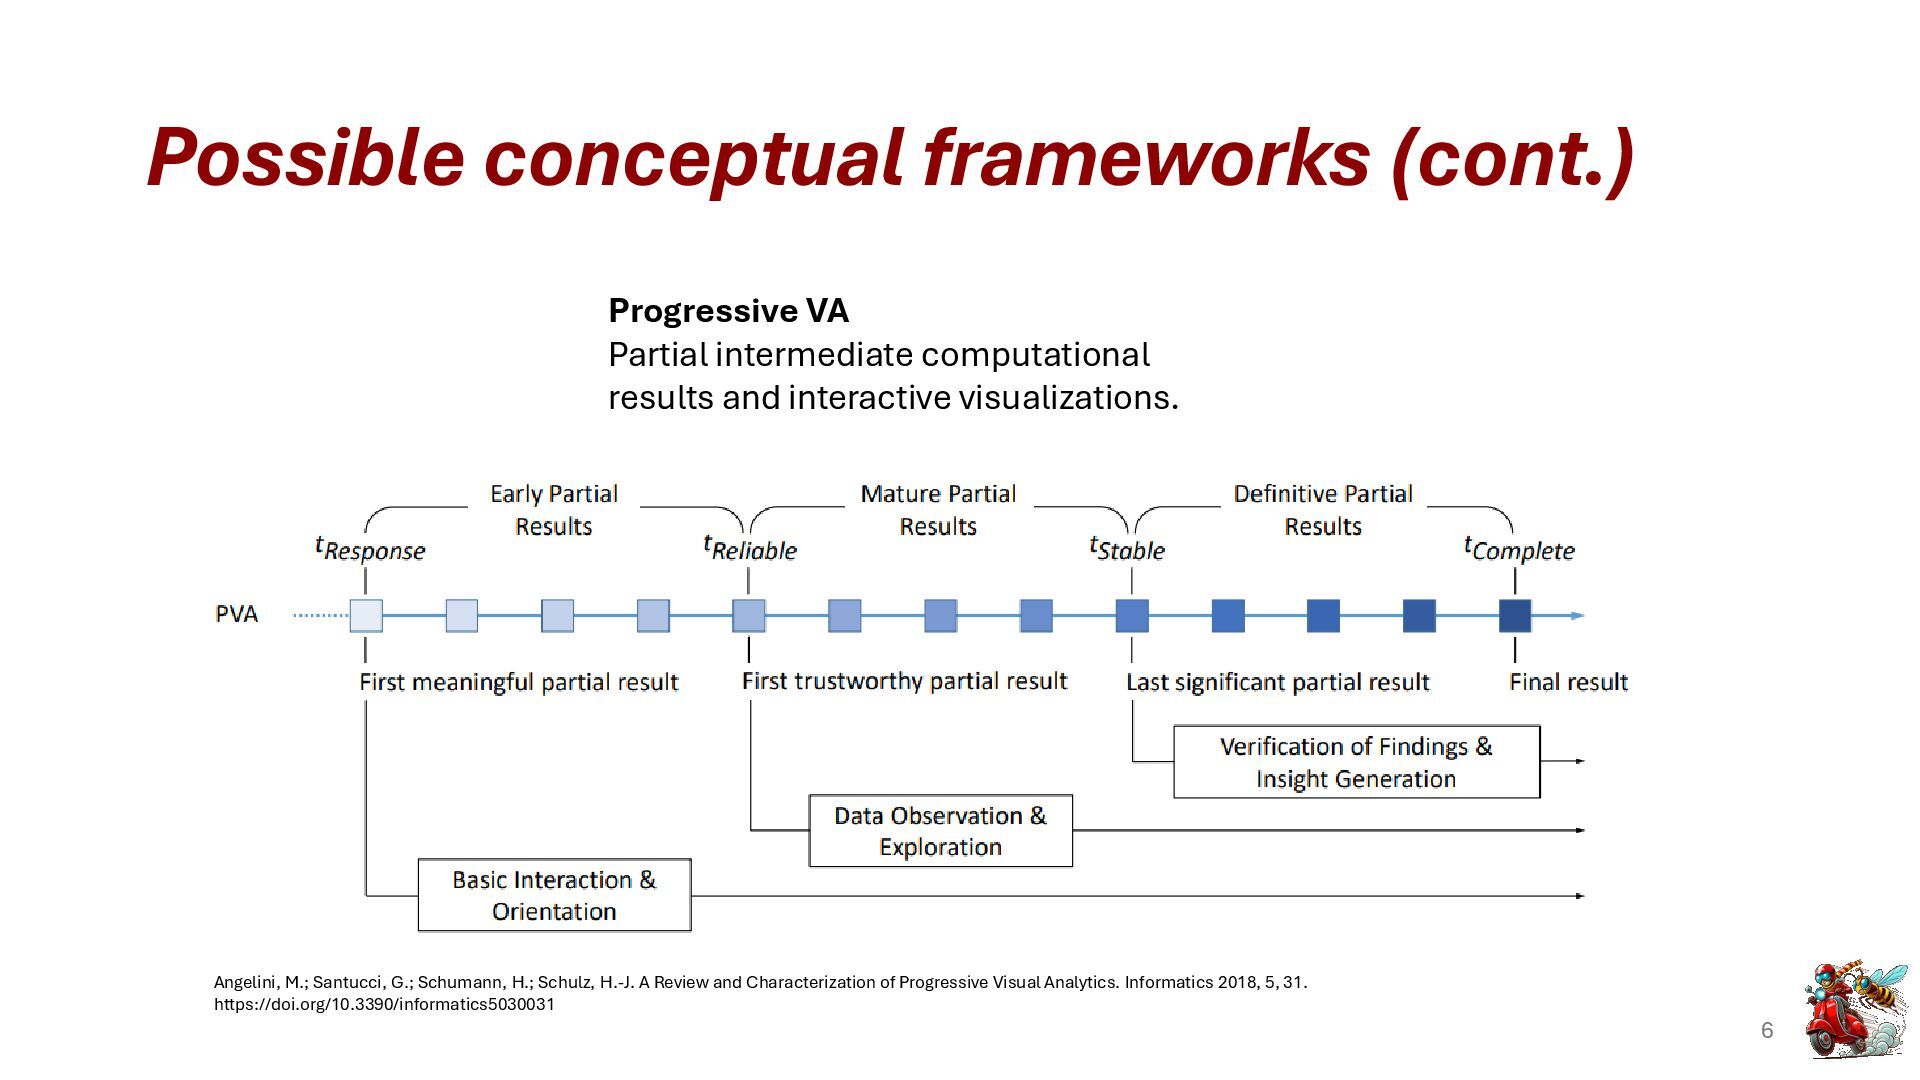
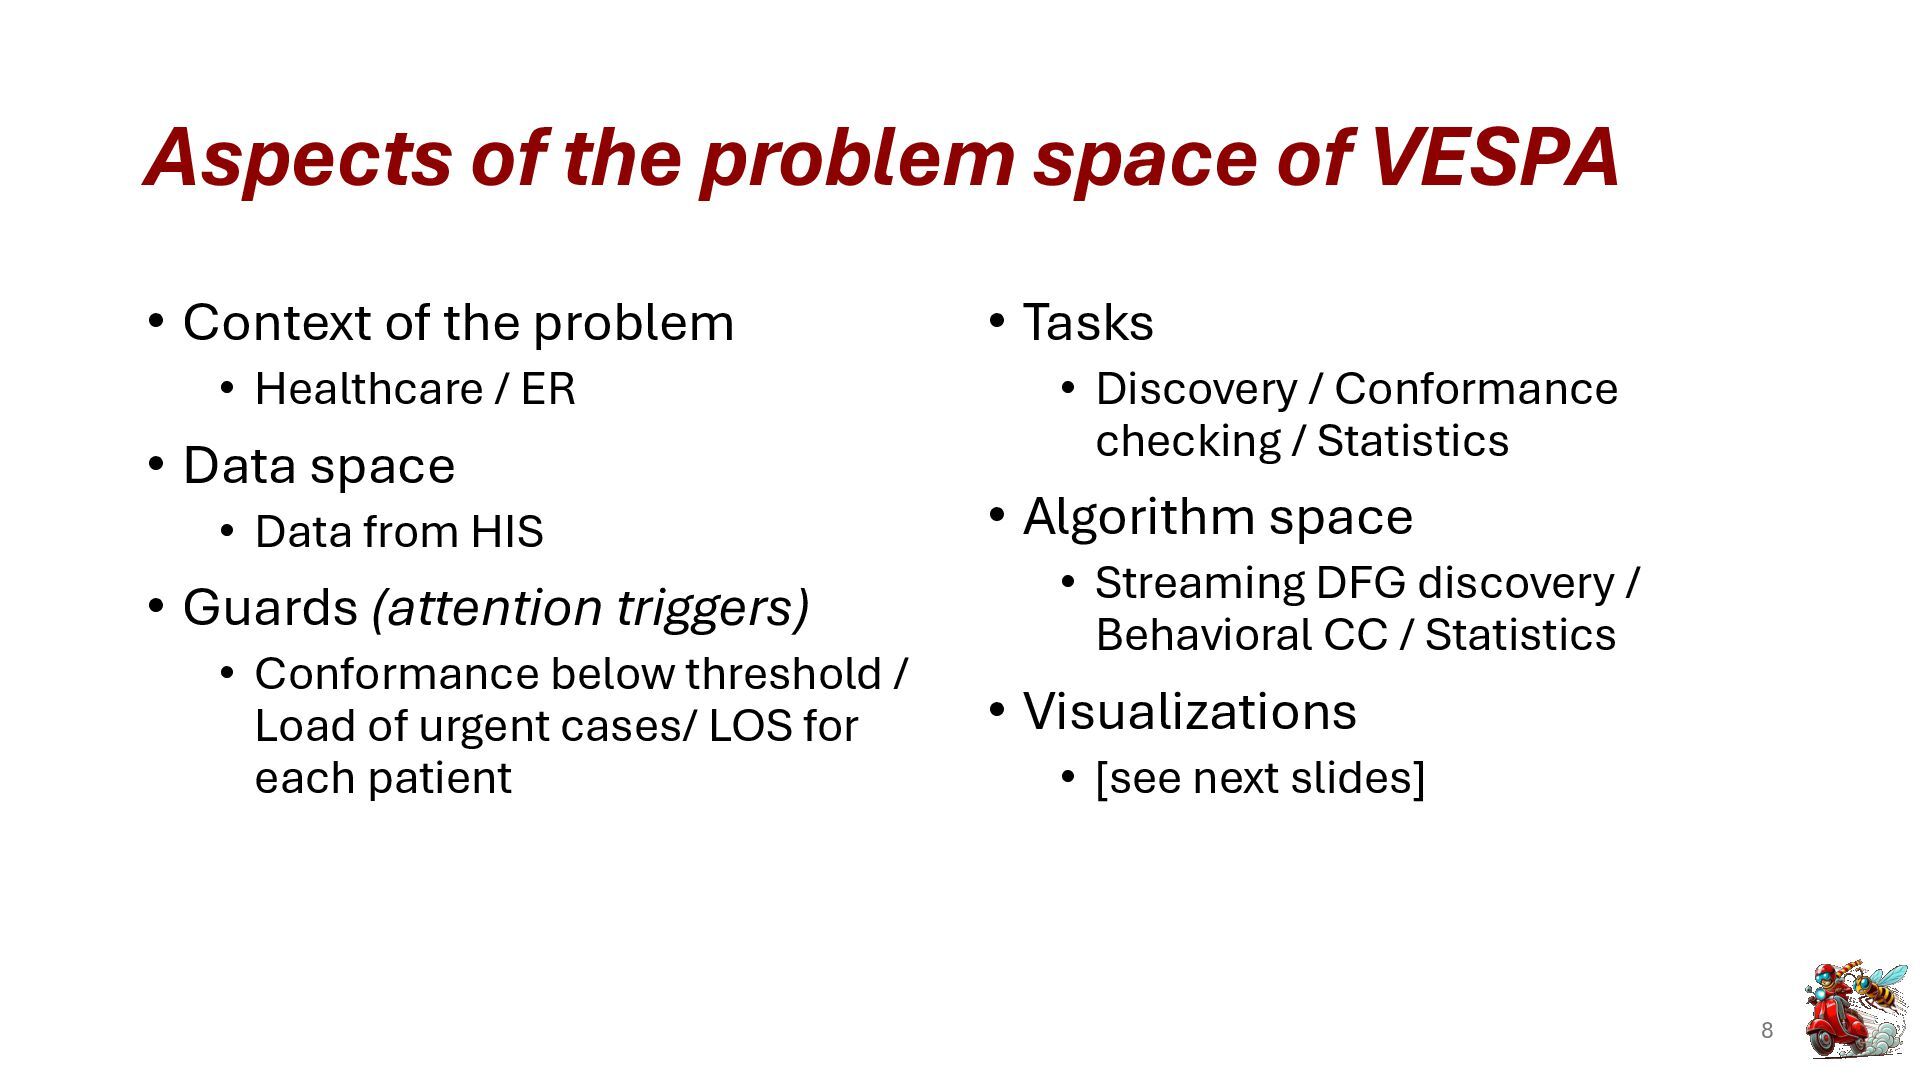
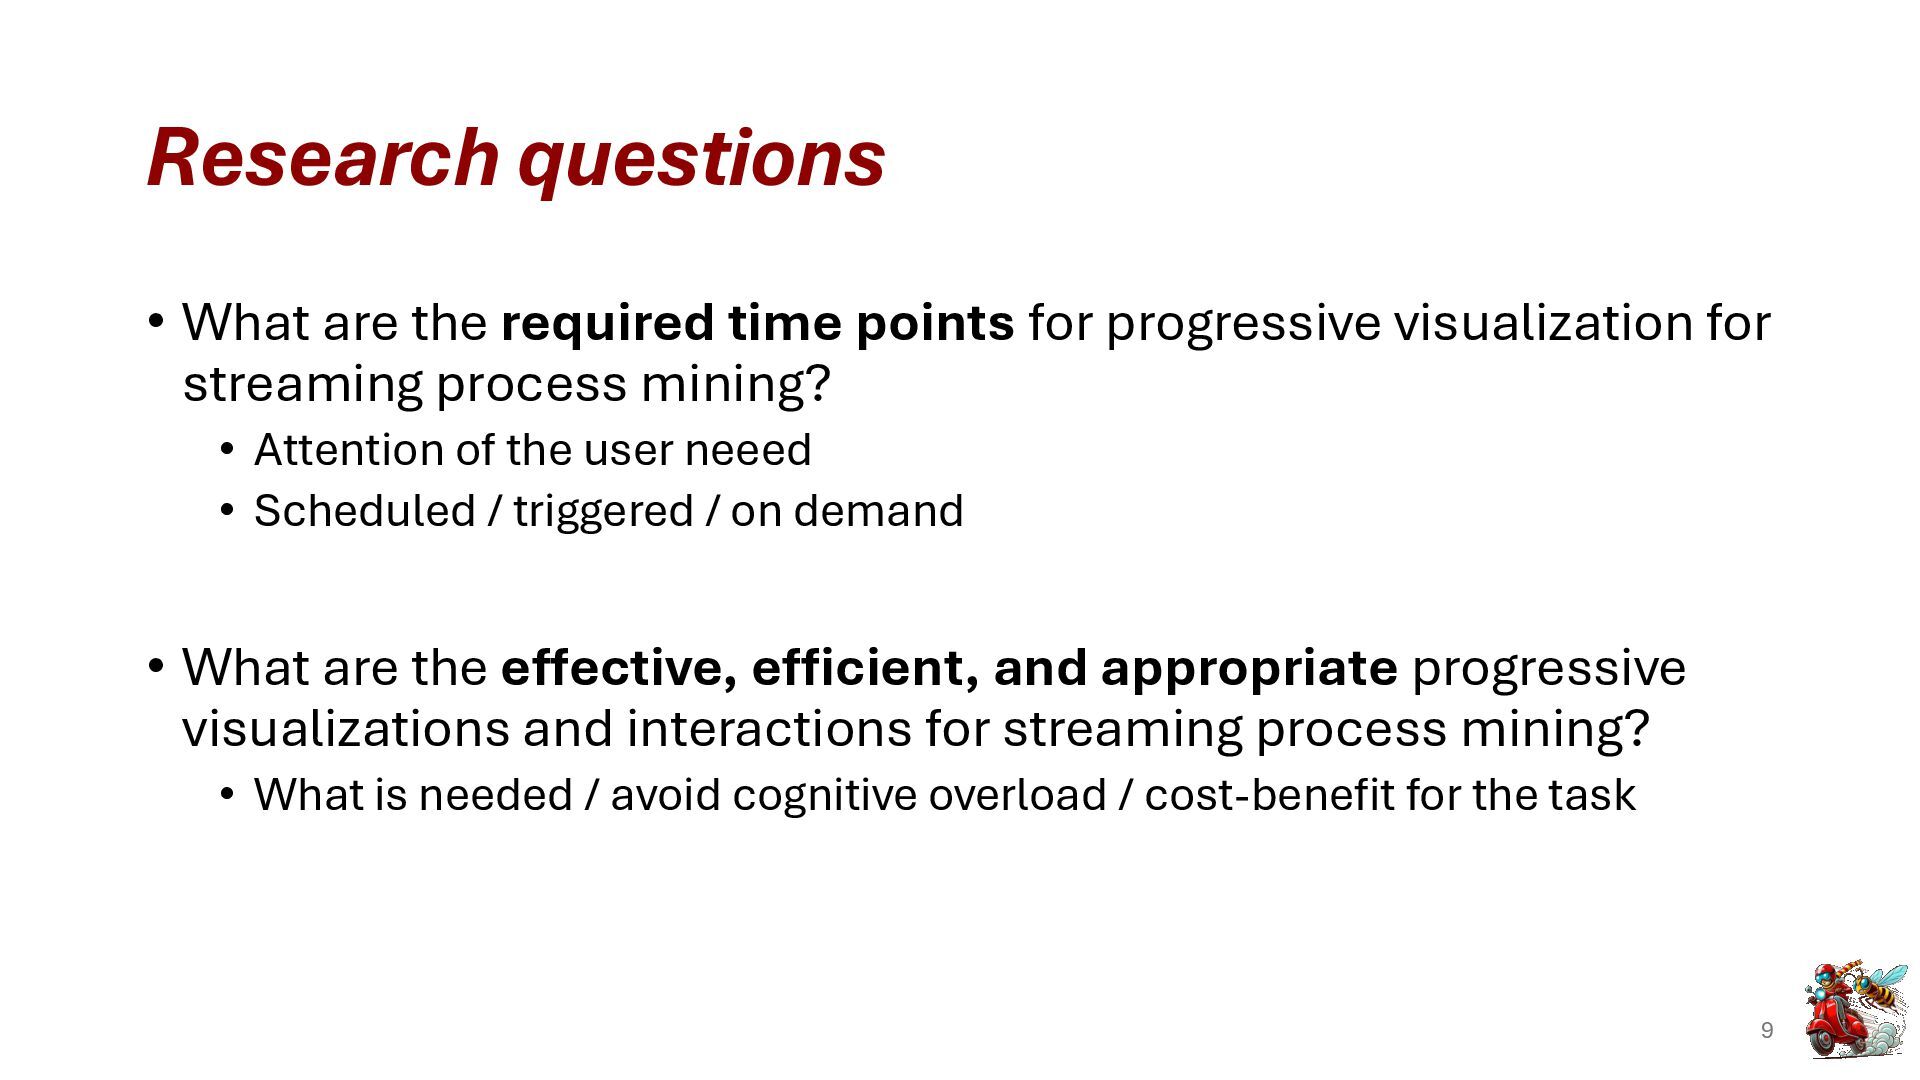
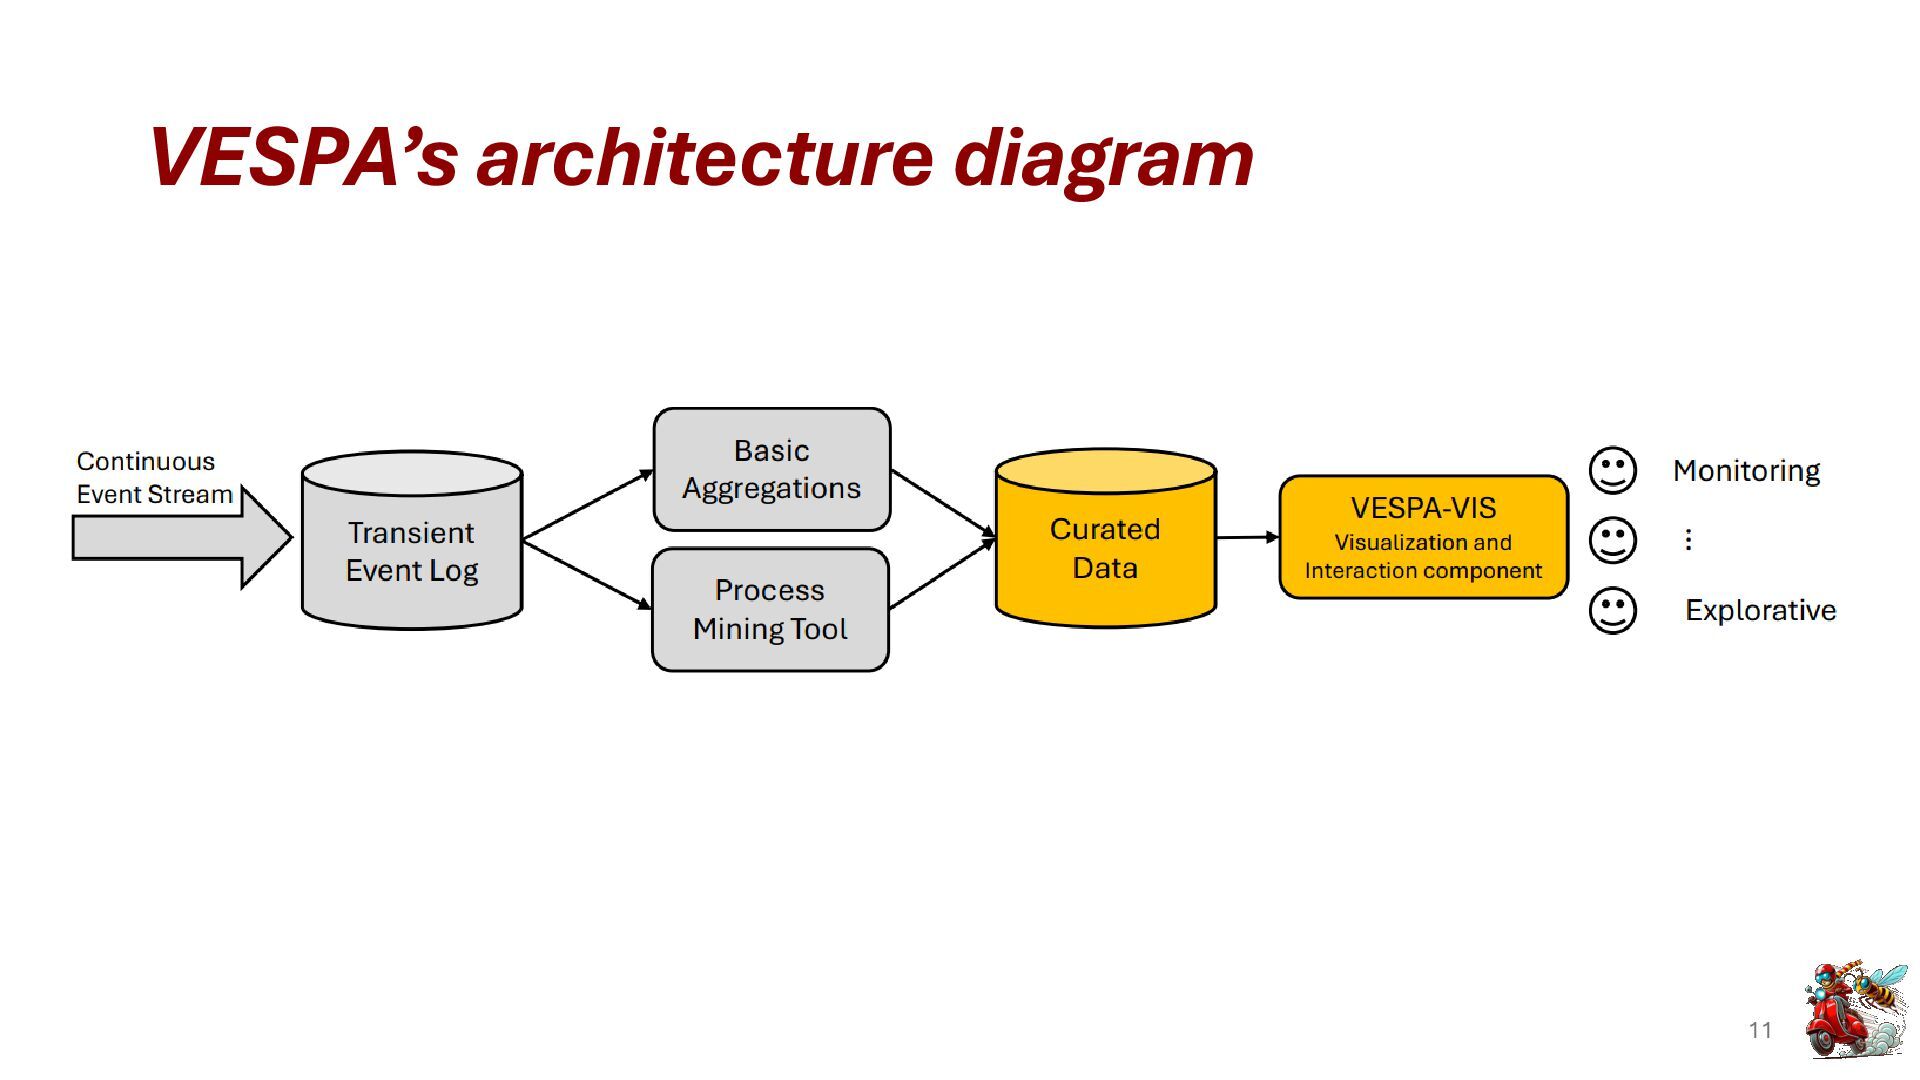
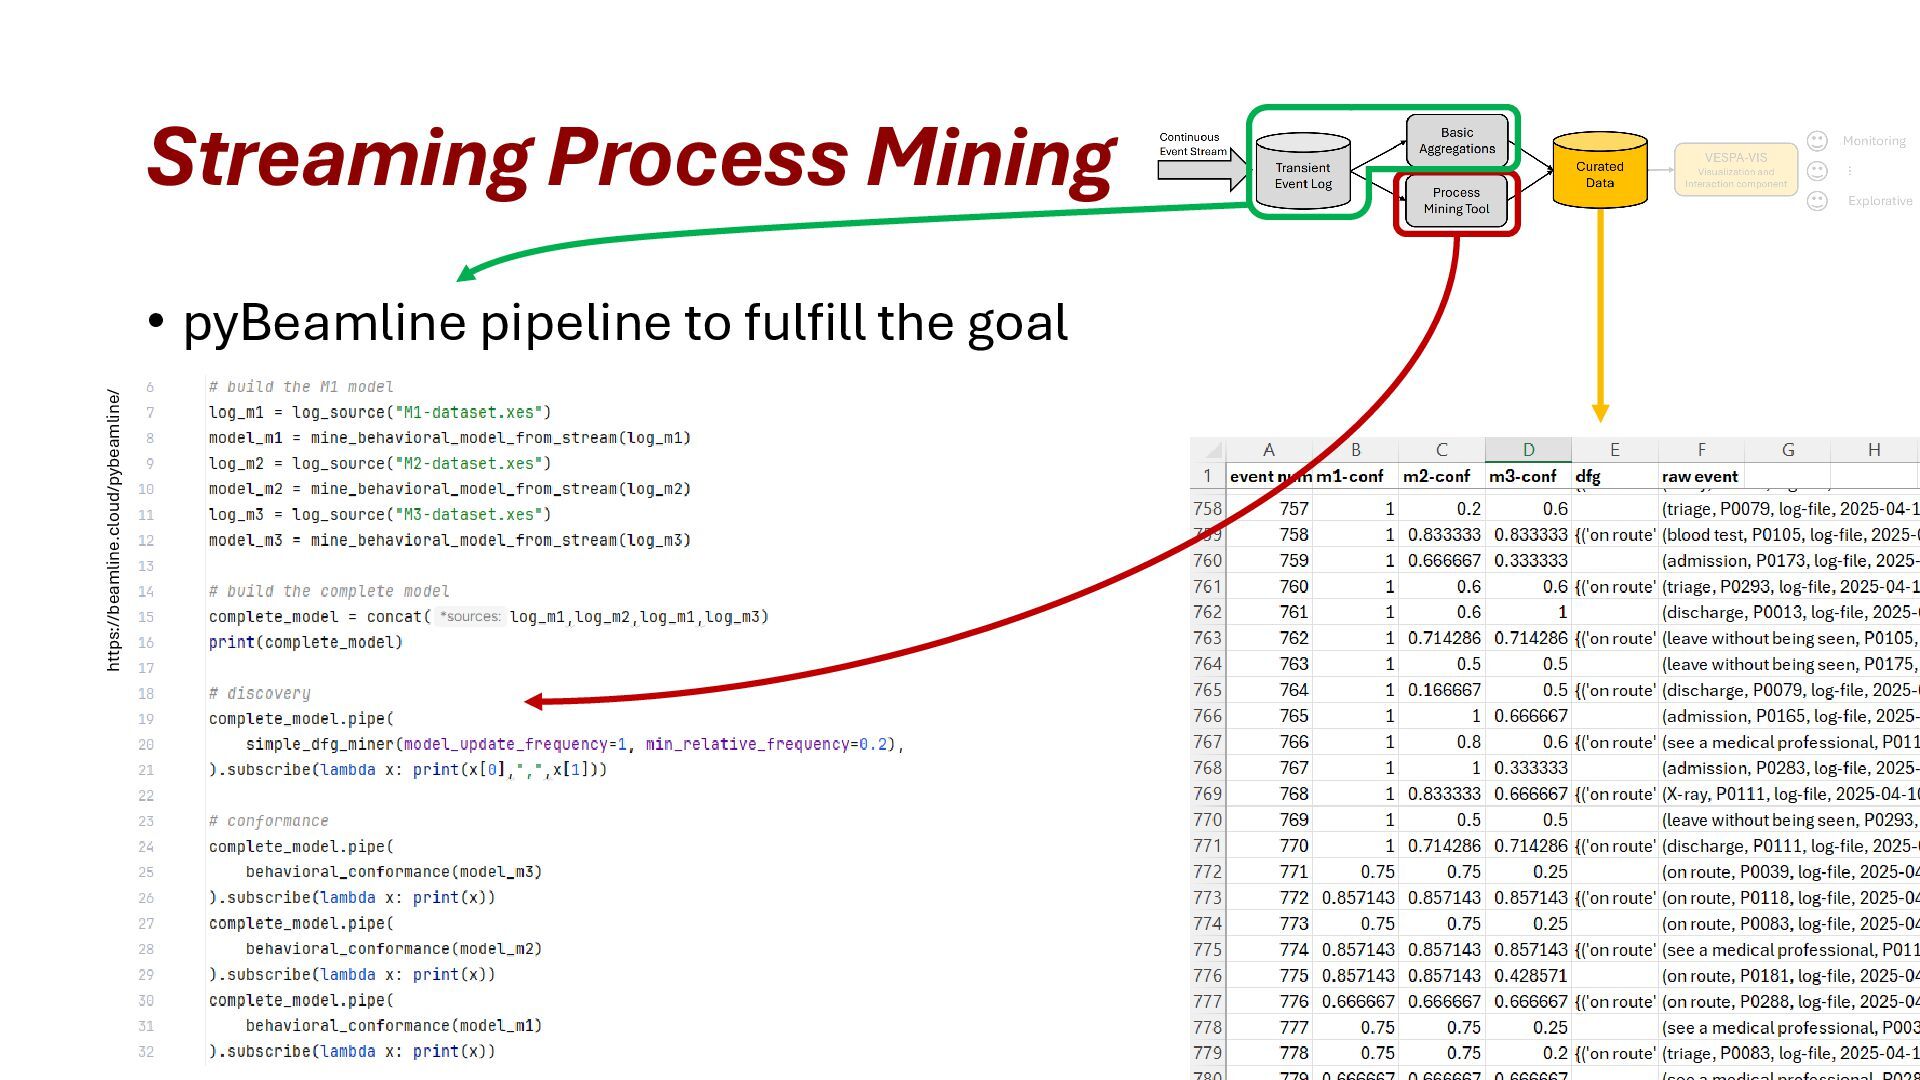
This paper introduces VESPA (Visual Event-Stream Progressive Analytics), a framework that integrates Streaming Process Mining (SPM) with Progressive Visual Analytics (PVA) to support timely, informed decisions using partial, evolving data. VESPA addresses the challenges of analyzing transient, multifaceted event-streams by coupling process mining with progressive visualizations. Our framework is structured around key dimensions (context, task, data, algorithm, user roles, and interaction modalities). Two central research questions guide our work: identifying optimal timing for progressive visualizations and determining their effectiveness and appropriateness in streaming contexts.
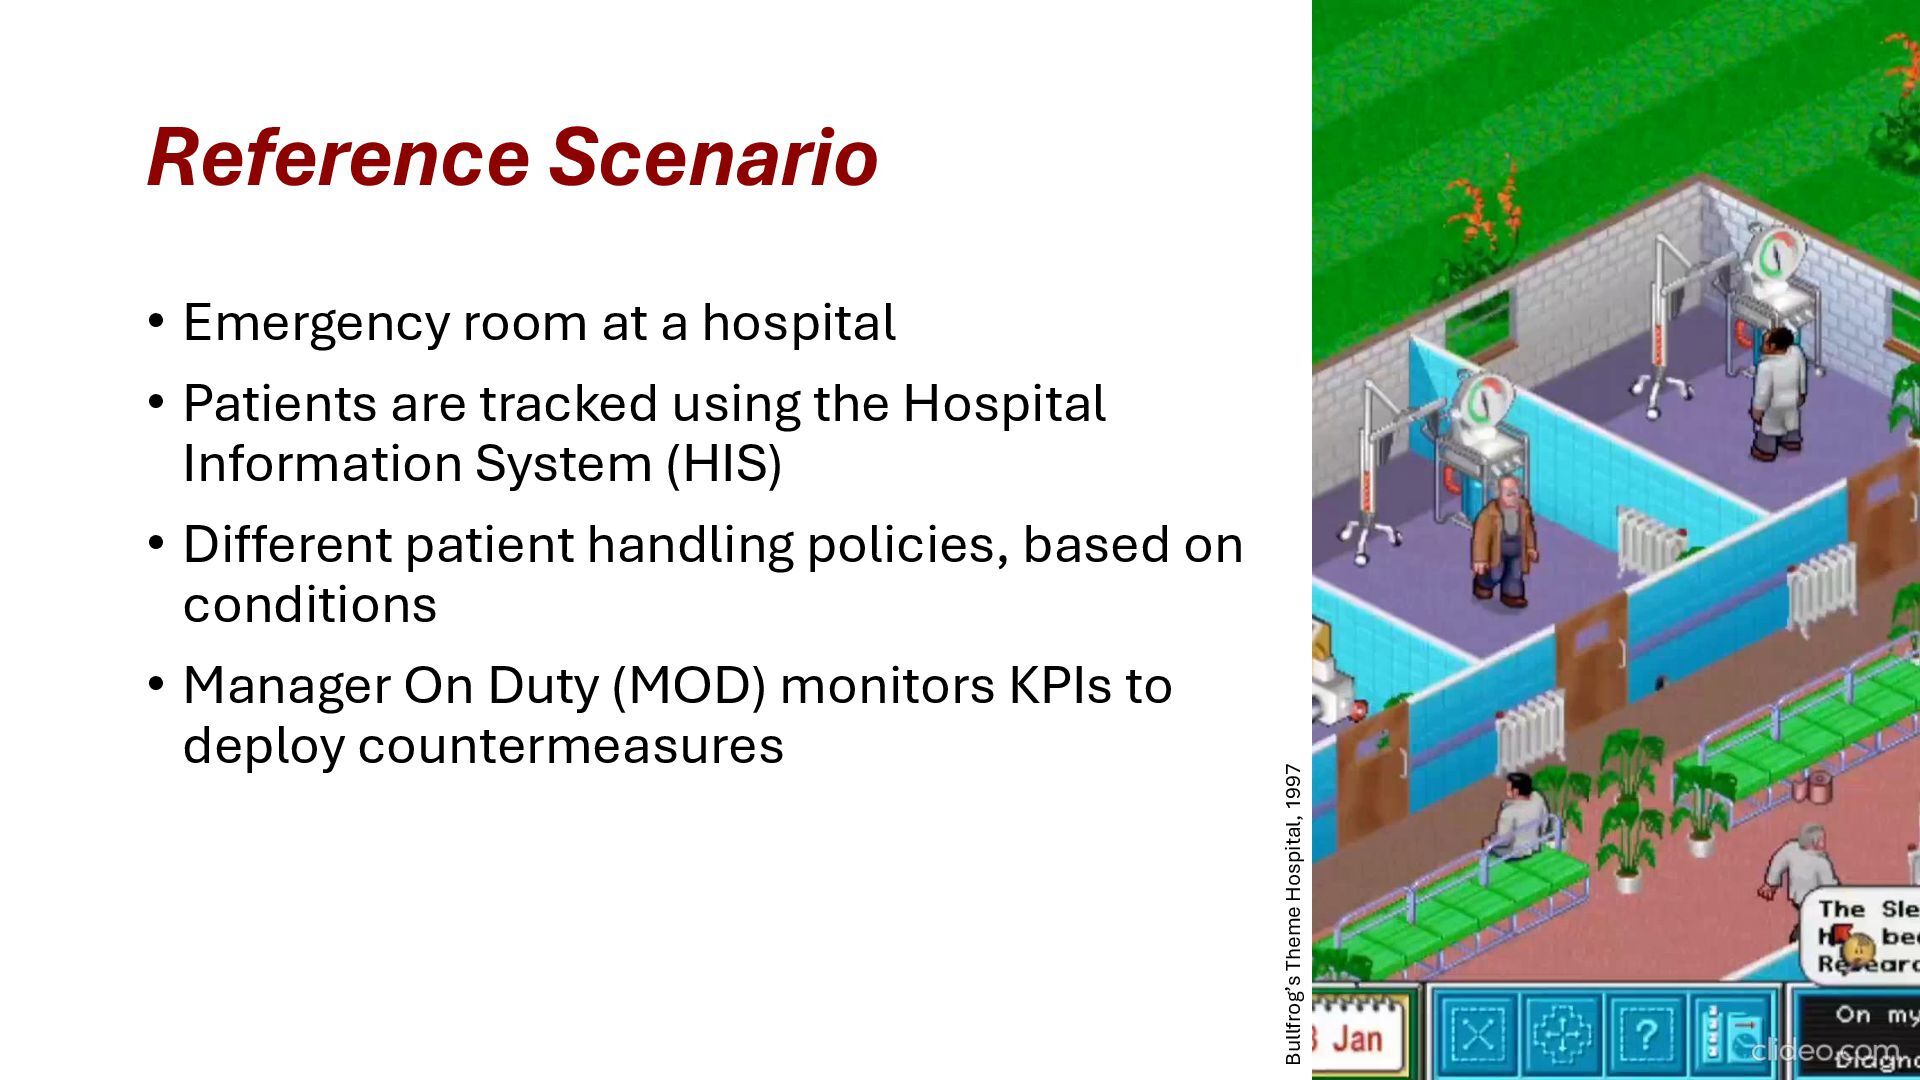
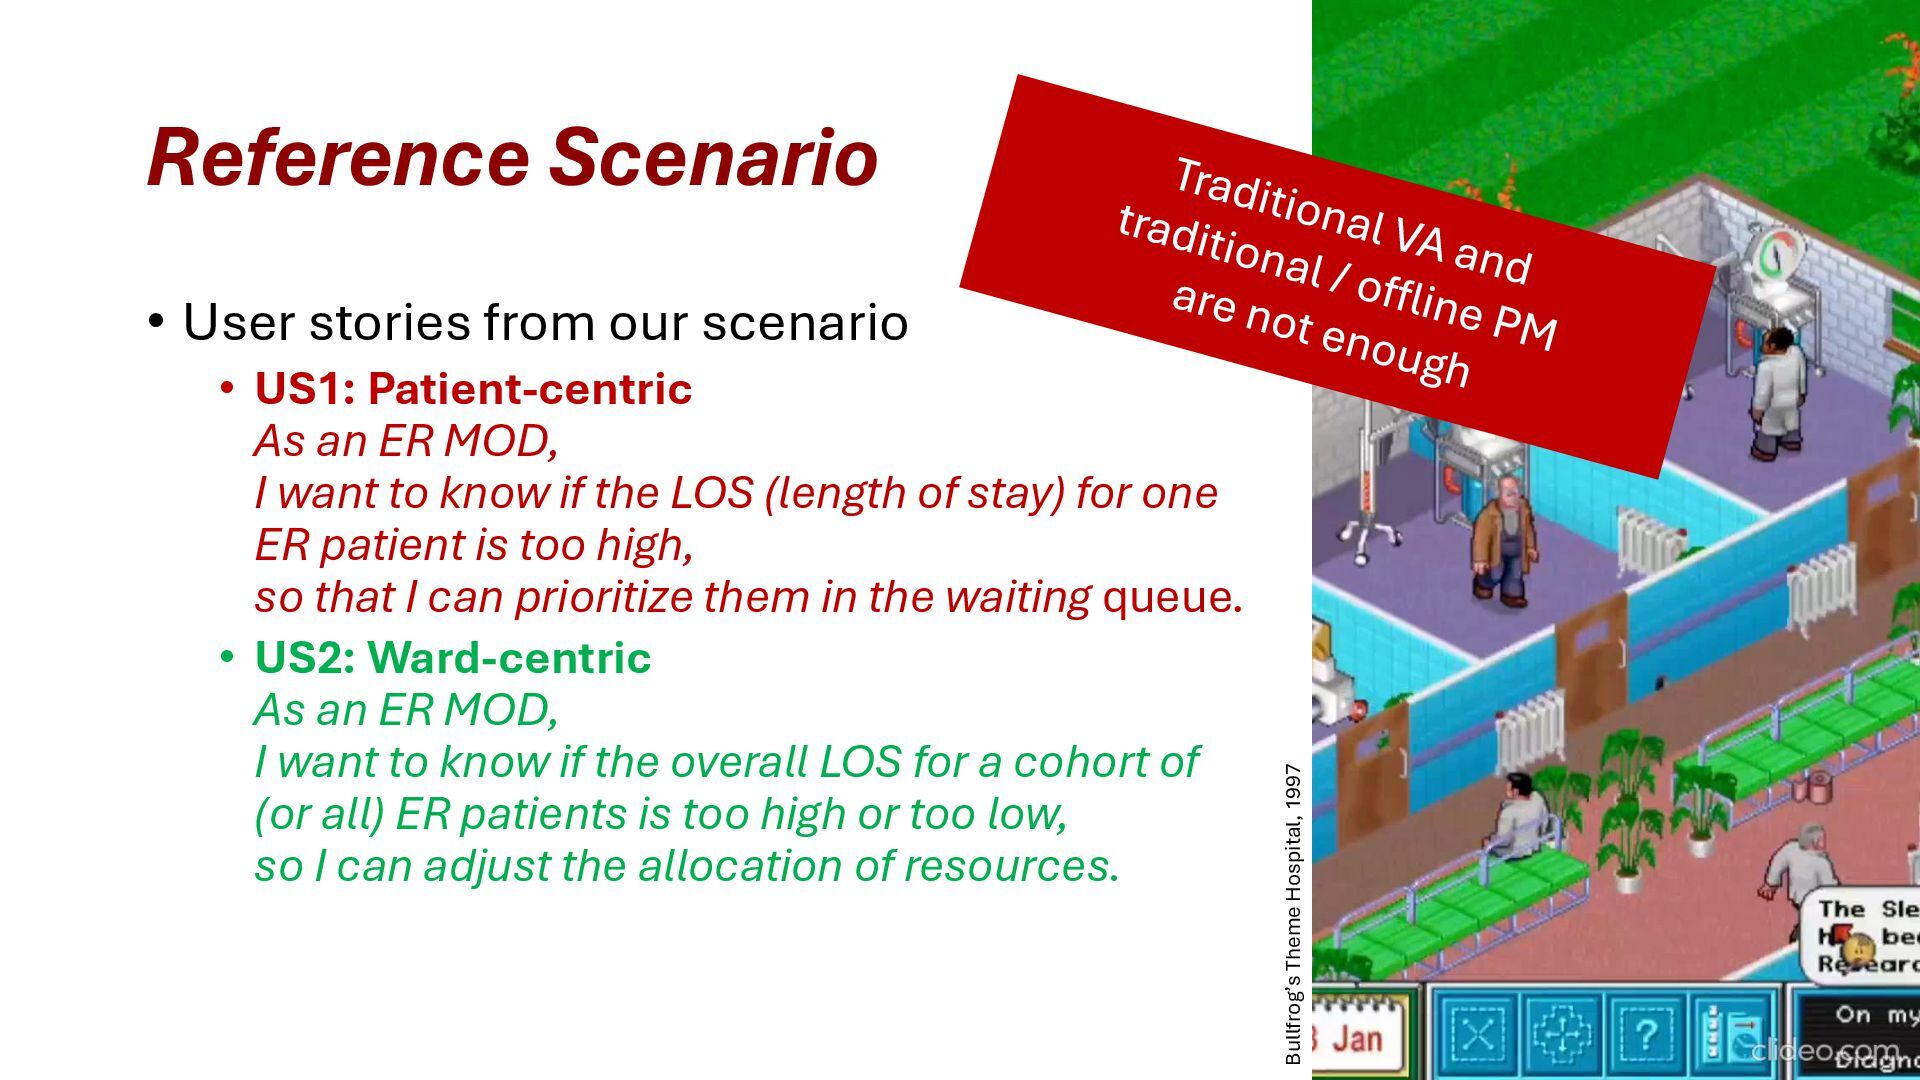
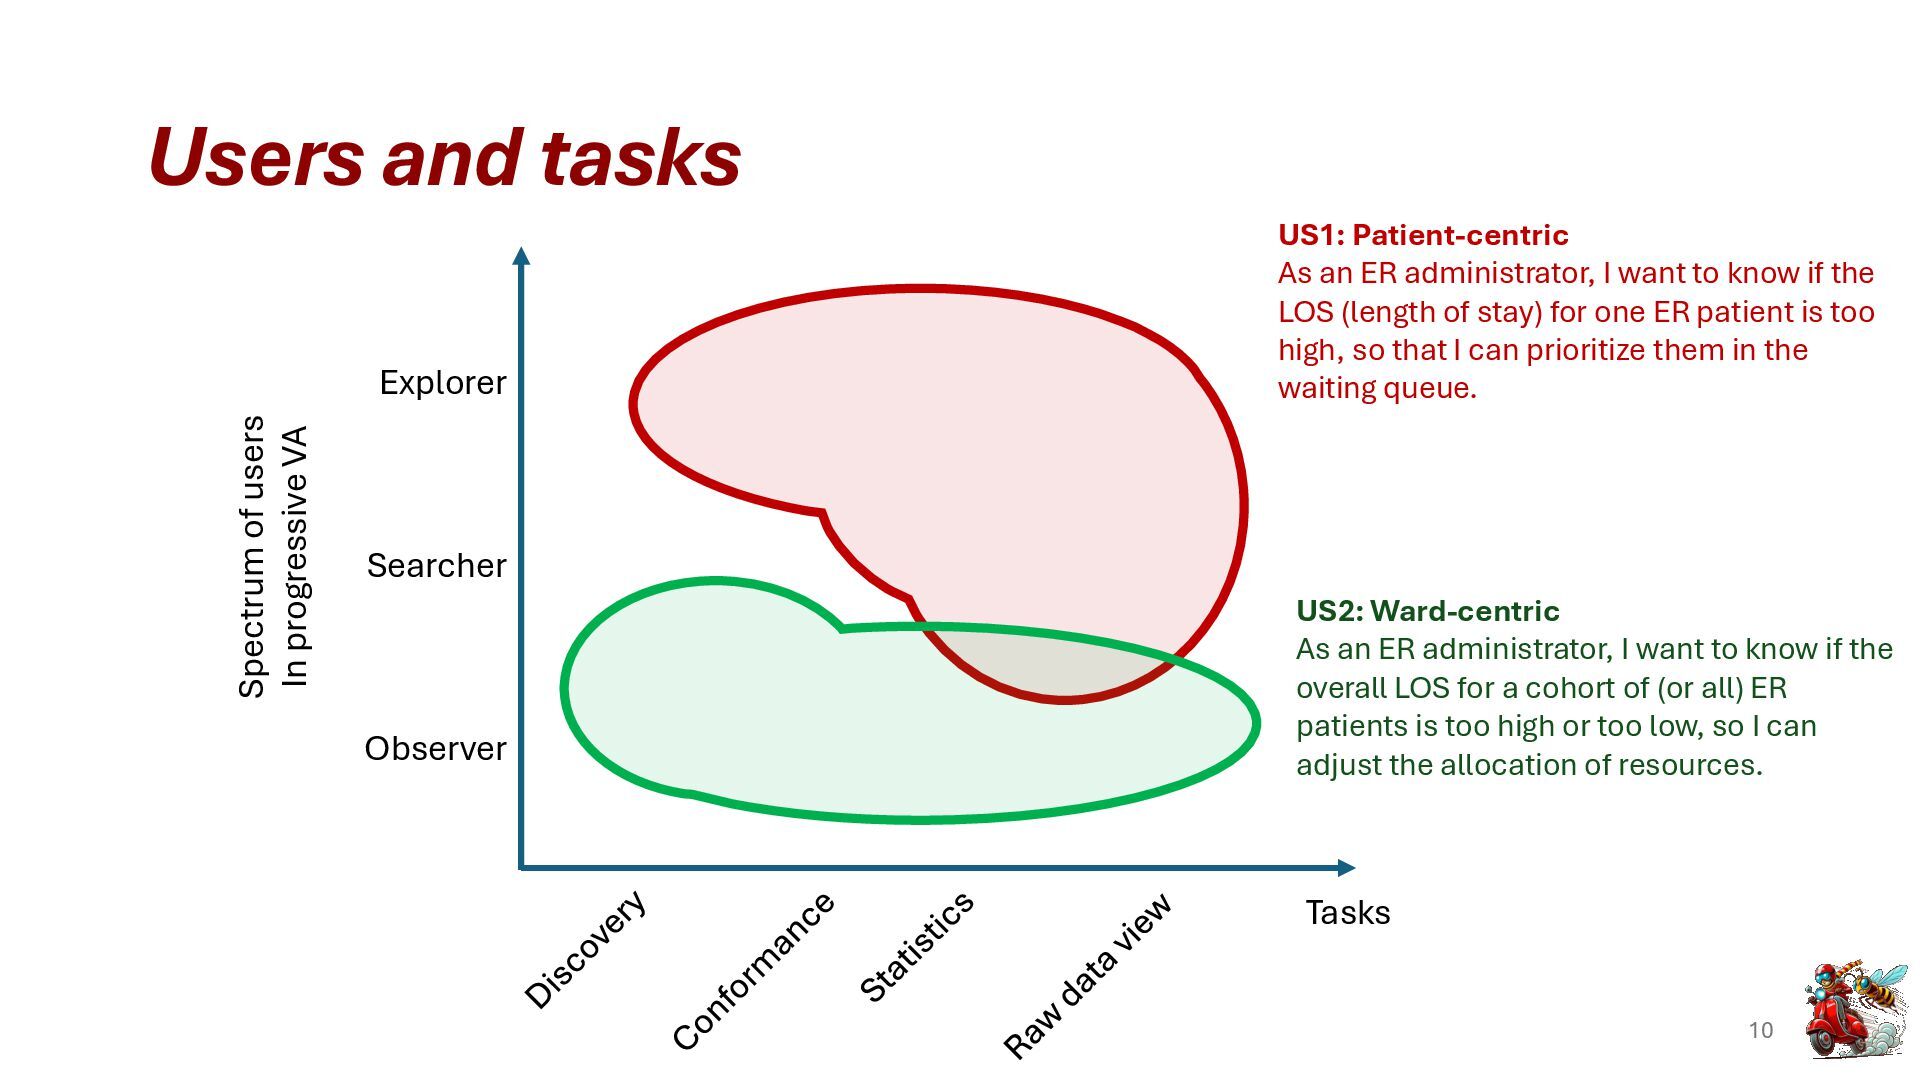
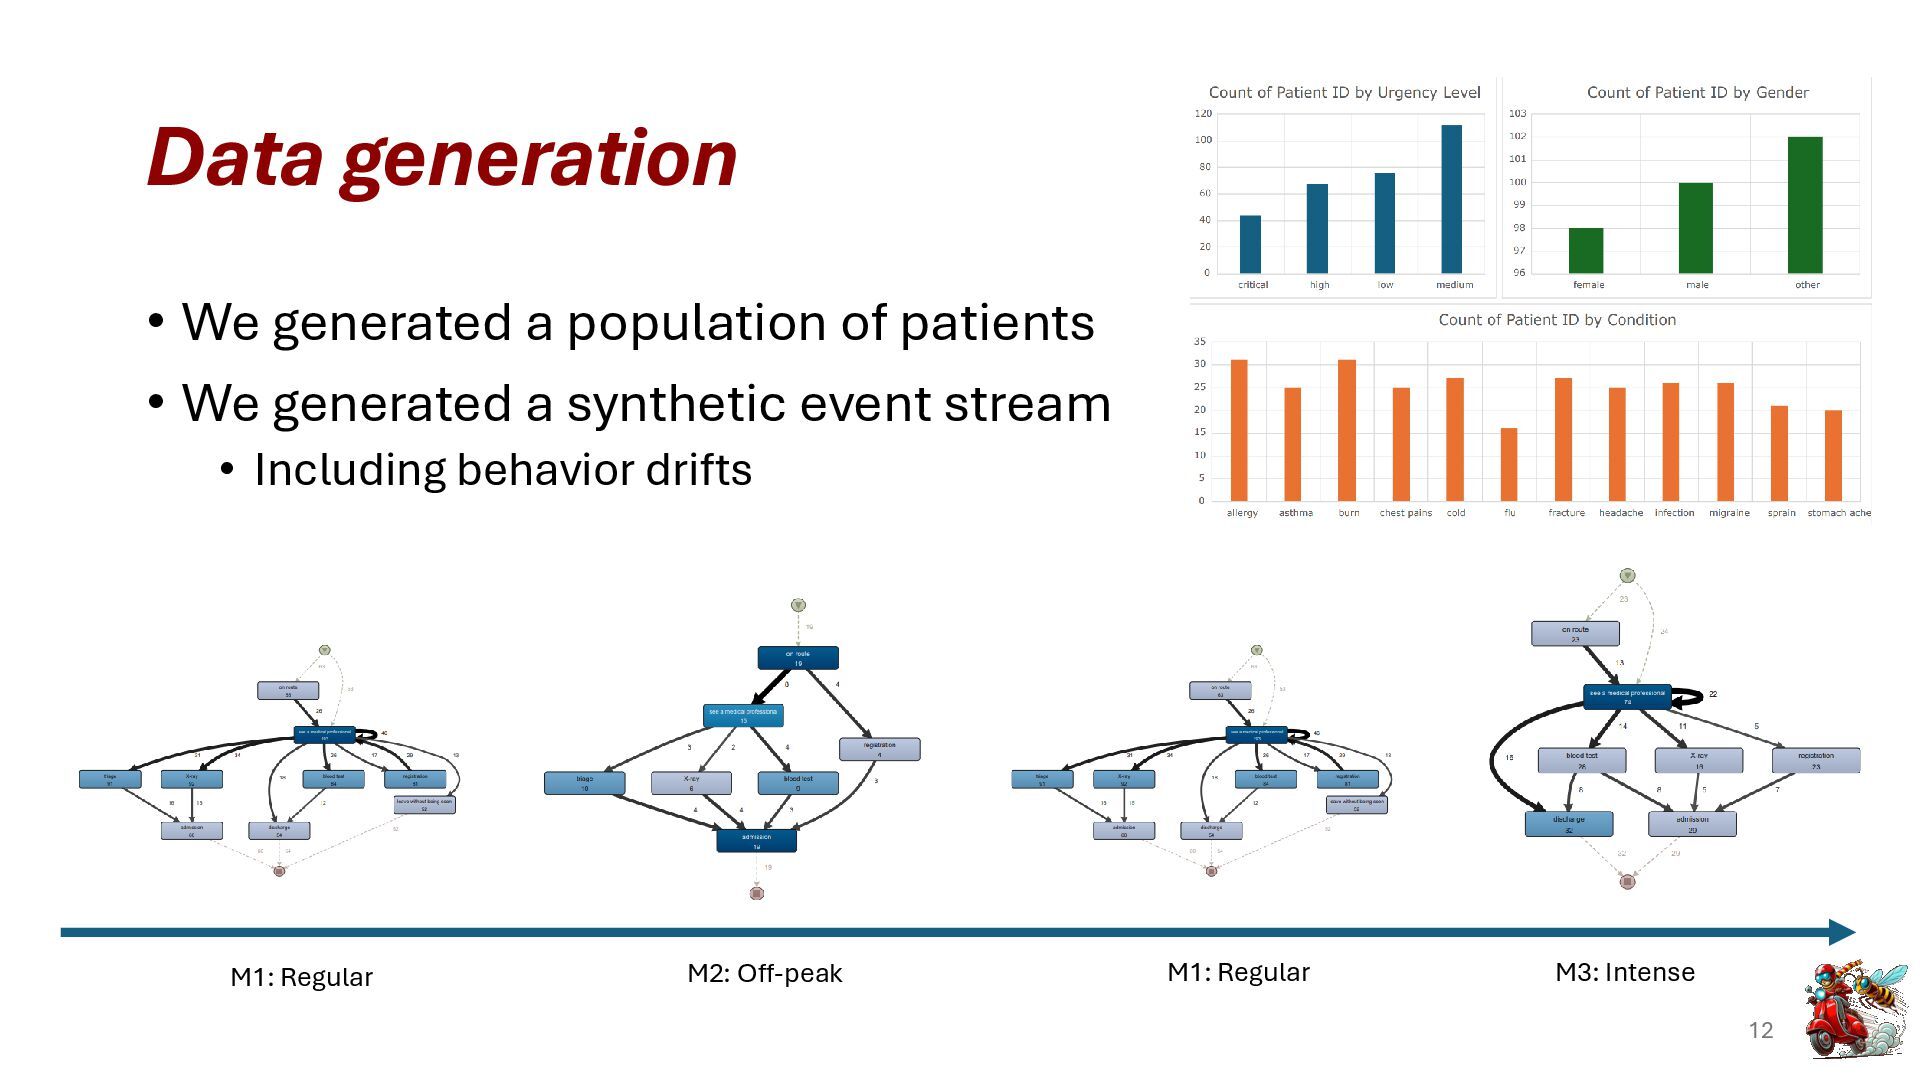
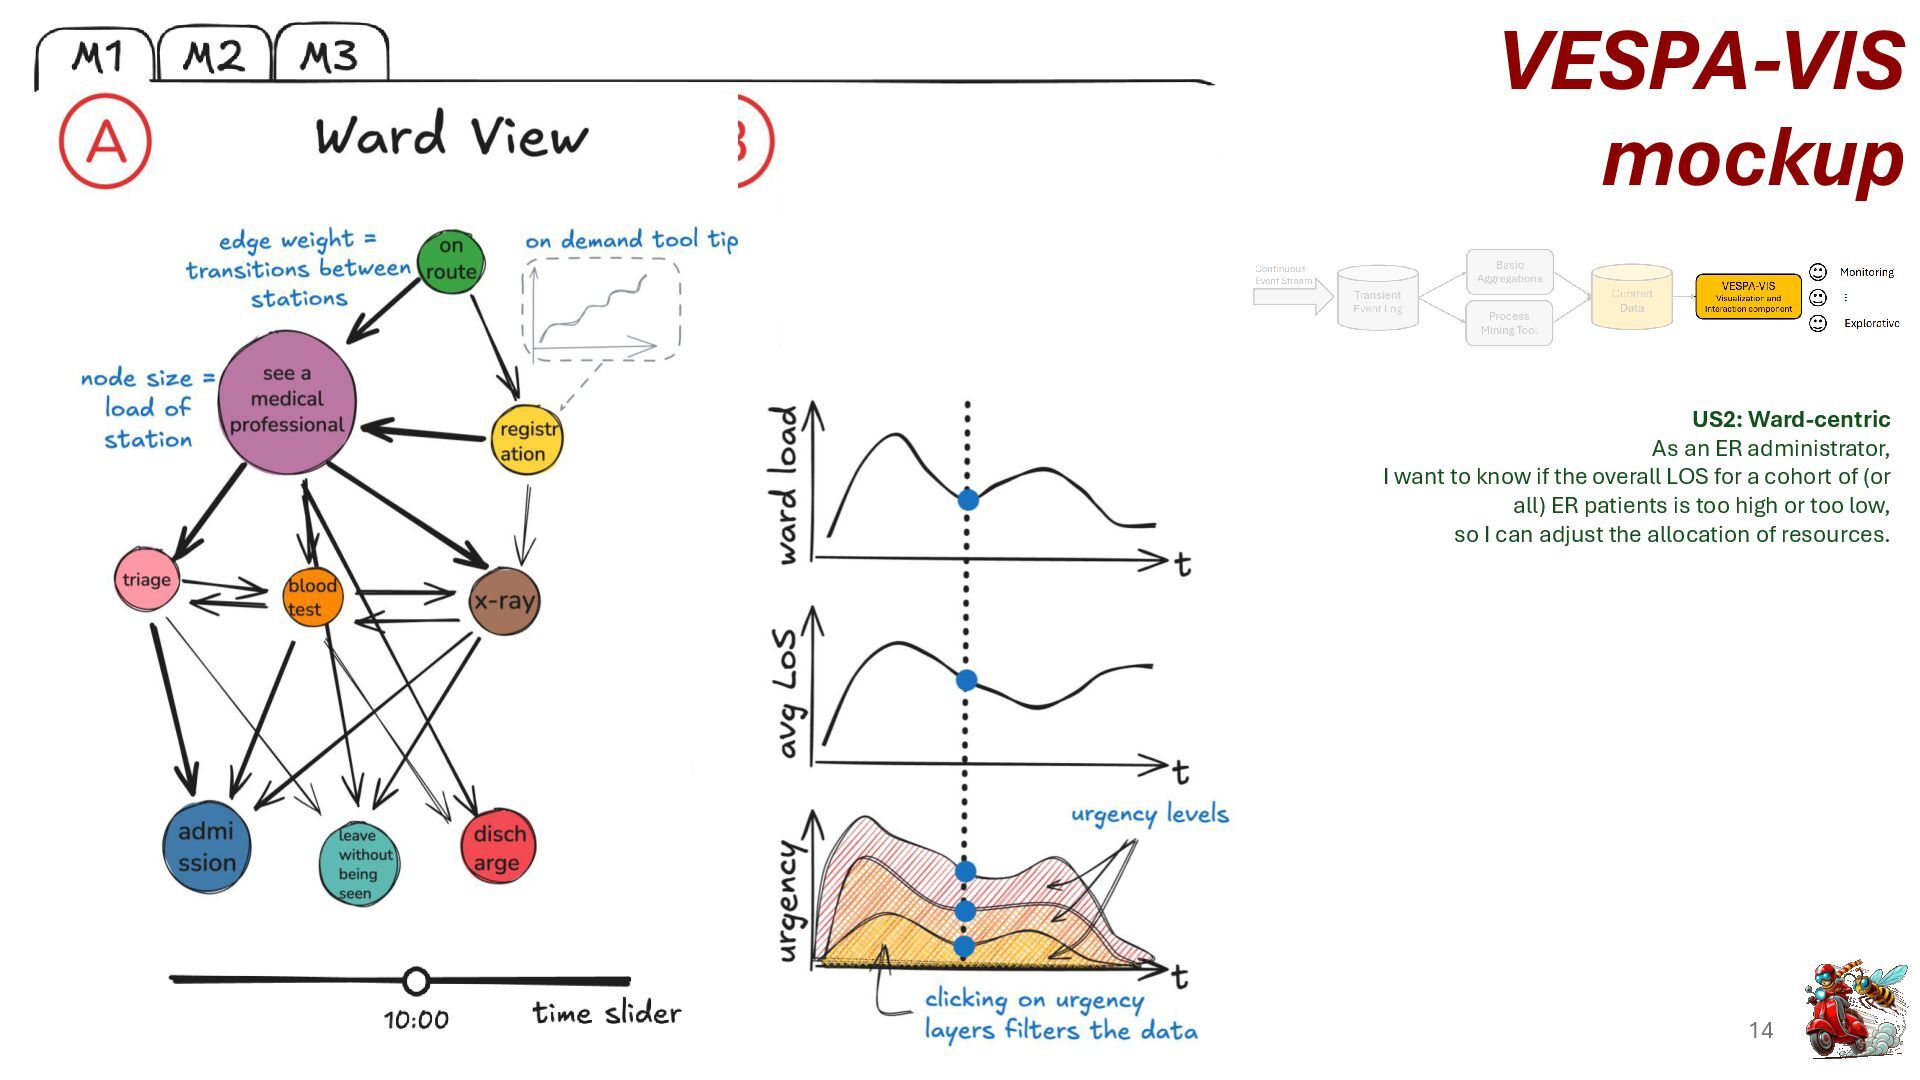
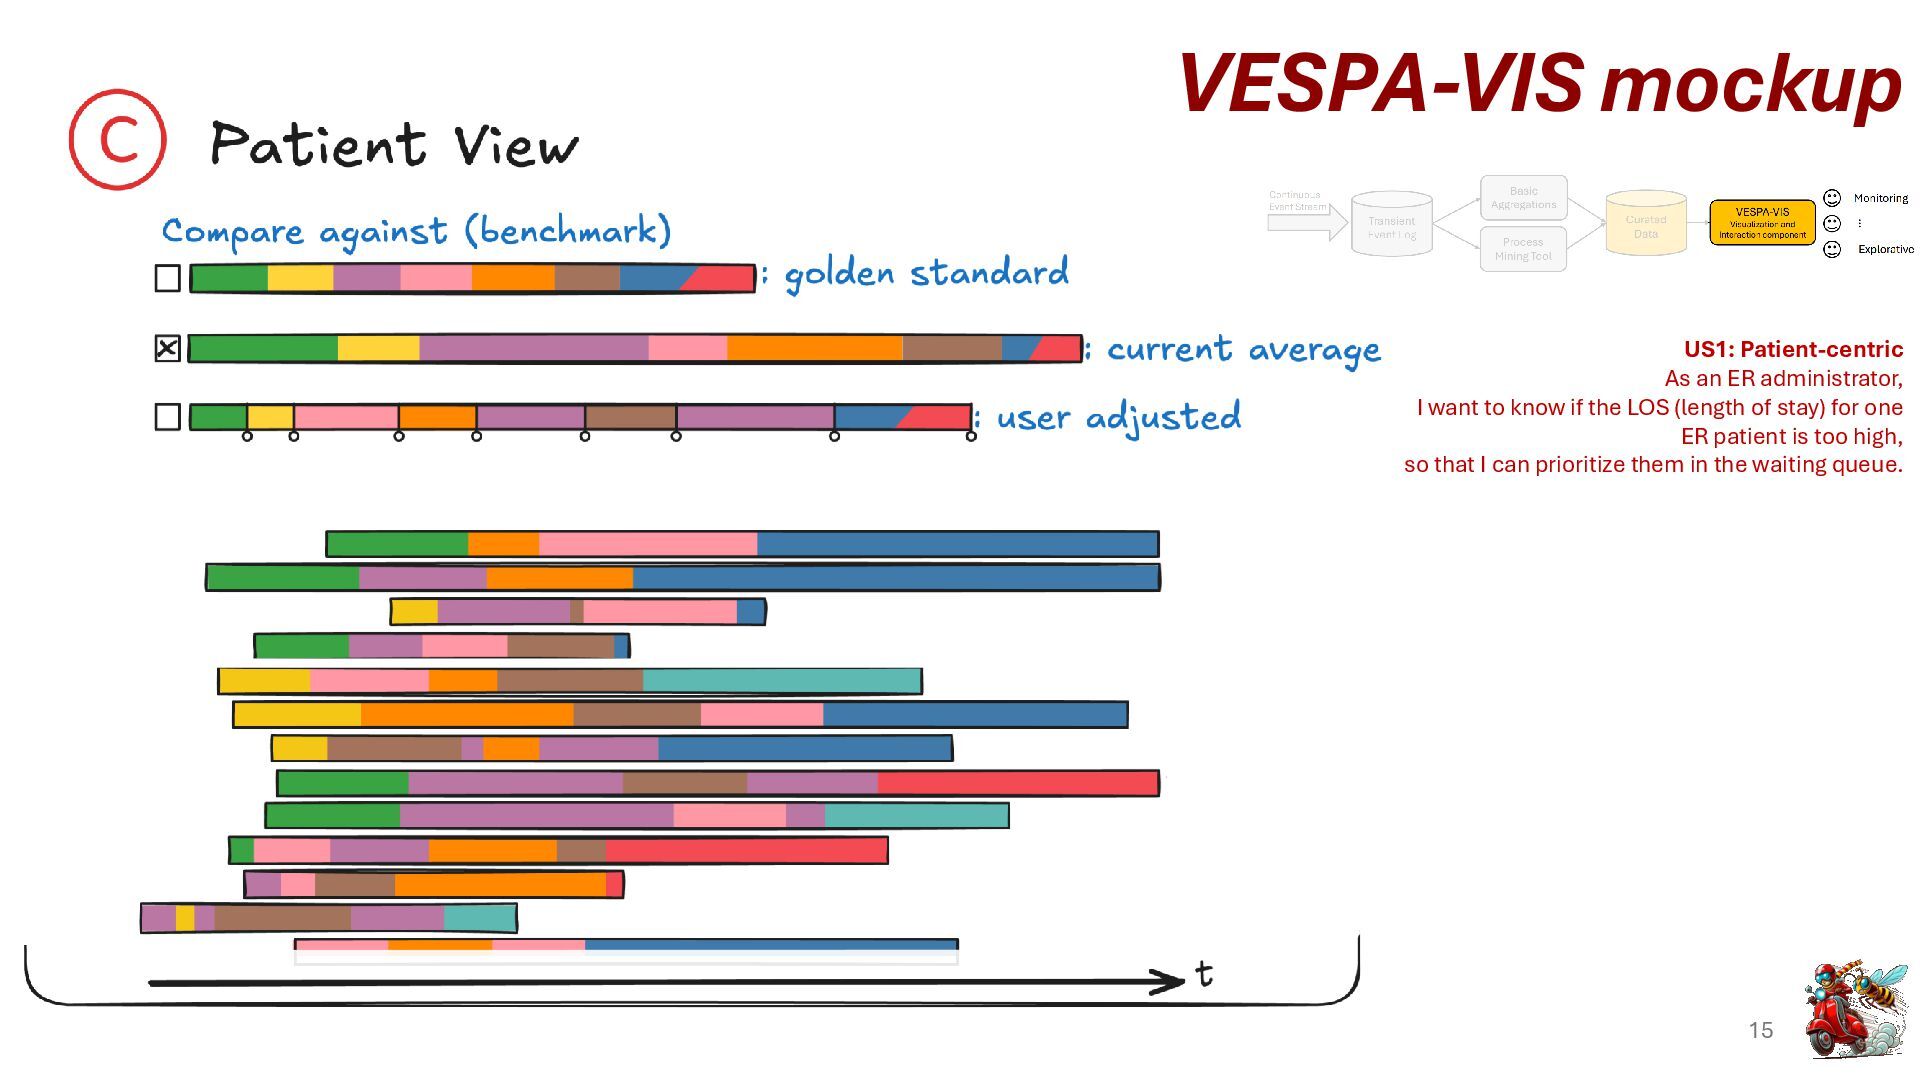
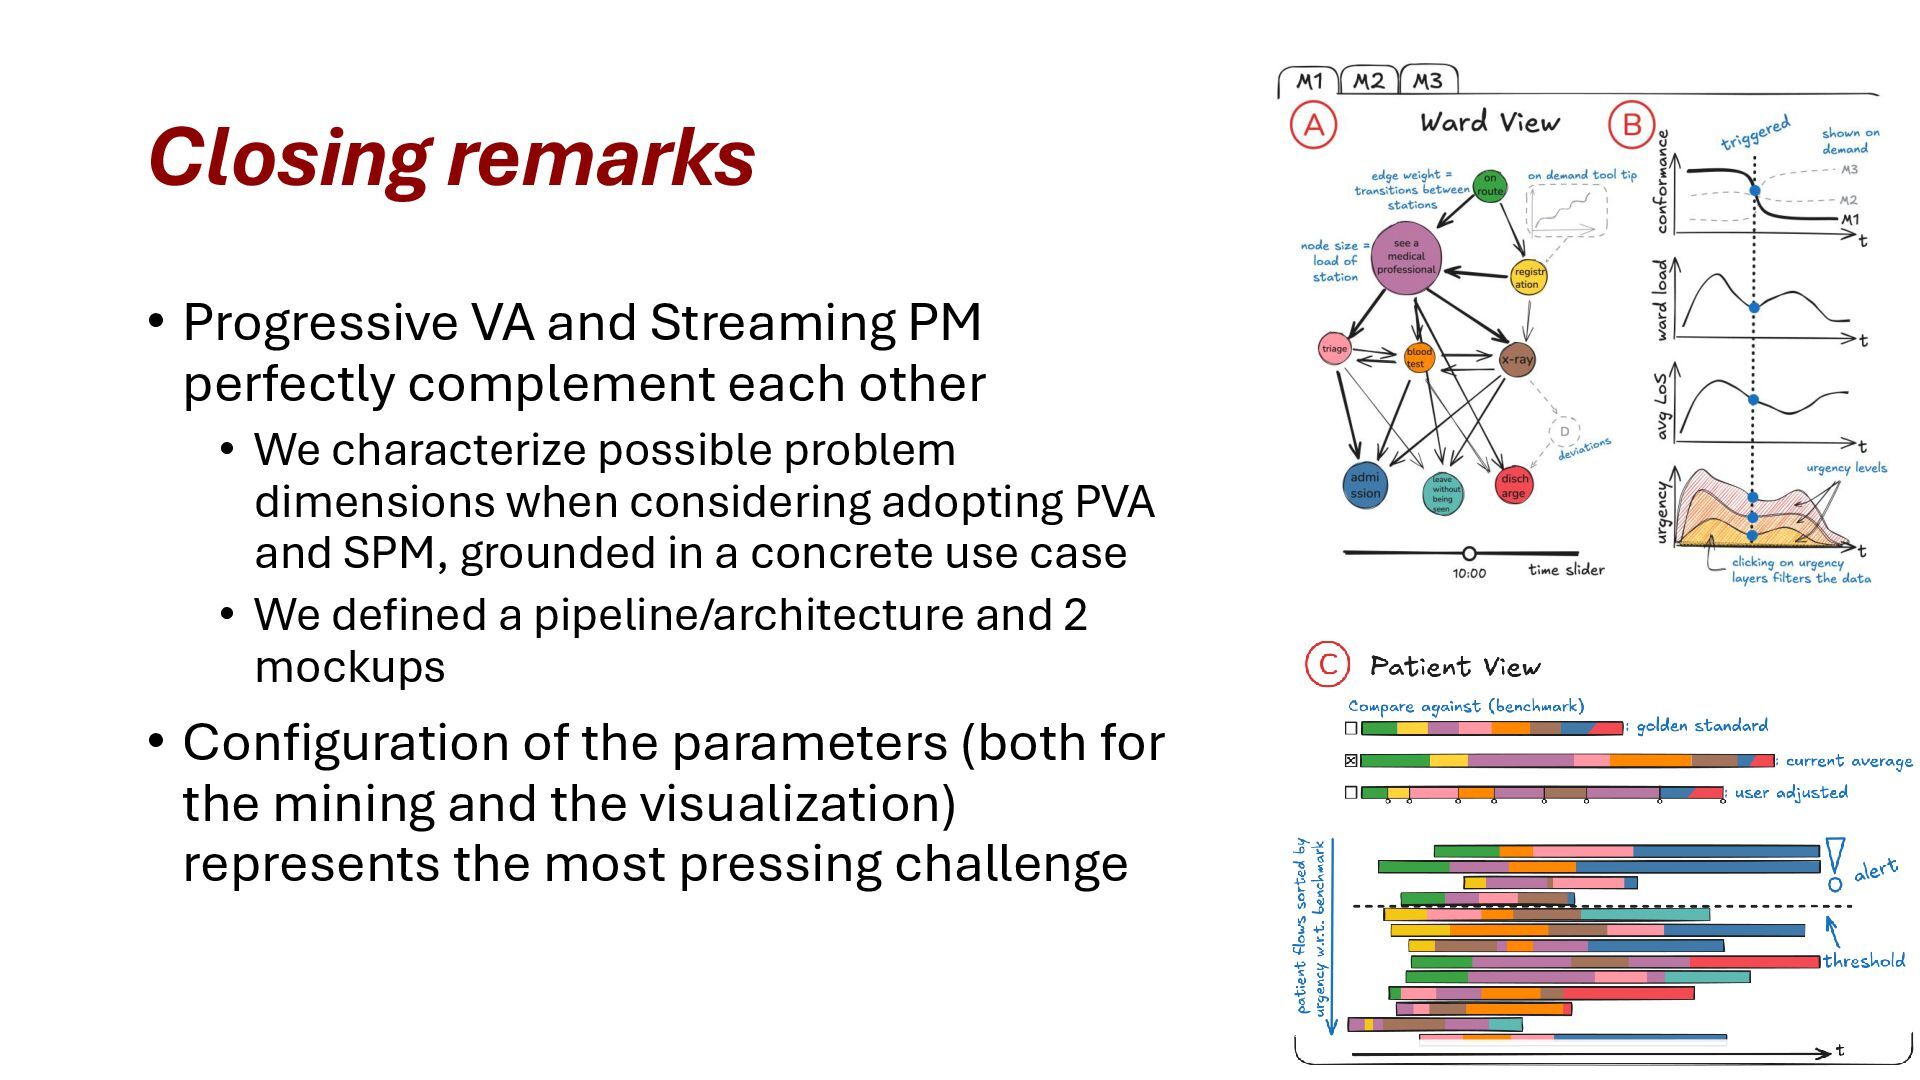
A prototype with ward-centric and patient-centric views was conceptualized, based on a simulated real-world scenario in the context of an emergency department (ER).
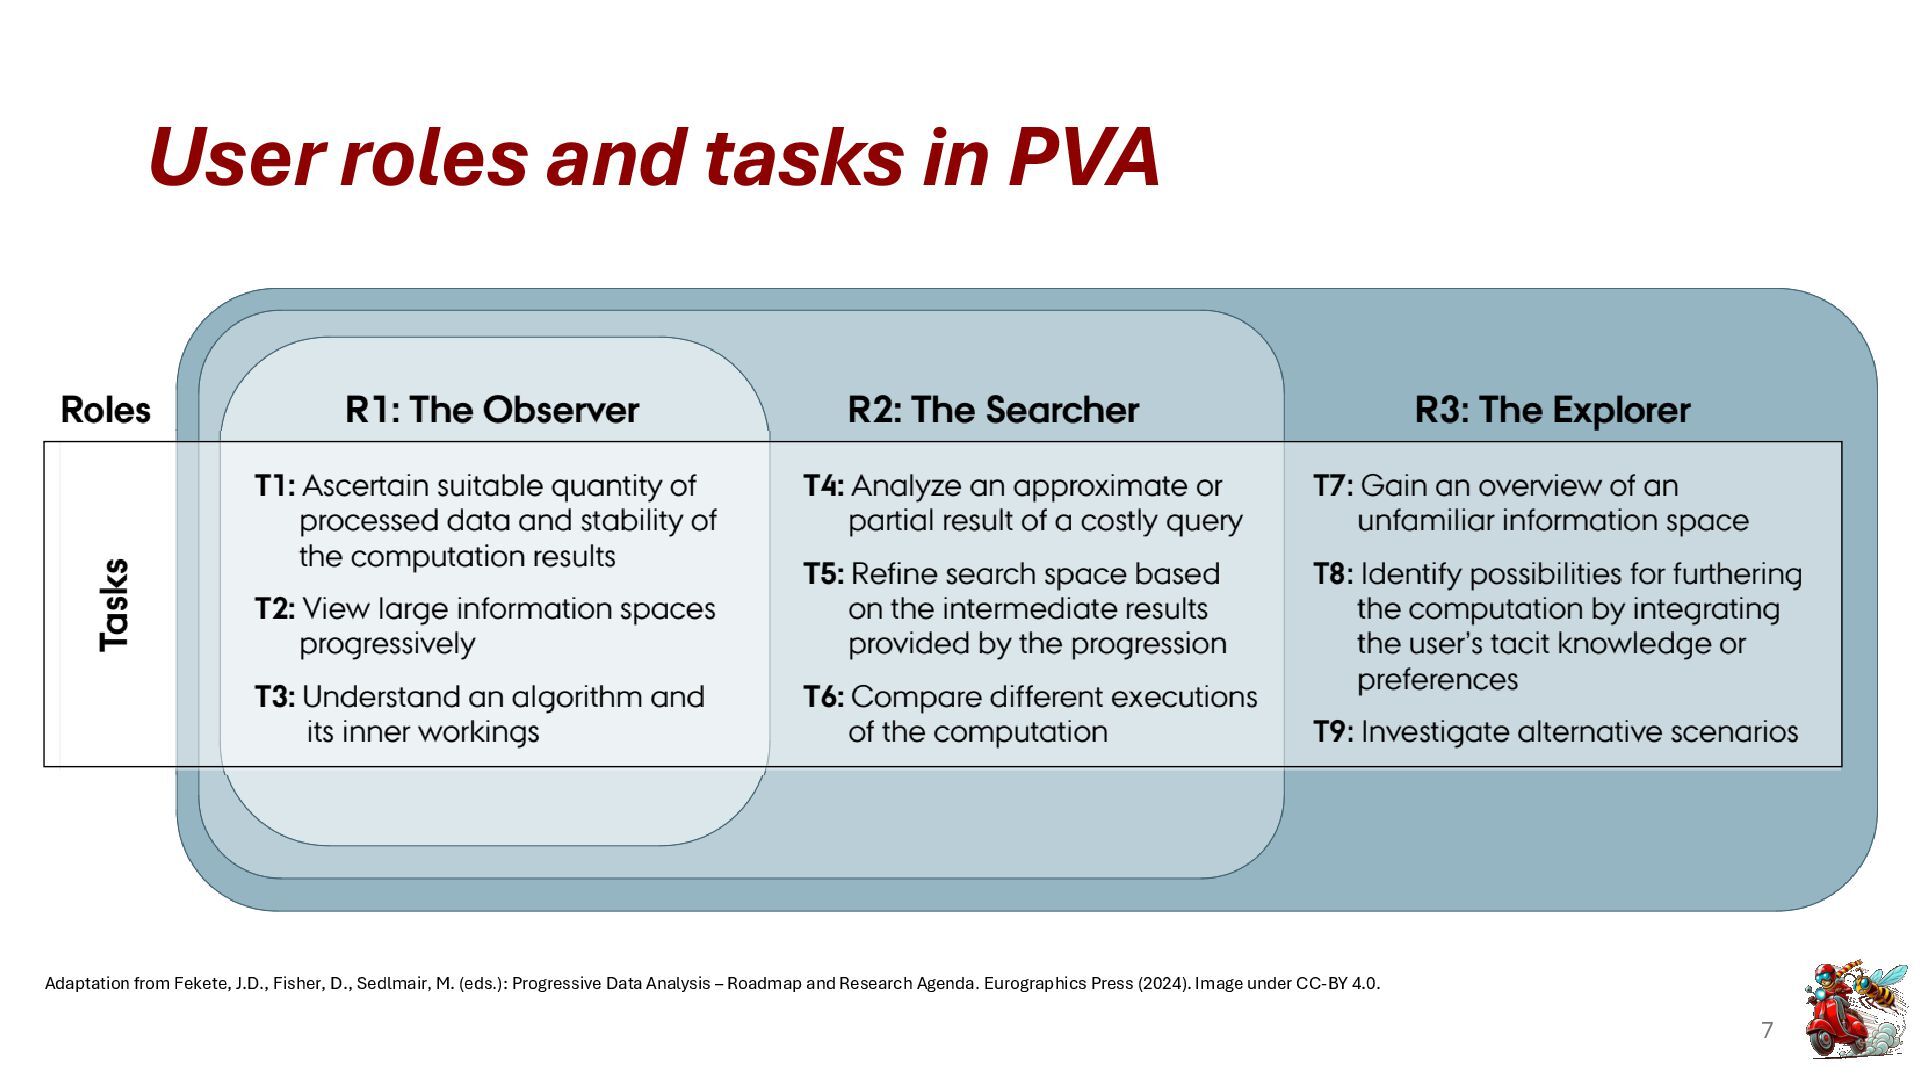
These views support user roles from passive monitoring to active exploration, enabling dynamic prioritization and resource allocation. Preliminary results demonstrate the potential of VESPA to enhance situational awareness and decision-making.

More info: https://andrea.burattin.net/publications/2025-vipra

Avatar for Andrea Burattin

Andrea Burattin

September 03, 2025
Tweet

More Decks by Andrea Burattin

Other Decks in Science

Transcript

  1. VESPA Visual Event-Stream Progressive Analytics Andrea Burattin, Silvia Miksch, Shazia

    Sadiq, Hans-Jörg Schulz and Katerina Vrotsou 2nd Visual Process Analytics Workshop (VIPRA) Co-located with BPM 2025
  2. Reference Scenario • Emergency room at a hospital • Patients

    are tracked using the Hospital Information System (HIS) • Different patient handling policies, based on conditions • Manager On Duty (MOD) monitors KPIs to deploy countermeasures 3 Bullfrog’s Theme Hospital, 1997
  3. Reference Scenario • User stories from our scenario • US1:

    Patient-centric As an ER MOD, I want to know if the LOS (length of stay) for one ER patient is too high, so that I can prioritize them in the waiting queue. • US2: Ward-centric As an ER MOD, I want to know if the overall LOS for a cohort of (or all) ER patients is too high or too low, so I can adjust the allocation of resources. 4 Bullfrog’s Theme Hospital, 1997
  4. Possible conceptual frameworks 5 Streaming Process Mining Inspect one event

    at a time and deliver immediately the (potentially partial) result. Burattin, A. (2022). Streaming Process Mining. In: van der Aalst, W.M.P., Carmona, J. (eds) Process Mining Handbook. Lecture Notes in Business Information Processing, vol 448. Springer, Cham. https://doi.org/10.1007/978-3-031-08848-3_11
  5. Possible conceptual frameworks (cont.) 6 Progressive VA Partial intermediate computational

    results and interactive visualizations. Angelini, M.; Santucci, G.; Schumann, H.; Schulz, H.-J. A Review and Characterization of Progressive Visual Analytics. Informatics 2018, 5, 31. https://doi.org/10.3390/informatics5030031
  6. User roles and tasks in PVA 7 Adaptation from Fekete,

    J.D., Fisher, D., Sedlmair, M. (eds.): Progressive Data Analysis – Roadmap and Research Agenda. Eurographics Press (2024). Image under CC-BY 4.0.
  7. Aspects of the problem space of VESPA • Context of

    the problem • Healthcare / ER • Data space • Data from HIS • Guards (attention triggers) • Conformance below threshold / Load of urgent cases/ LOS for each patient • Tasks • Discovery / Conformance checking / Statistics • Algorithm space • Streaming DFG discovery / Behavioral CC / Statistics • Visualizations • [see next slides] 8
  8. Research questions • What are the required time points for

    progressive visualization for streaming process mining? • Attention of the user neeed • Scheduled / triggered / on demand • What are the effective, efficient, and appropriate progressive visualizations and interactions for streaming process mining? • What is needed / avoid cognitive overload / cost-benefit for the task 9
  9. Users and tasks 10 Tasks US1: Patient-centric As an ER

    administrator, I want to know if the LOS (length of stay) for one ER patient is too high, so that I can prioritize them in the waiting queue. US2: Ward-centric As an ER administrator, I want to know if the overall LOS for a cohort of (or all) ER patients is too high or too low, so I can adjust the allocation of resources. Observer Explorer Spectrum of users In progressive VA Searcher
  10. Data generation • We generated a population of patients •

    We generated a synthetic event stream • Including behavior drifts 12 M1: Regular M2: Off-peak M1: Regular M3: Intense
  11. VESPA-VIS mockup 14 US2: Ward-centric As an ER administrator, I

    want to know if the overall LOS for a cohort of (or all) ER patients is too high or too low, so I can adjust the allocation of resources.
  12. 15 US1: Patient-centric As an ER administrator, I want to

    know if the LOS (length of stay) for one ER patient is too high, so that I can prioritize them in the waiting queue. VESPA-VIS mockup
  13. Closing remarks • Progressive VA and Streaming PM perfectly complement

    each other • We characterize possible problem dimensions when considering adopting PVA and SPM, grounded in a concrete use case • We defined a pipeline/architecture and 2 mockups • Configuration of the parameters (both for the mining and the visualization) represents the most pressing challenge 16