projections for 2019-29 (Zilberman & Ice, 2021) STEM occupations : +8.0% All other occupations : +3.7% The demand for STEM professionals is increasing ⚫ The gap between supply and demand for STEM professionals ➢ EU • 40% EU employers said in 2013 that they have difficulty finding the right skills when recruiting (Cedefop, 2018). ➢ Japan • There is a shortage of STEM workforce to meet the demand of companies (METI, 2018). We need to increase the number of people choosing STEM careers to close these gaps.
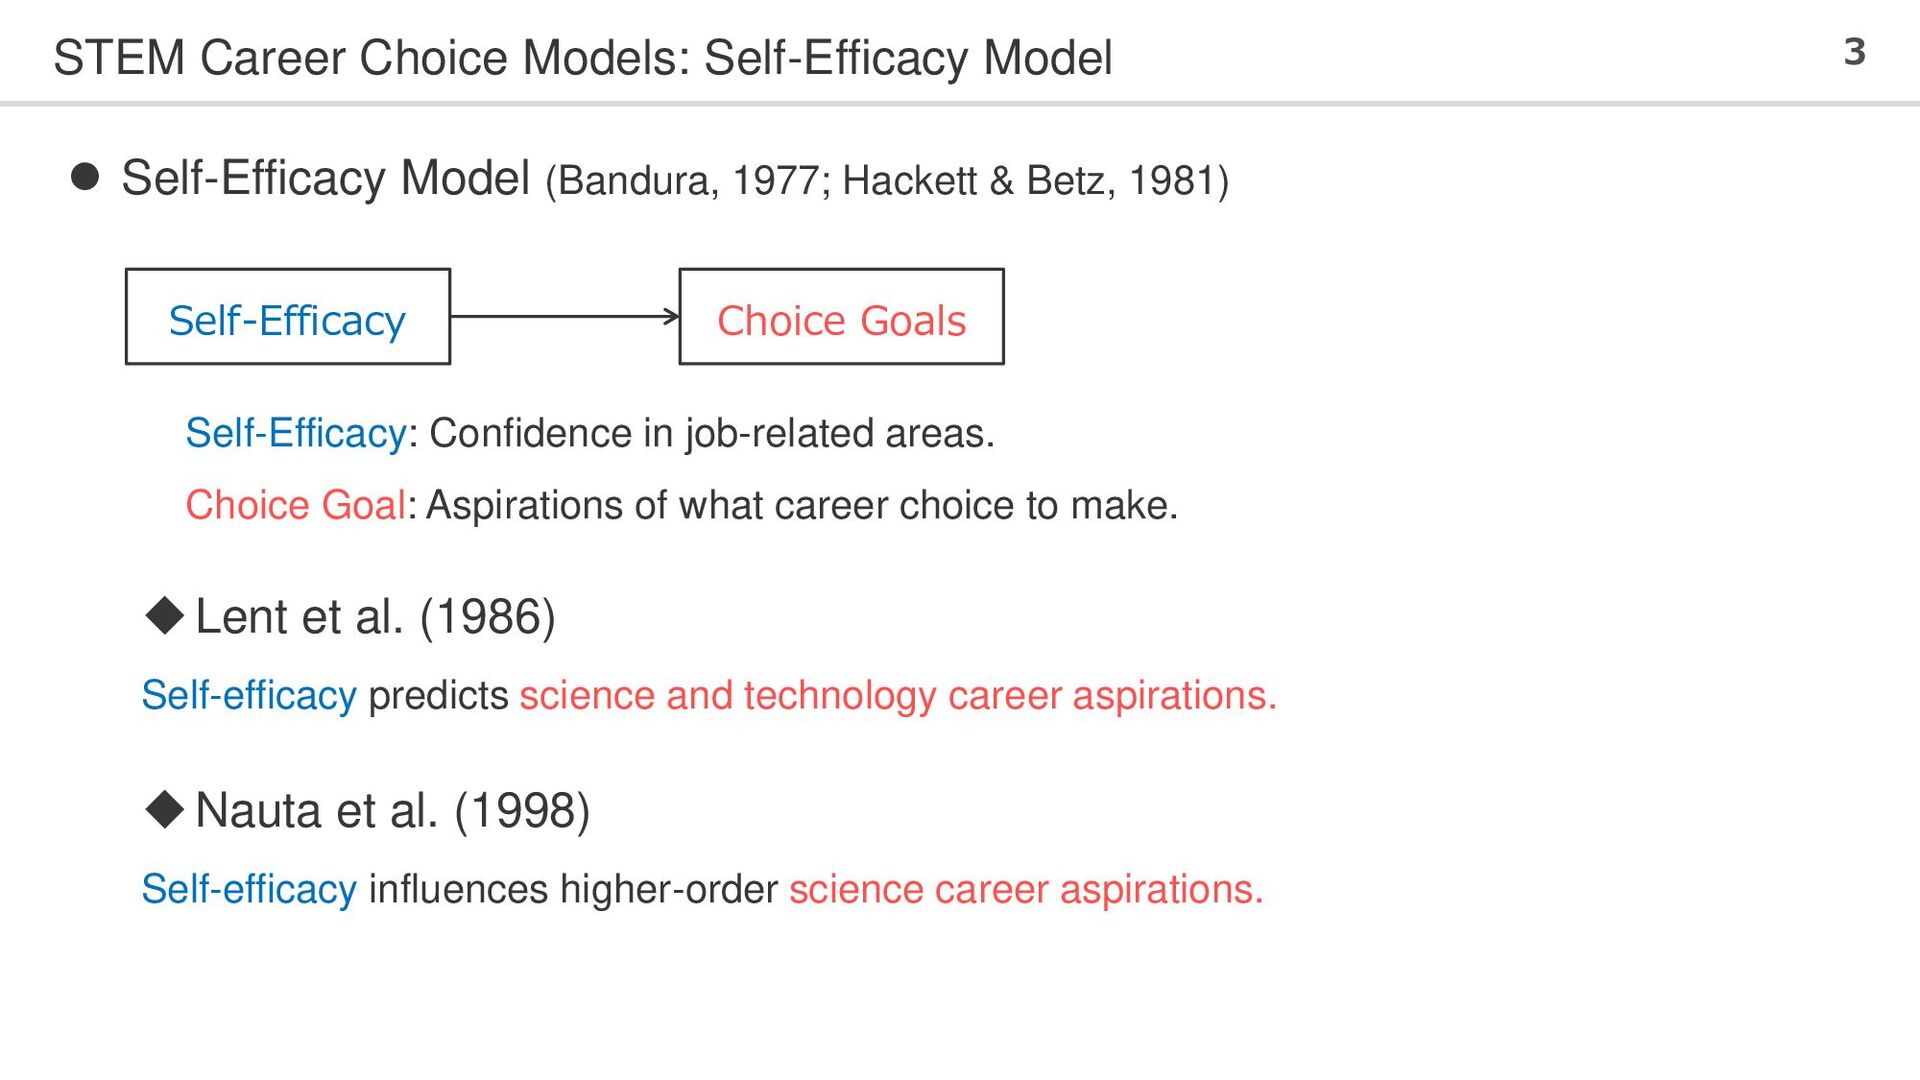
(Bandura, 1977; Hackett & Betz, 1981) Self-Efficacy Choice Goals Self-Efficacy: Confidence in job-related areas. Choice Goal: Aspirations of what career choice to make. ◆Lent et al. (1986) Self-efficacy predicts science and technology career aspirations. ◆Nauta et al. (1998) Self-efficacy influences higher-order science career aspirations.
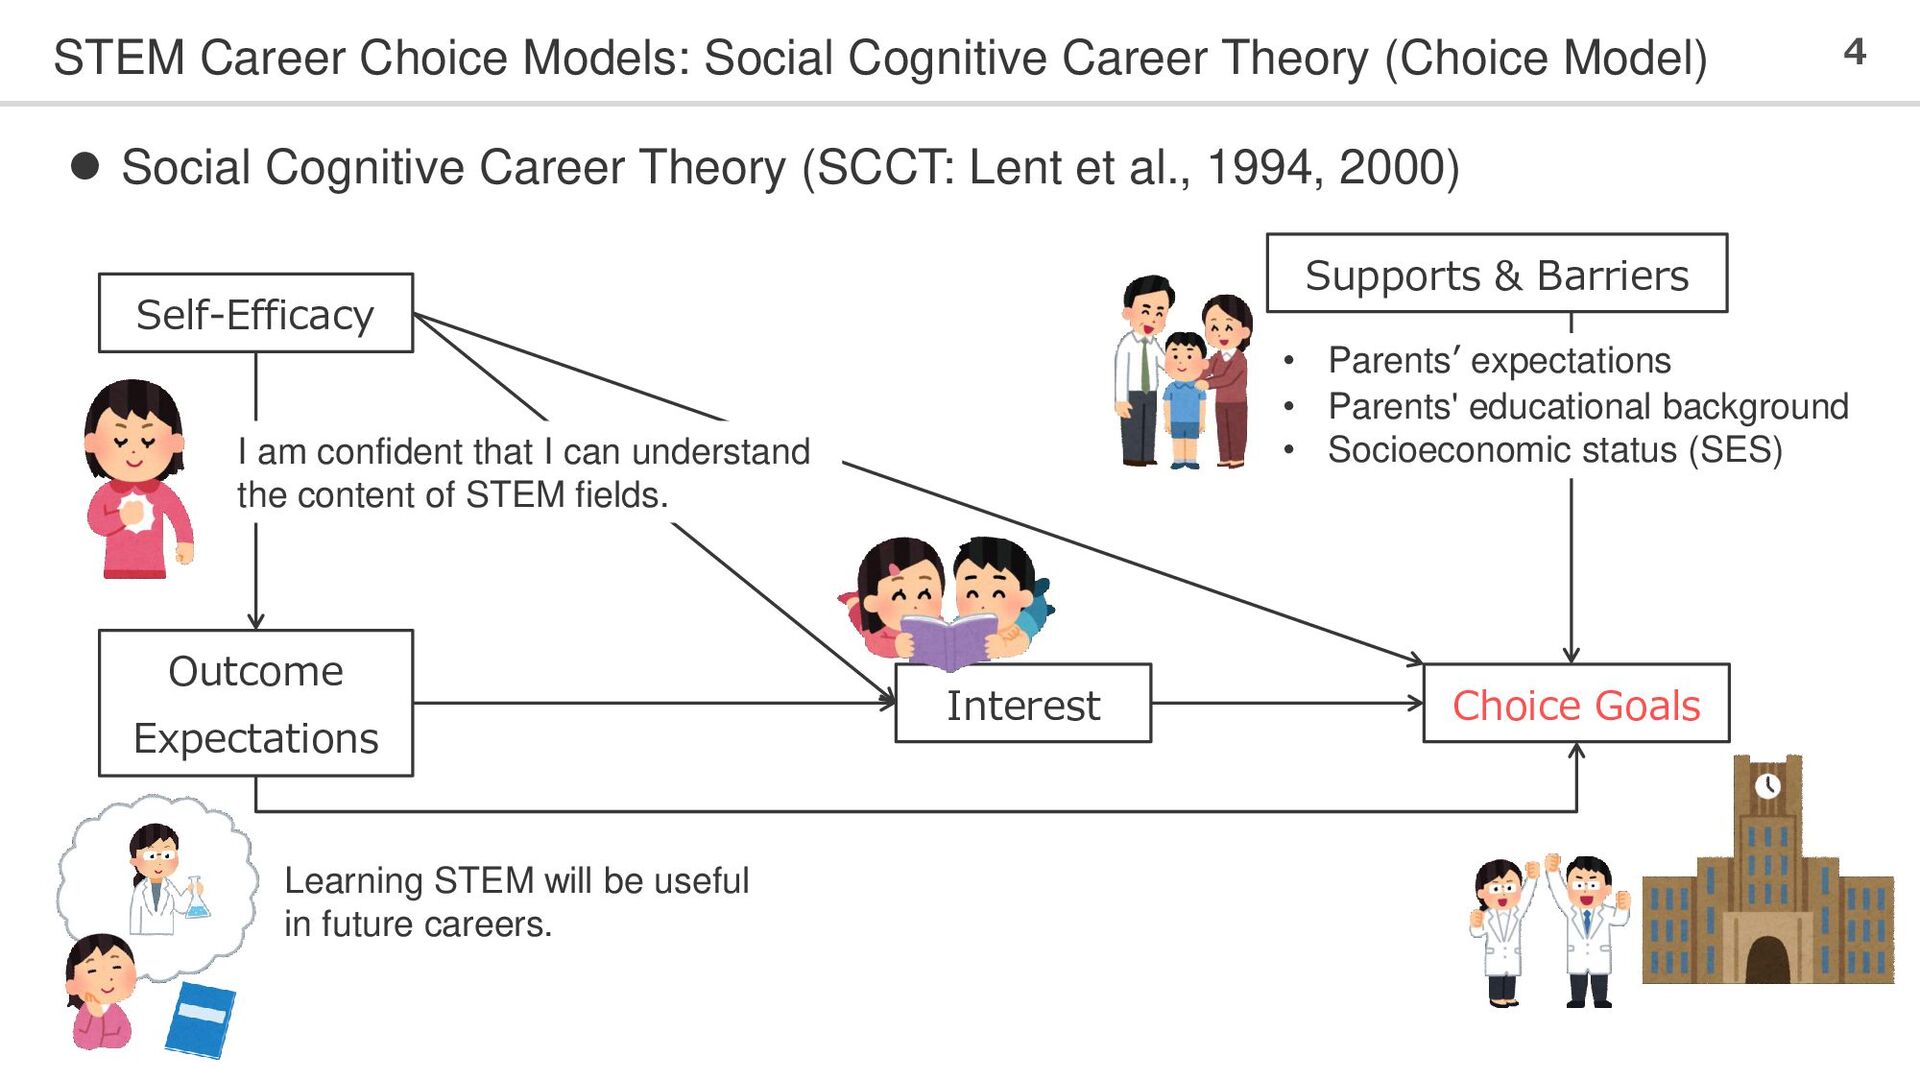
4 ⚫ Social Cognitive Career Theory (SCCT: Lent et al., 1994, 2000) Self-Efficacy Interest Outcome Expectations Choice Goals Learning STEM will be useful in future careers. Supports & Barriers • Parents’ expectations • Parents' educational background • Socioeconomic status (SES) I am confident that I can understand the content of STEM fields.
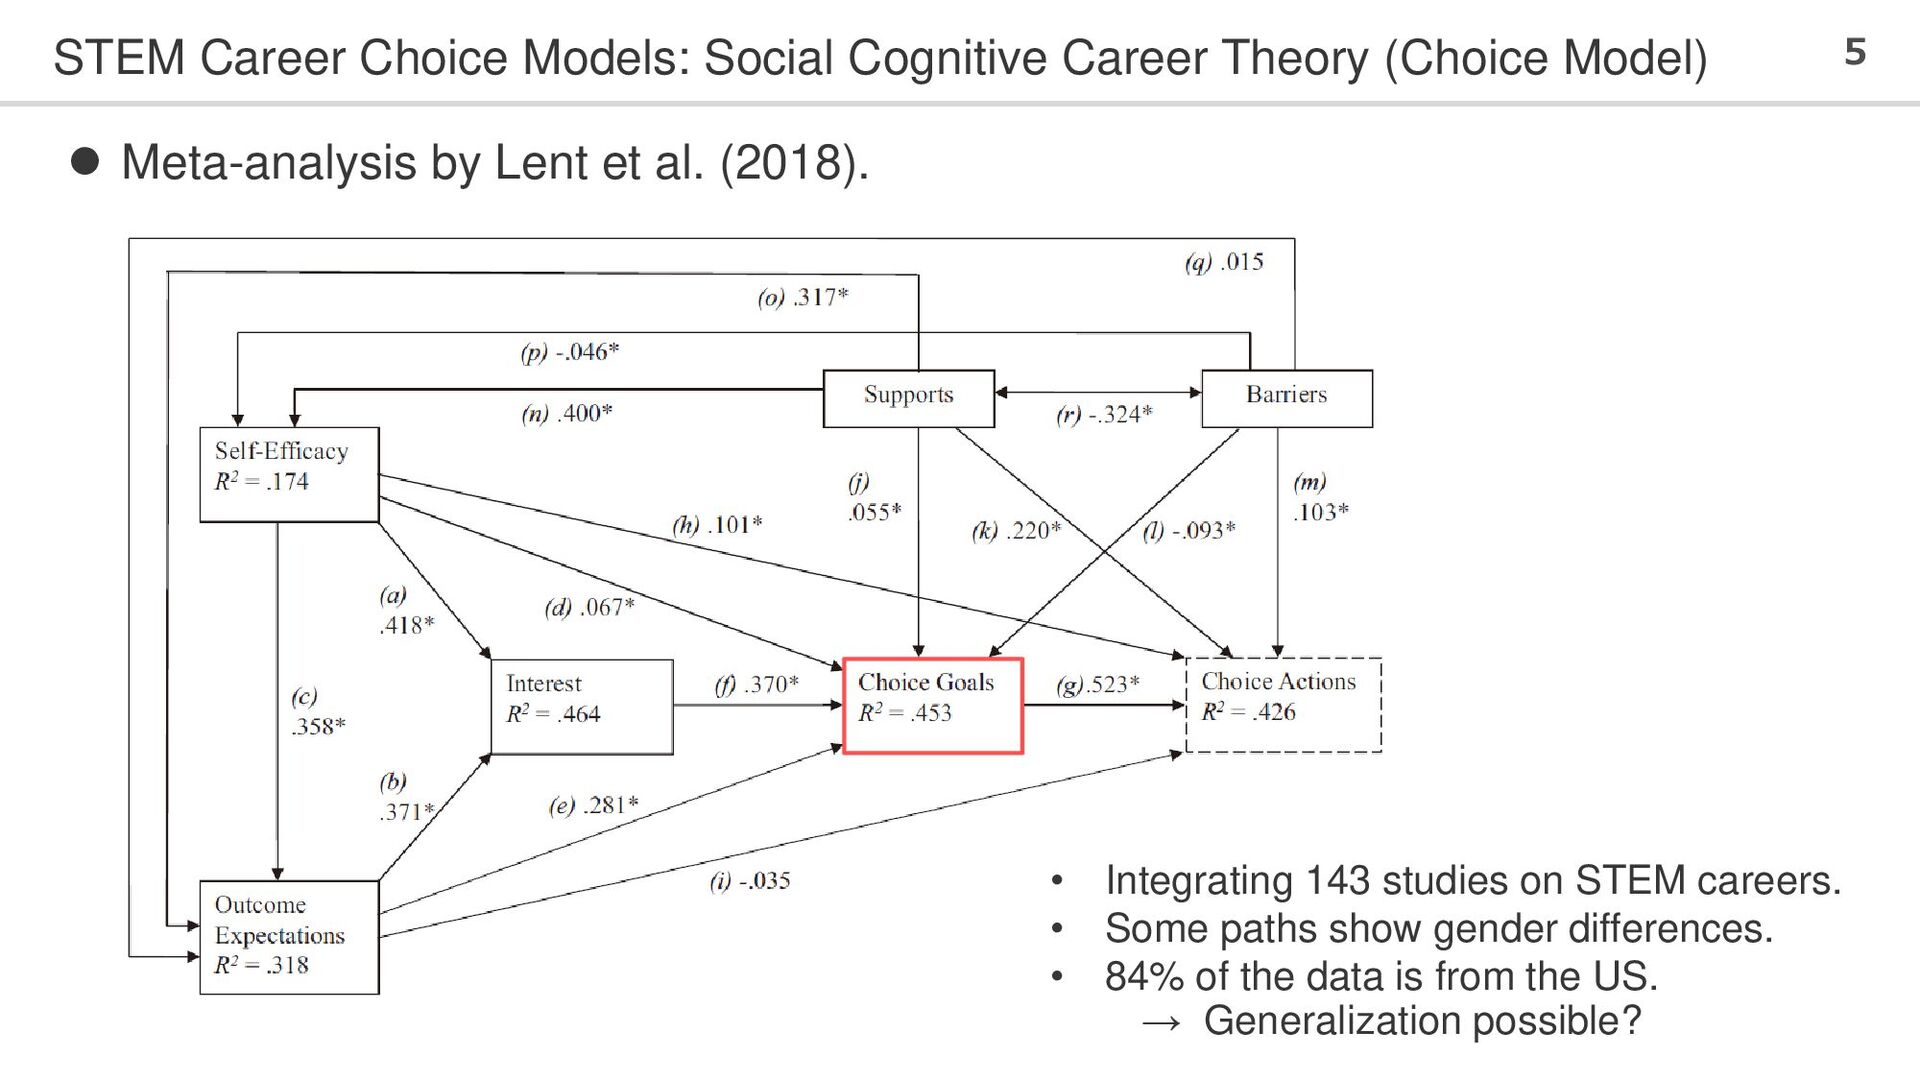
5 ⚫ Meta-analysis by Lent et al. (2018). • Integrating 143 studies on STEM careers. • Some paths show gender differences. • 84% of the data is from the US. → Generalization possible?
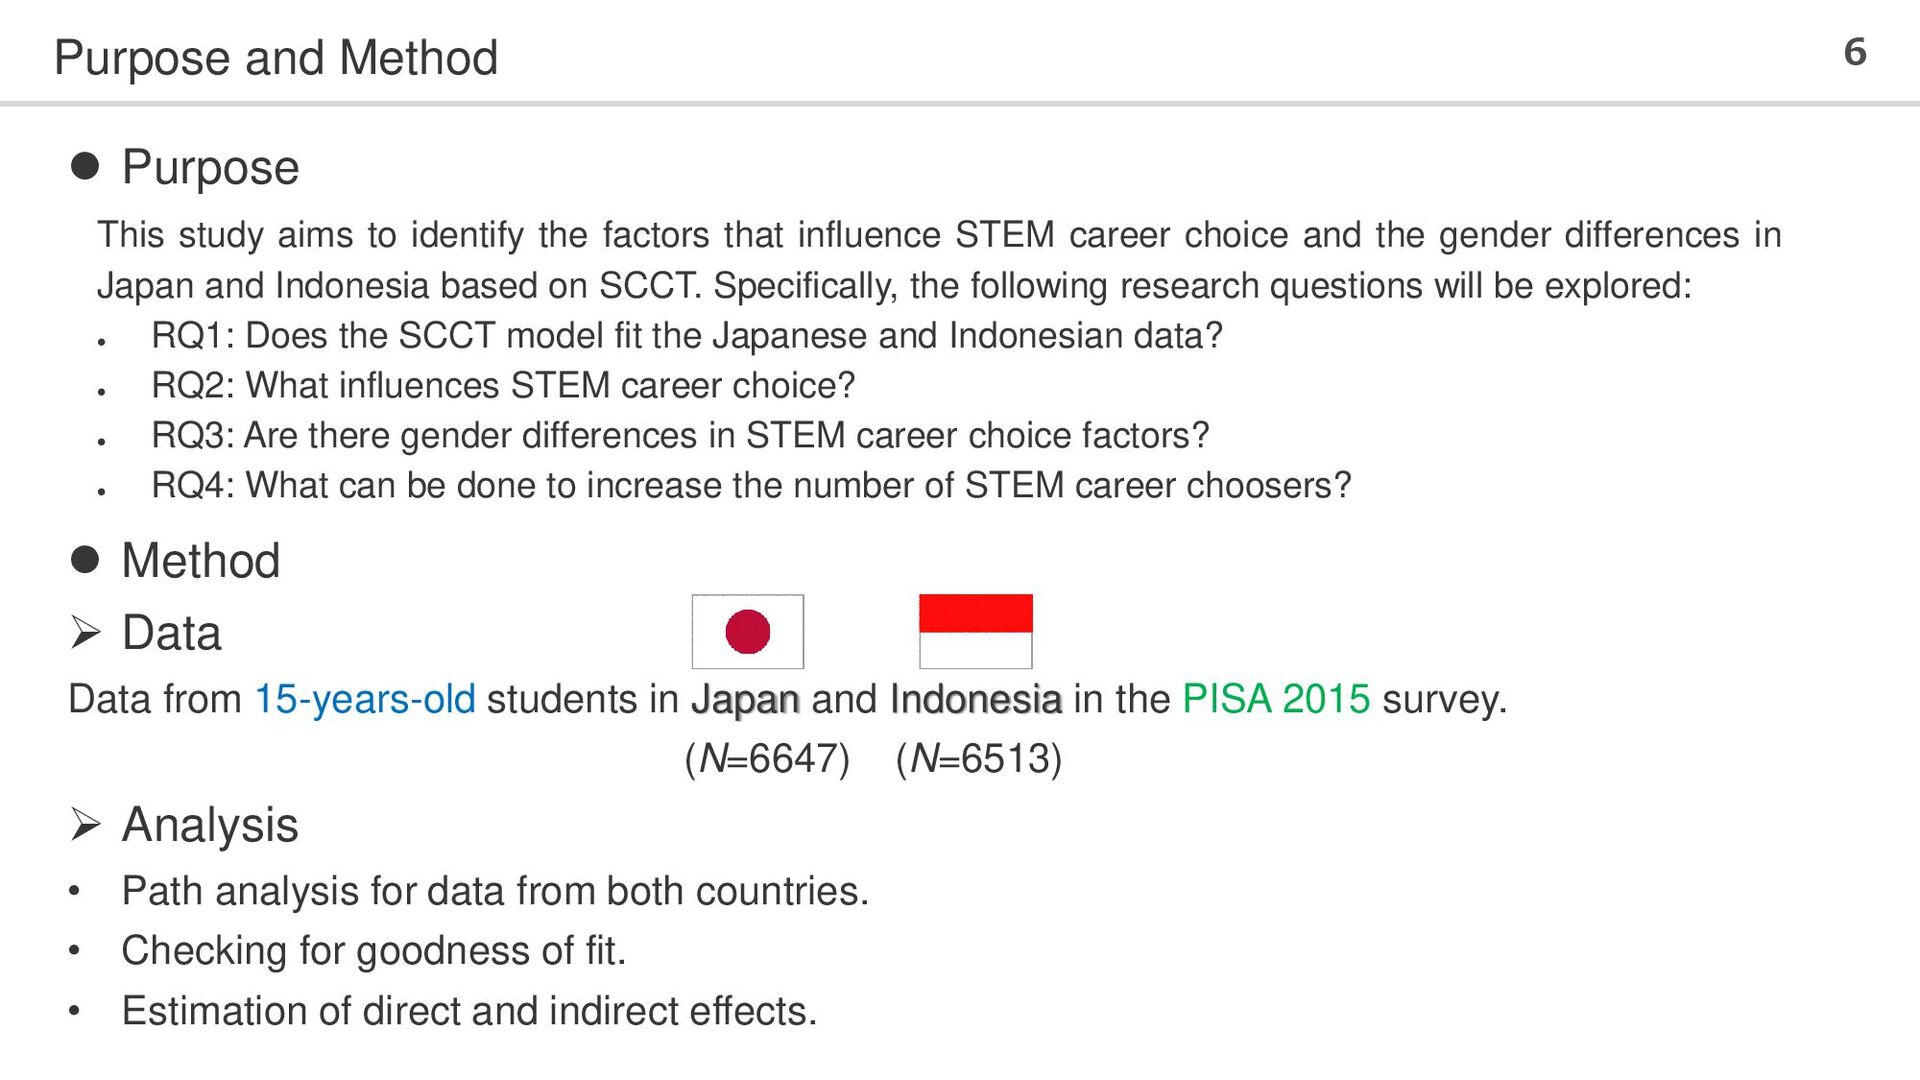
Data from 15-years-old students in Japan and Indonesia in the PISA 2015 survey. (N=6647) (N=6513) ➢ Analysis • Path analysis for data from both countries. • Checking for goodness of fit. • Estimation of direct and indirect effects. This study aims to identify the factors that influence STEM career choice and the gender differences in Japan and Indonesia based on SCCT. Specifically, the following research questions will be explored: • RQ1: Does the SCCT model fit the Japanese and Indonesian data? • RQ2: What influences STEM career choice? • RQ3: Are there gender differences in STEM career choice factors? • RQ4: What can be done to increase the number of STEM career choosers?
= FAY (.5); TYPE = GENERAL COMPLEX; ESTIMATOR = WLSMV; ⚫ SCCT Choice Model Self-Efficacy Outcome Expectations Interest Economic, Social and Cultural Status STEM Career Aspirations
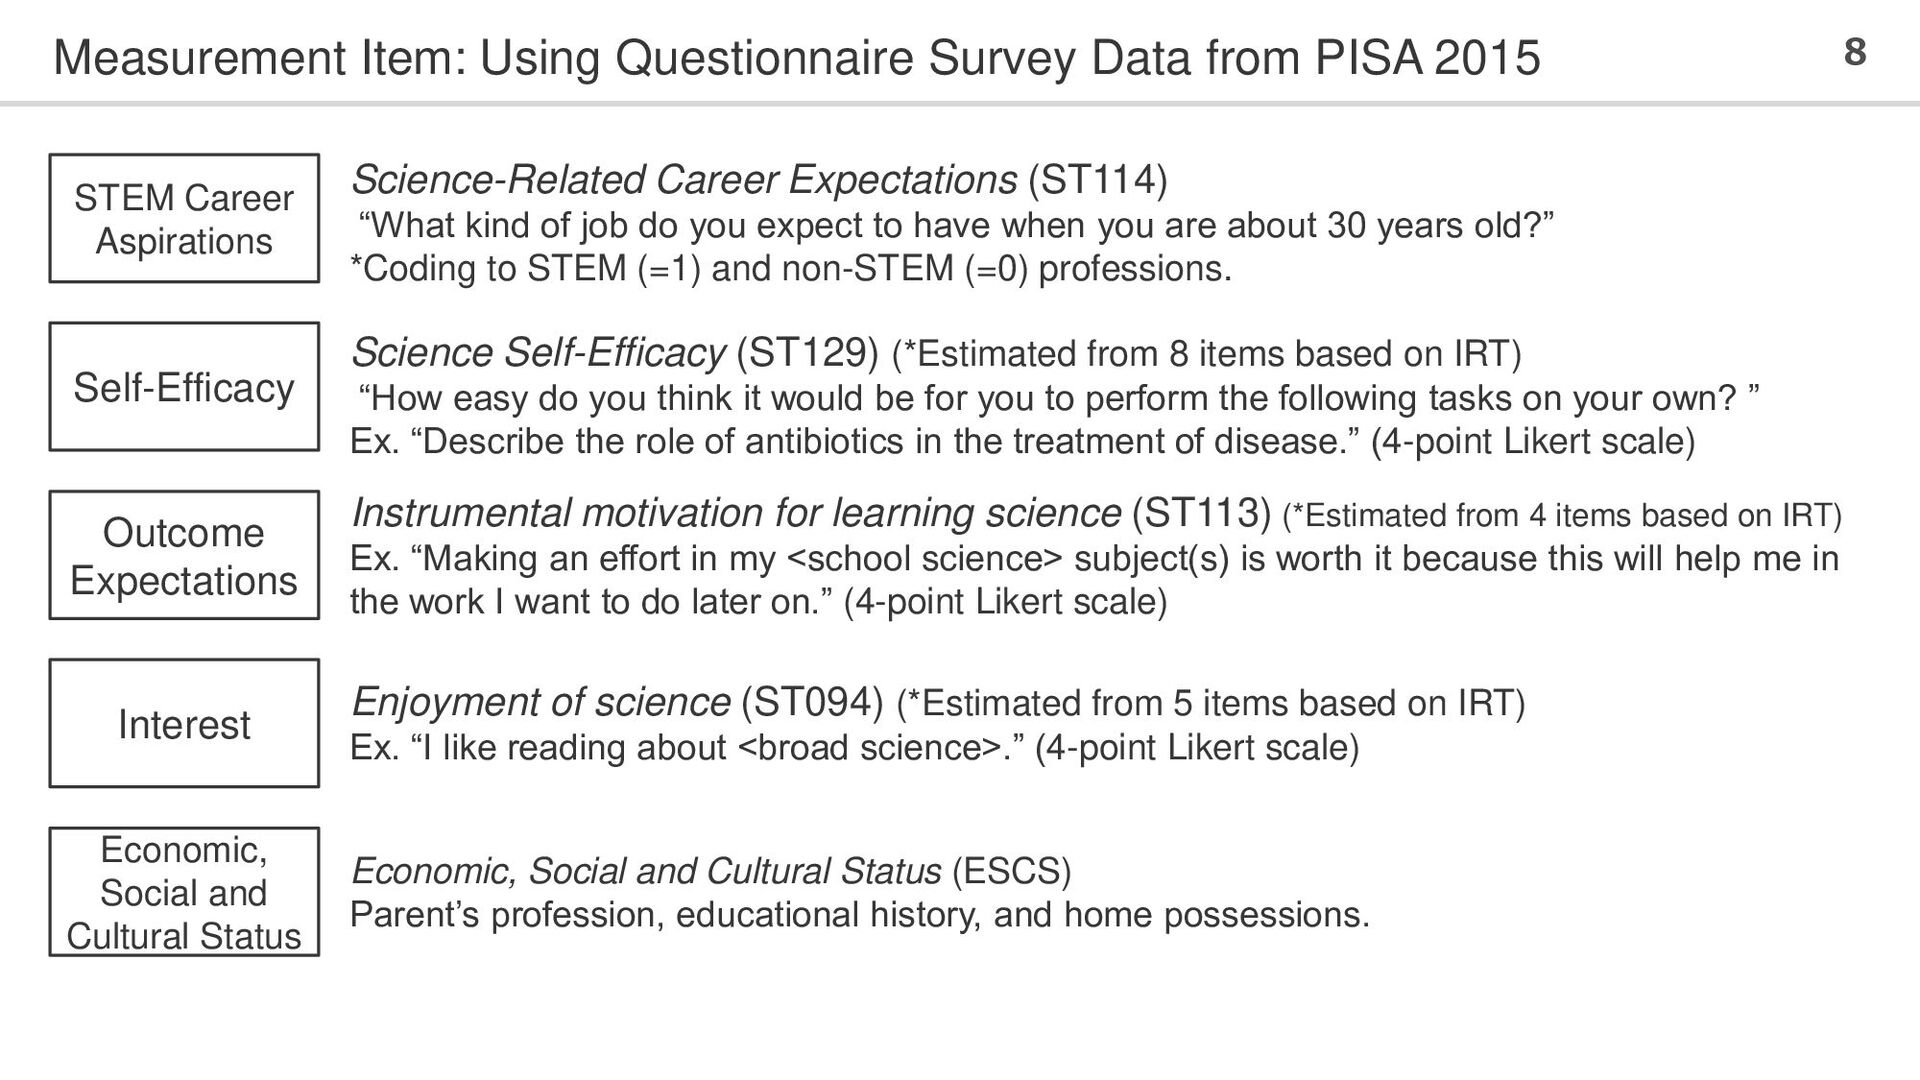
Outcome Expectations Self-Efficacy STEM Career Aspirations Interest Economic, Social and Cultural Status Science-Related Career Expectations (ST114) “What kind of job do you expect to have when you are about 30 years old?” *Coding to STEM (=1) and non-STEM (=0) professions. Instrumental motivation for learning science (ST113) (*Estimated from 4 items based on IRT) Ex. “Making an effort in my <school science> subject(s) is worth it because this will help me in the work I want to do later on.” (4-point Likert scale) Science Self-Efficacy (ST129) (*Estimated from 8 items based on IRT) “How easy do you think it would be for you to perform the following tasks on your own? ” Ex. “Describe the role of antibiotics in the treatment of disease.” (4-point Likert scale) Enjoyment of science (ST094) (*Estimated from 5 items based on IRT) Ex. “I like reading about <broad science>.” (4-point Likert scale) Economic, Social and Cultural Status (ESCS) Parent’s profession, educational history, and home possessions.
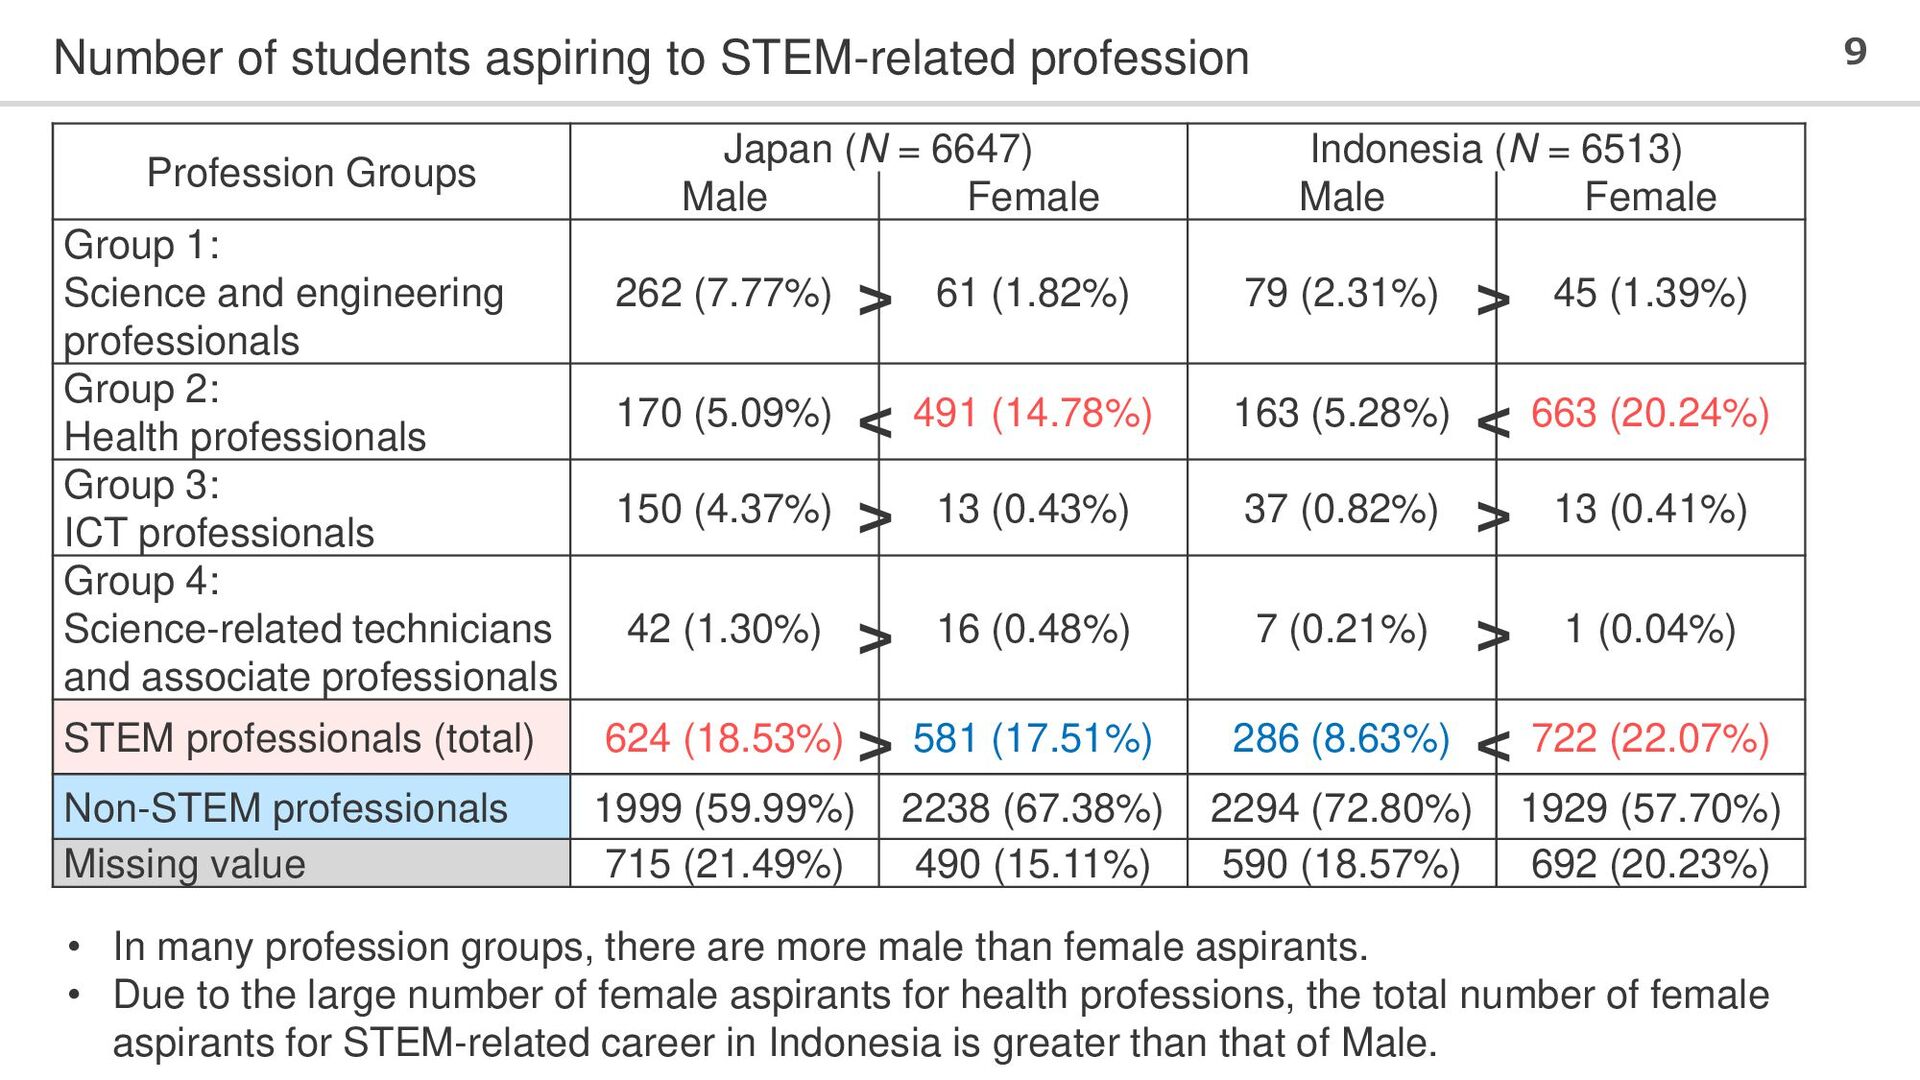
Japan (N = 6647) Indonesia (N = 6513) Male Female Male Female Group 1: Science and engineering professionals 262 (7.77%) 61 (1.82%) 79 (2.31%) 45 (1.39%) Group 2: Health professionals 170 (5.09%) 491 (14.78%) 163 (5.28%) 663 (20.24%) Group 3: ICT professionals 150 (4.37%) 13 (0.43%) 37 (0.82%) 13 (0.41%) Group 4: Science-related technicians and associate professionals 42 (1.30%) 16 (0.48%) 7 (0.21%) 1 (0.04%) STEM professionals (total) 624 (18.53%) 581 (17.51%) 286 (8.63%) 722 (22.07%) Non-STEM professionals 1999 (59.99%) 2238 (67.38%) 2294 (72.80%) 1929 (57.70%) Missing value 715 (21.49%) 490 (15.11%) 590 (18.57%) 692 (20.23%) < < < > > > > > > > • In many profession groups, there are more male than female aspirants. • Due to the large number of female aspirants for health professions, the total number of female aspirants for STEM-related career in Indonesia is greater than that of Male.
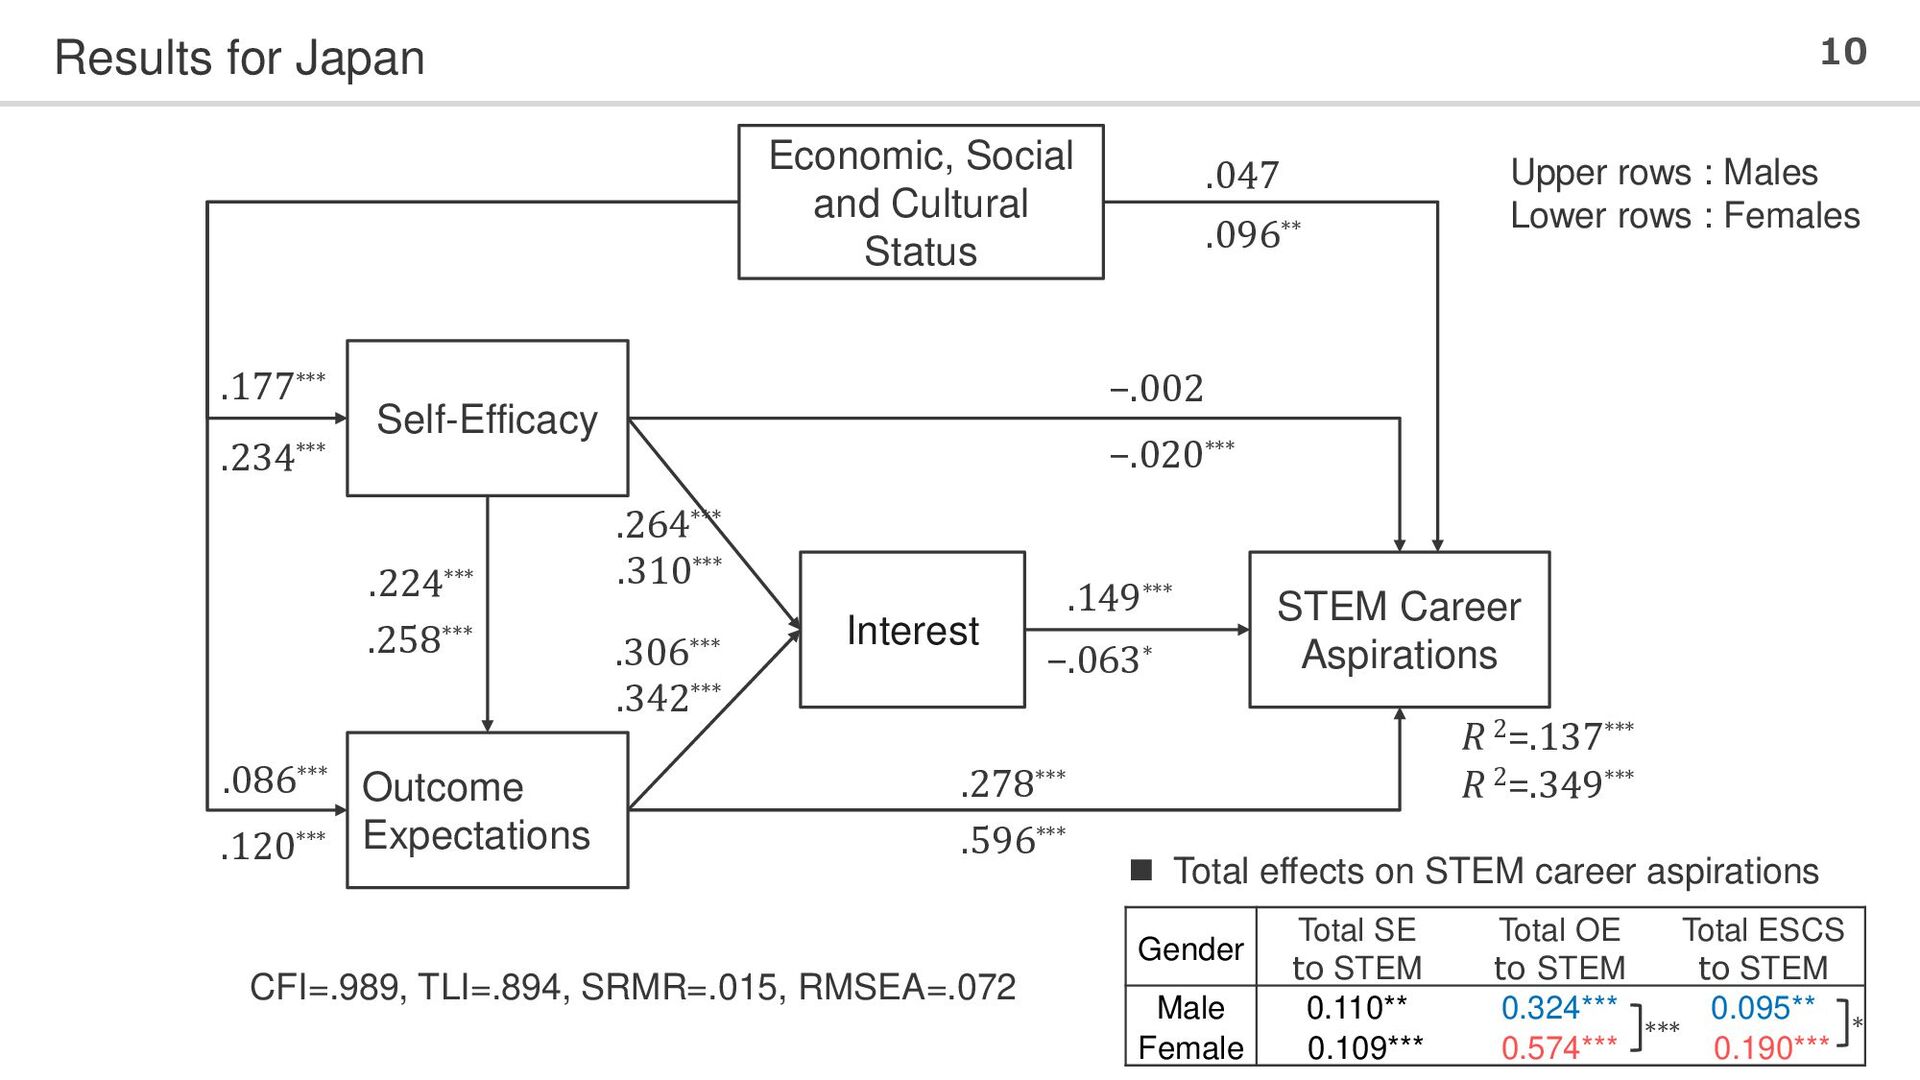
and Cultural Status STEM Career Aspirations .086*** .047 .177*** .306*** .264*** .278*** .149*** −.002 .224*** .234*** .258*** .120*** .096** .310*** .342*** .596*** −.063* −.020*** R 2=.137*** R 2=.349*** Gender Total SE to STEM Total OE to STEM Total ESCS to STEM Male 0.110** 0.324*** 0.095** Female 0.109*** 0.574*** 0.190*** Upper rows : Males Lower rows : Females CFI=.989, TLI=.894, SRMR=.015, RMSEA=.072 ◼ Total effects on STEM career aspirations *** *
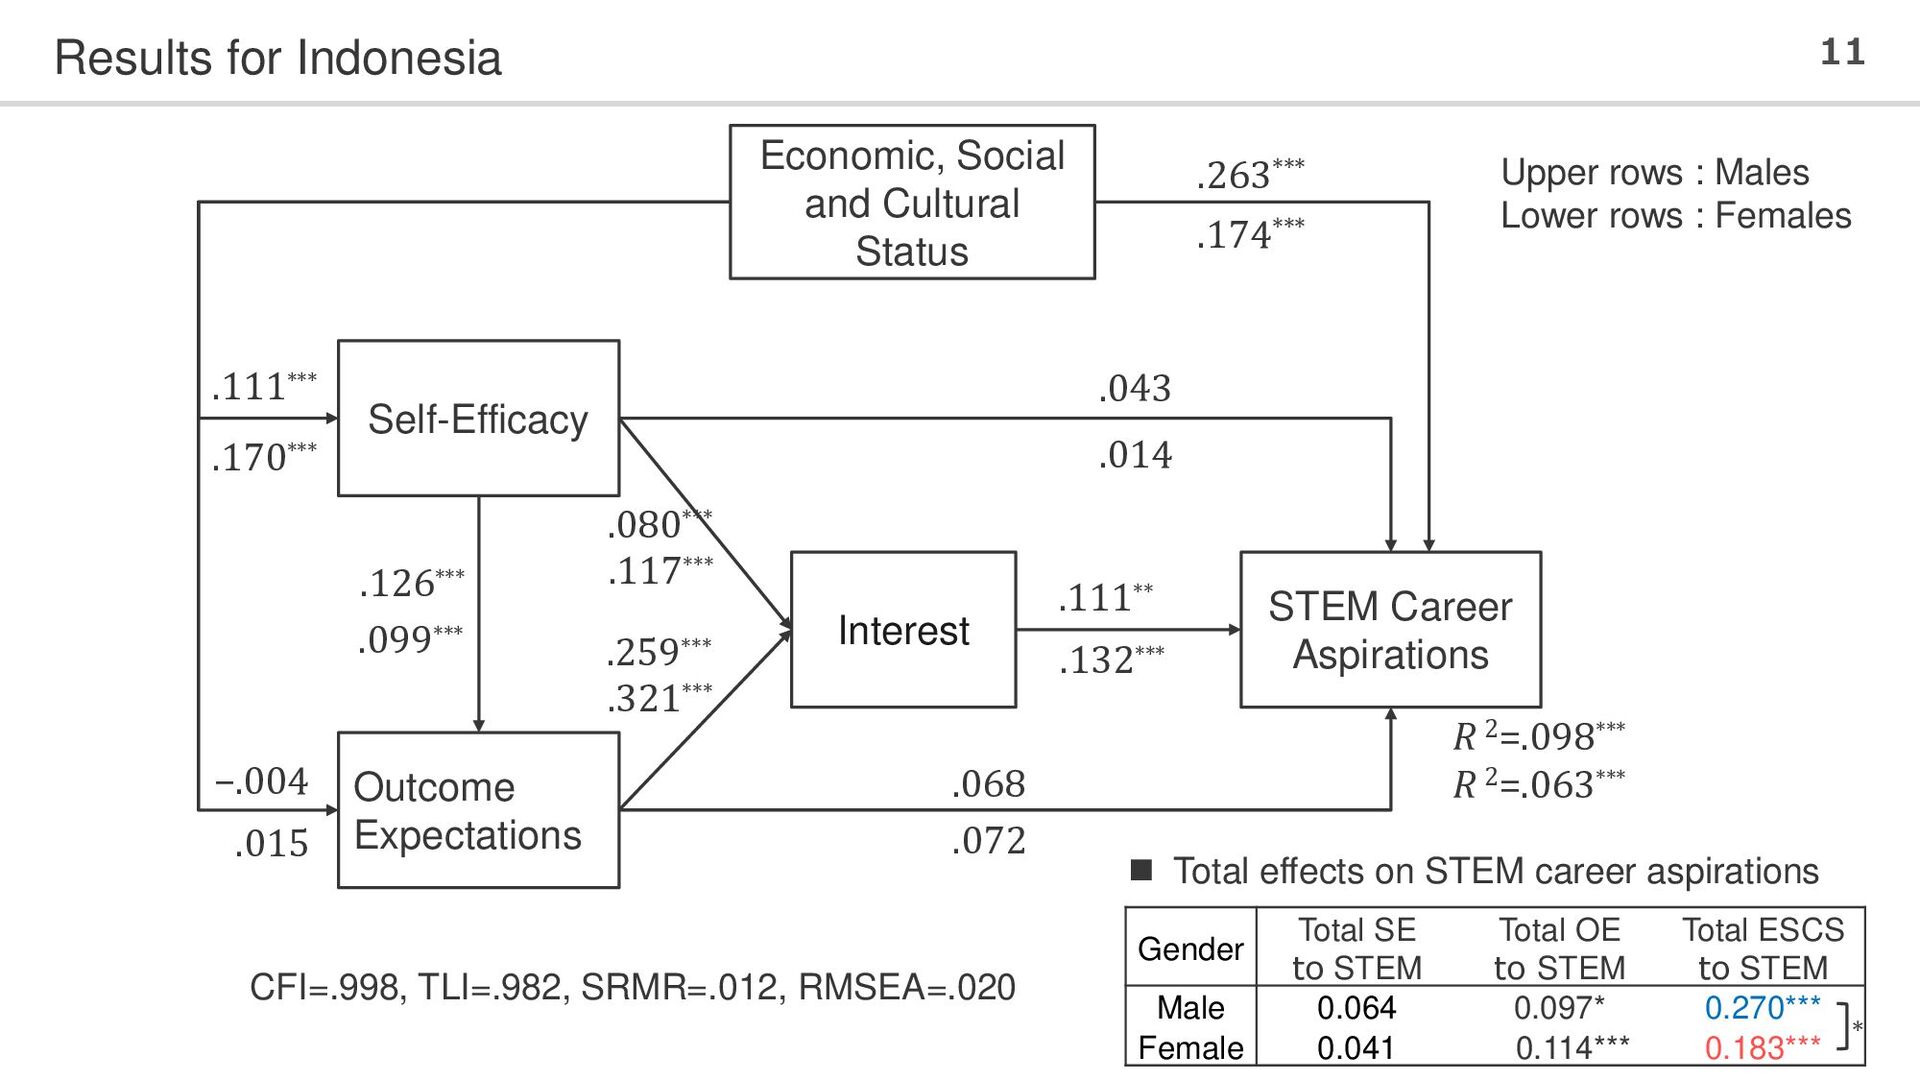
and Cultural Status STEM Career Aspirations .015 .263*** .111*** .259*** .080*** .068 .111** .043 .126*** .170*** .099*** −.004 .174*** .117*** .321*** .072 .132*** .014 R 2=.098*** R 2=.063*** Upper rows : Males Lower rows : Females Gender Total SE to STEM Total OE to STEM Total ESCS to STEM Male 0.064 0.097* 0.270*** Female 0.041 0.114*** 0.183*** CFI=.998, TLI=.982, SRMR=.012, RMSEA=.020 ◼ Total effects on STEM career aspirations *
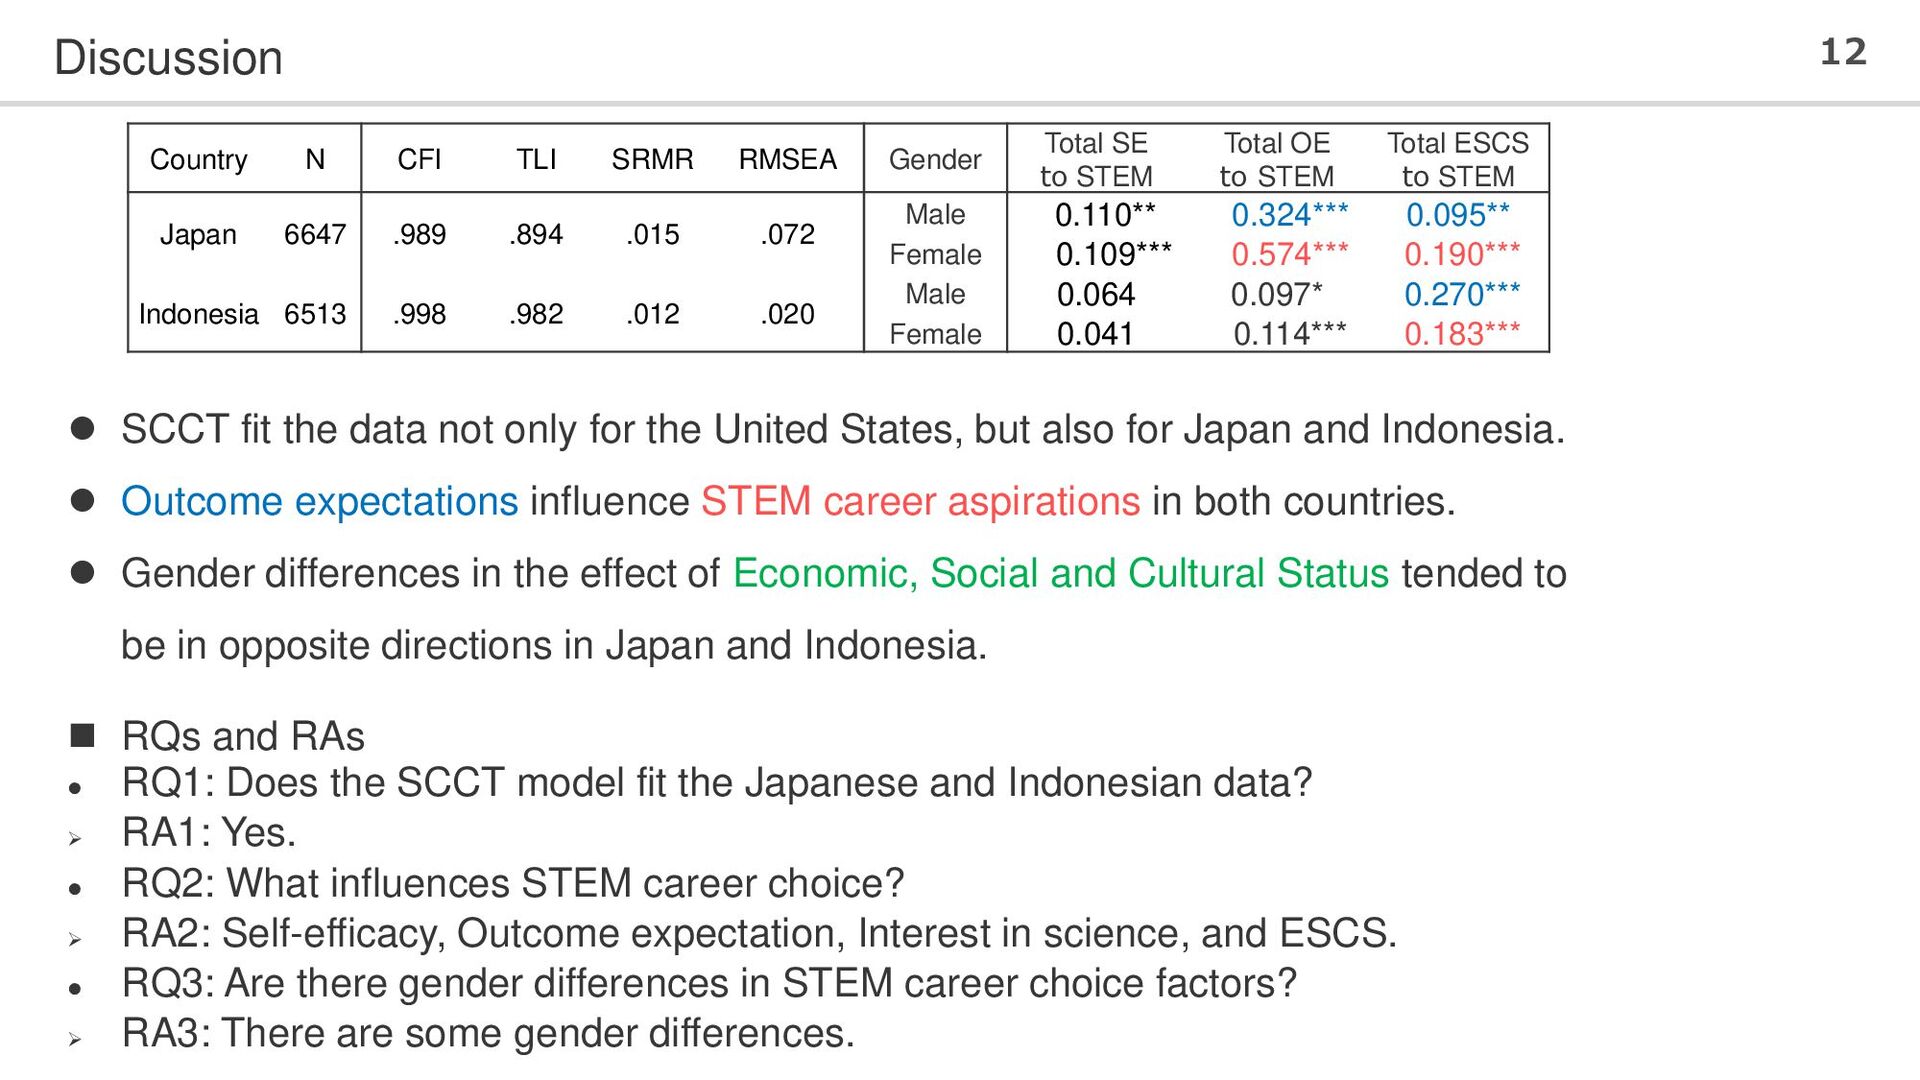
the United States, but also for Japan and Indonesia. ⚫ Outcome expectations influence STEM career aspirations in both countries. ⚫ Gender differences in the effect of Economic, Social and Cultural Status tended to be in opposite directions in Japan and Indonesia. Country N CFI TLI SRMR RMSEA Gender Total SE to STEM Total OE to STEM Total ESCS to STEM Japan 6647 .989 .894 .015 .072 Male 0.110** 0.324*** 0.095** Female 0.109*** 0.574*** 0.190*** Indonesia 6513 .998 .982 .012 .020 Male 0.064 0.097* 0.270*** Female 0.041 0.114*** 0.183*** ◼ RQs and RAs ⚫ RQ1: Does the SCCT model fit the Japanese and Indonesian data? ➢ RA1: Yes. ⚫ RQ2: What influences STEM career choice? ➢ RA2: Self-efficacy, Outcome expectation, Interest in science, and ESCS. ⚫ RQ3: Are there gender differences in STEM career choice factors? ➢ RA3: There are some gender differences.
Outcome expectations are an interventionable factor in SCCT career choice model and has a common positive effect in both countries. Interventions to improve outcome expectations may contribute to increasing the number students choosing STEM career. • Additionally, effective intervention methods for outcome expectations may differ between men and women, with the experience of achieving performance behaviors reported to be effective for male, and social and verbal persuasion from others effective for female (Zeldin et al., 2000, 2008). • Therefore, a series of interventions that provide achievement experiences through STEM-related experiential activities would be effective for males. Furthermore, given the positive effect on "interest," it is also important to provide interventions that increase interest in STEM fields. • For example, Koomen et al. (2021) conducted a science and engineering fair for middle and high school students as an intervention based on SCCT, in which participants gained experiences of achievement by conducting scientific investigations and presenting results.
For female, a series of interventions with persuasion and support from others, such as family, teachers, friends, and experts, is considered effective. • For example, in Japan, the Japan Science and Technology Agency (JST) sponsors the "Science Career Choice Support Program for Female Students“. It includes exchange programs and consultation sessions between researcher and female students. • Such interactions with experts in STEM fields can contribute to a positive perception of female choosing such careers.
study, the SCCT career choice model was examined using Japanese and Indonesian data from PISA 2015, to identify factors contributing to STEM career choice in both countries. • Quantitative analysis revealed that the SCCT career choice model fits well with data from Japanese and Indonesian students. • The results support the generalizability of the SCCT. It is expected that future analyses and interventions based on the SCCT will be conducted in Asia. • However, this study used data from a one-time survey of only first-year high school students; thus, it is not possible to discuss the medium- to long-term process of STEM career choice or the transformative potential of interventions. • Additionally, we were unable to examine whether the scales used to measure were the same constructs as those used in previous studies. • In the future, it will be necessary to conduct a longitudinal study to examine the validity of the measures and effectiveness of the career choice processes and interventions.
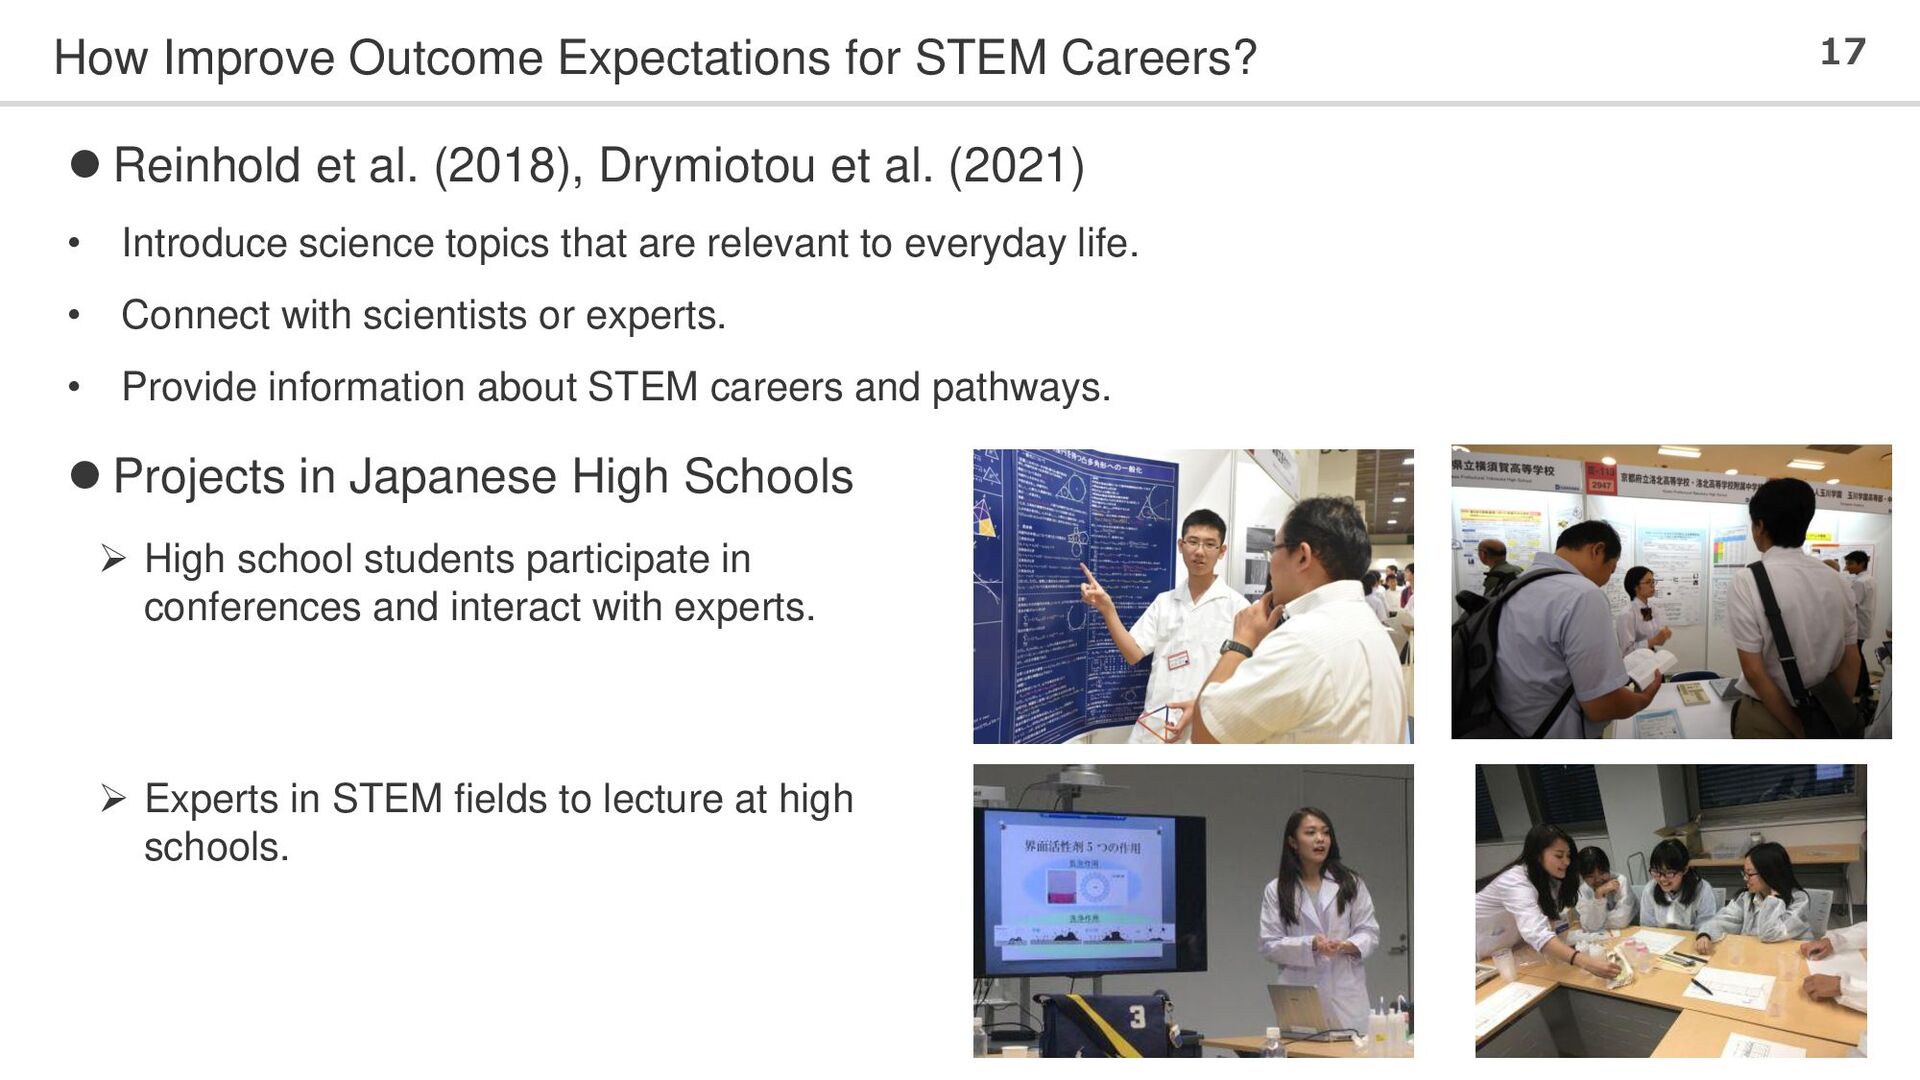
et al. (2018), Drymiotou et al. (2021) • Introduce science topics that are relevant to everyday life. • Connect with scientists or experts. • Provide information about STEM careers and pathways. ⚫ Projects in Japanese High Schools ➢ High school students participate in conferences and interact with experts. ➢ Experts in STEM fields to lecture at high schools.