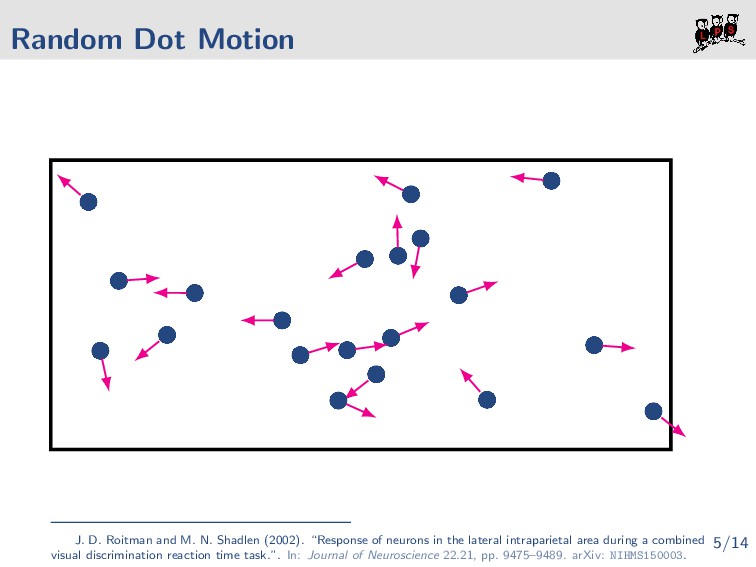
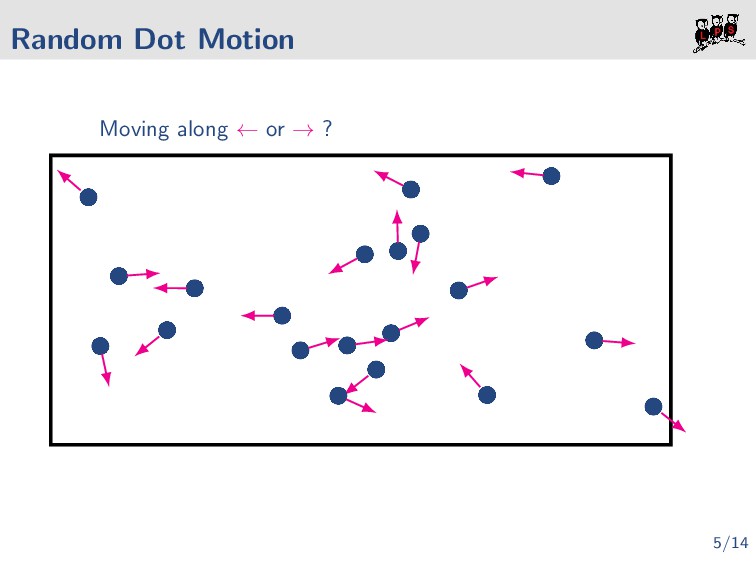
D. Roitman and M. N. Shadlen (2002). “Response of neurons in the lateral intraparietal area during a combined visual discrimination reaction time task.”. In: Journal of Neuroscience 22.21, pp. 9475–9489. arXiv: NIHMS150003. 5/14
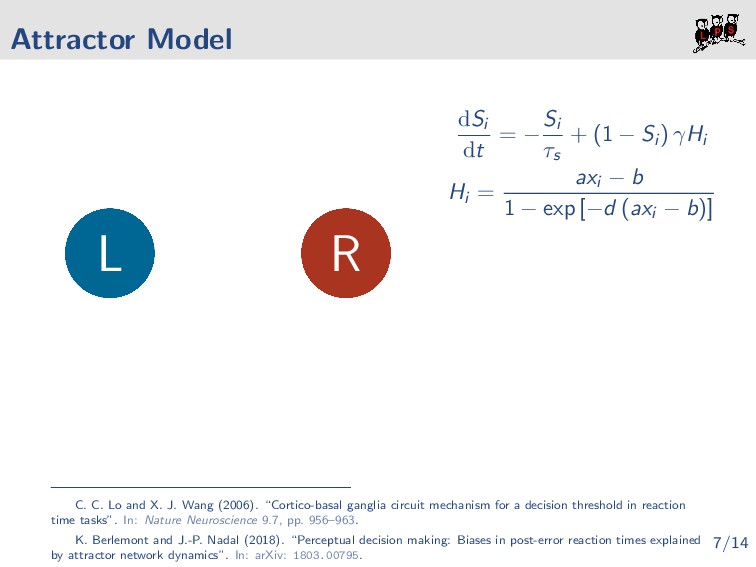
= − Si τs + (1 − Si ) γHi Hi = axi − b 1 − exp [−d (axi − b)] C. C. Lo and X. J. Wang (2006). “Cortico-basal ganglia circuit mechanism for a decision threshold in reaction time tasks”. In: Nature Neuroscience 9.7, pp. 956–963. K. Berlemont and J.-P. Nadal (2018). “Perceptual decision making: Biases in post-error reaction times explained by attractor network dynamics”. In: arXiv: 1803.00795. 7/14
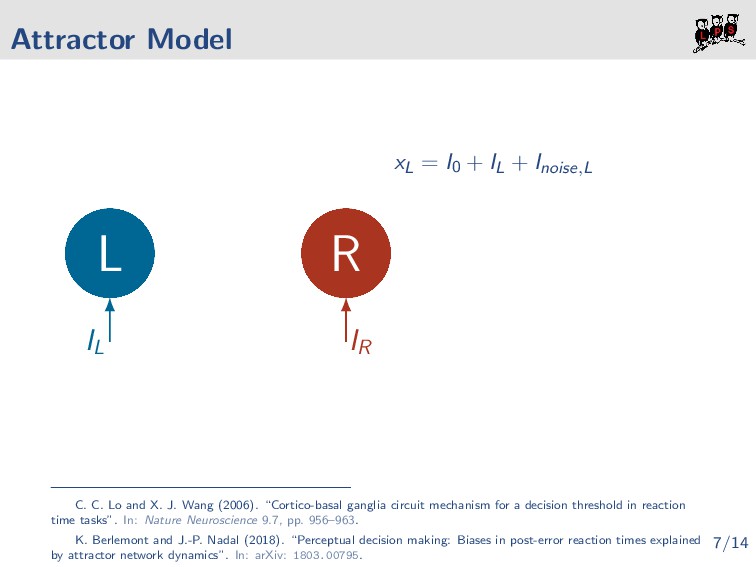
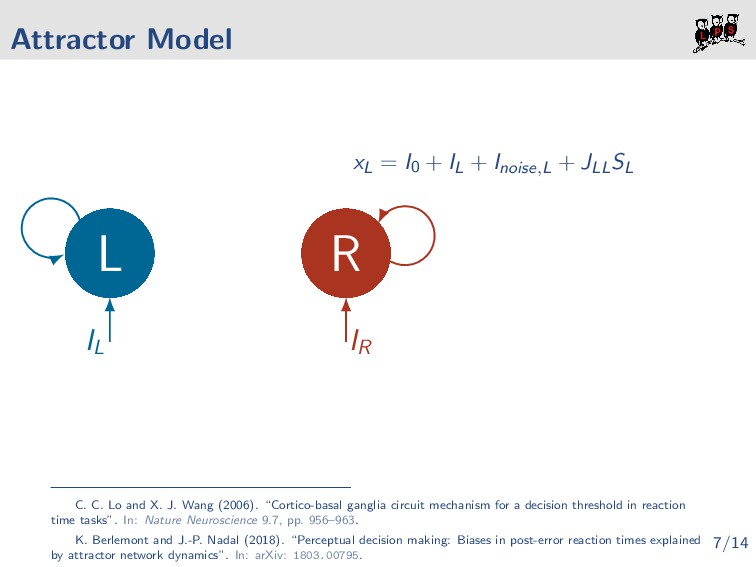
xL = I0 + IL + Inoise,L C. C. Lo and X. J. Wang (2006). “Cortico-basal ganglia circuit mechanism for a decision threshold in reaction time tasks”. In: Nature Neuroscience 9.7, pp. 956–963. K. Berlemont and J.-P. Nadal (2018). “Perceptual decision making: Biases in post-error reaction times explained by attractor network dynamics”. In: arXiv: 1803.00795. 7/14
xL = I0 + IL + Inoise,L + JLLSL C. C. Lo and X. J. Wang (2006). “Cortico-basal ganglia circuit mechanism for a decision threshold in reaction time tasks”. In: Nature Neuroscience 9.7, pp. 956–963. K. Berlemont and J.-P. Nadal (2018). “Perceptual decision making: Biases in post-error reaction times explained by attractor network dynamics”. In: arXiv: 1803.00795. 7/14
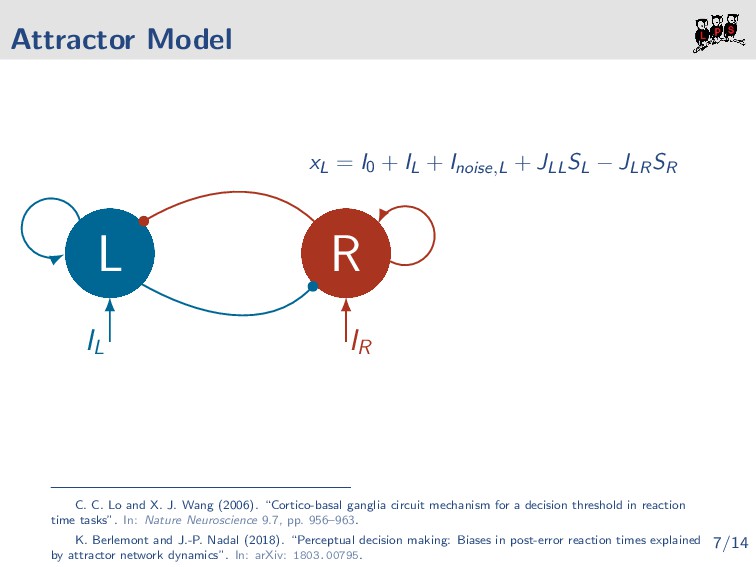
xL = I0 + IL + Inoise,L + JLLSL − JLRSR C. C. Lo and X. J. Wang (2006). “Cortico-basal ganglia circuit mechanism for a decision threshold in reaction time tasks”. In: Nature Neuroscience 9.7, pp. 956–963. K. Berlemont and J.-P. Nadal (2018). “Perceptual decision making: Biases in post-error reaction times explained by attractor network dynamics”. In: arXiv: 1803.00795. 7/14
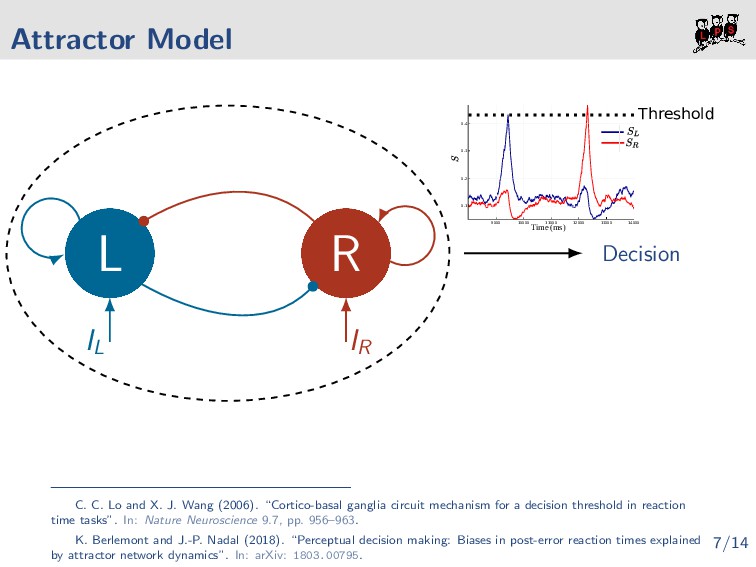
exp(−t/τCD) 9000 10000 11000 12000 13000 14000 0.1 0.2 0.3 0.4 Time (ms) Threshold C. C. Lo and X. J. Wang (2006). “Cortico-basal ganglia circuit mechanism for a decision threshold in reaction time tasks”. In: Nature Neuroscience 9.7, pp. 956–963. K. Berlemont and J.-P. Nadal (2018). “Perceptual decision making: Biases in post-error reaction times explained by attractor network dynamics”. In: arXiv: 1803.00795. 7/14
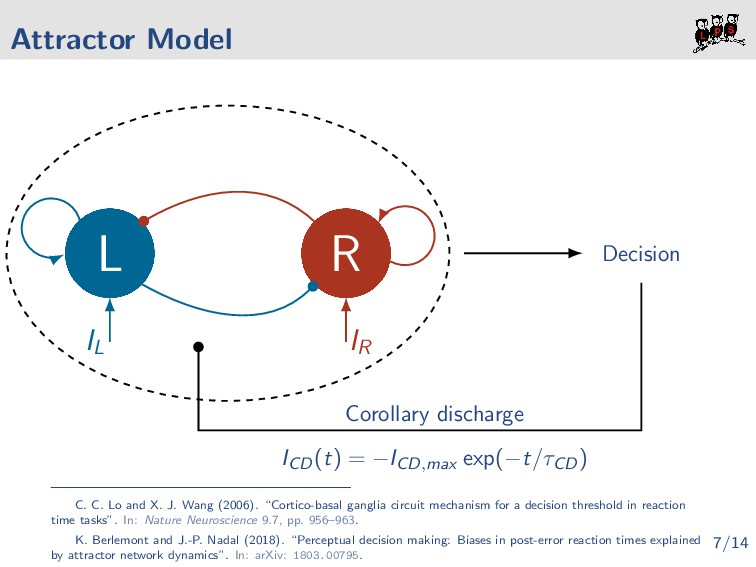
= −ICD,max exp(−t/τCD) C. C. Lo and X. J. Wang (2006). “Cortico-basal ganglia circuit mechanism for a decision threshold in reaction time tasks”. In: Nature Neuroscience 9.7, pp. 956–963. K. Berlemont and J.-P. Nadal (2018). “Perceptual decision making: Biases in post-error reaction times explained by attractor network dynamics”. In: arXiv: 1803.00795. 7/14
(2011). “Post-error adjustments”. In: Frontiers in Psychology 2.SEP, pp. 1–10. I. Jentzsch and C. Dudschig (2009). “Why do we slow down after an error? Mechanisms underlying the effects of posterror slowing”. In: Quarterly Journal of Experimental Psychology 62.2, pp. 209–218. 9/14
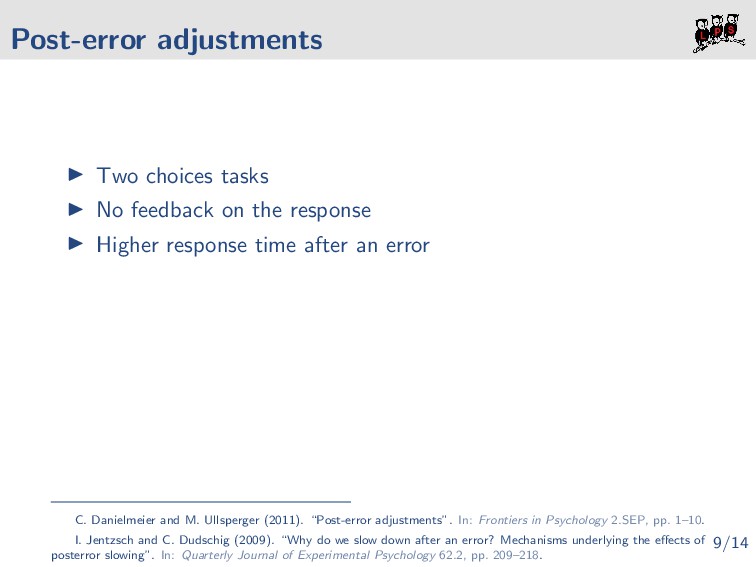
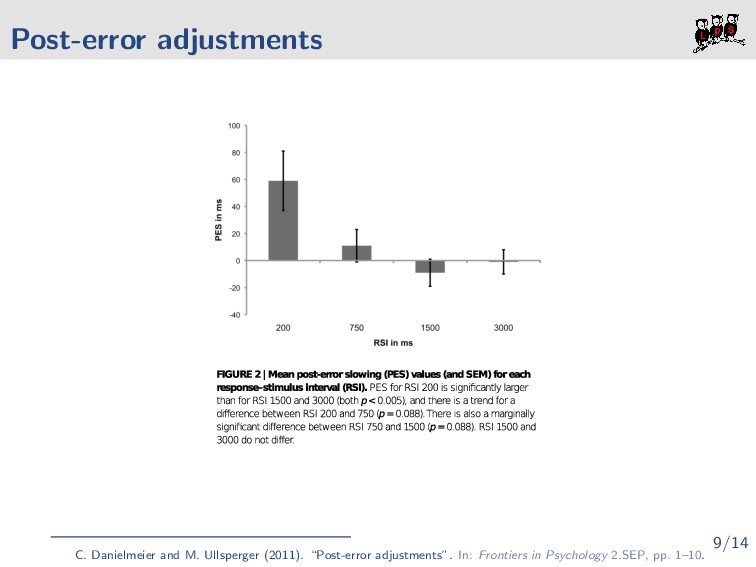
C. Danielmeier and M. Ullsperger (2011). “Post-error adjustments”. In: Frontiers in Psychology 2.SEP, pp. 1–10. I. Jentzsch and C. Dudschig (2009). “Why do we slow down after an error? Mechanisms underlying the effects of posterror slowing”. In: Quarterly Journal of Experimental Psychology 62.2, pp. 209–218. 9/14
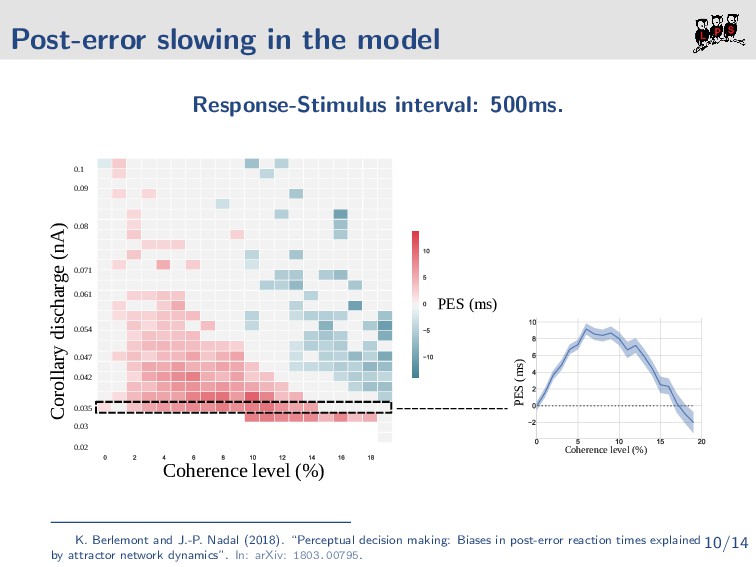
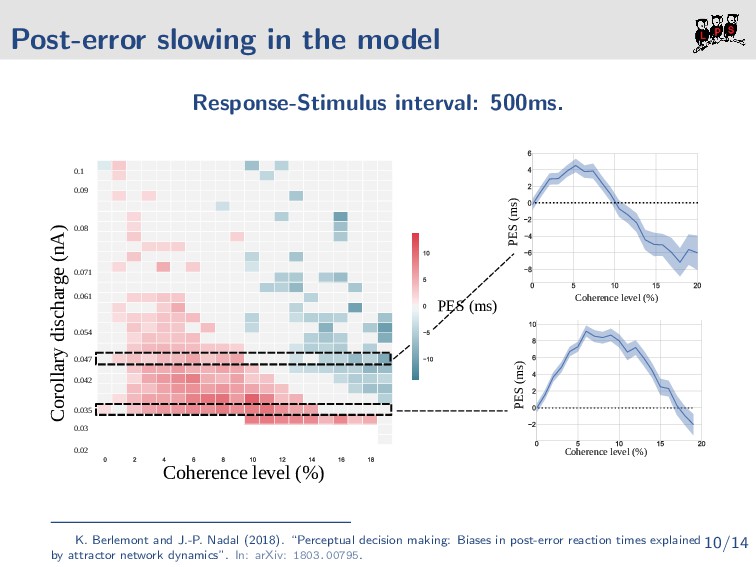
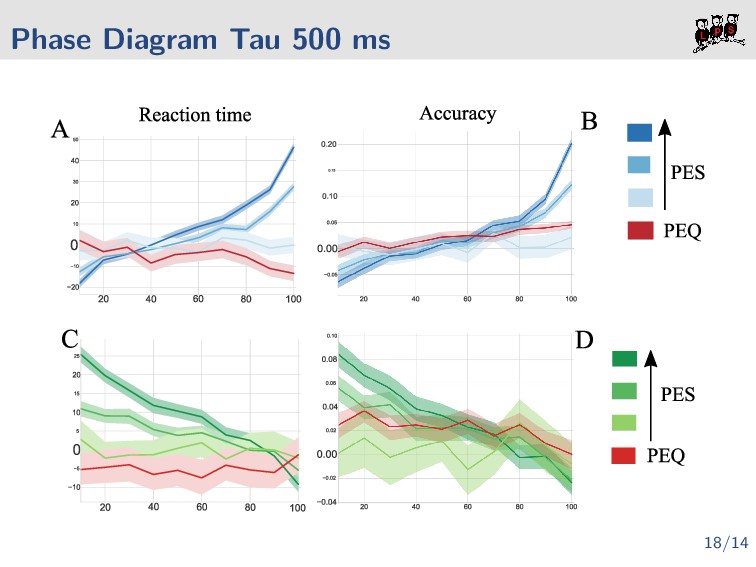
Higher response time after an error C. Danielmeier and M. Ullsperger (2011). “Post-error adjustments”. In: Frontiers in Psychology 2.SEP, pp. 1–10. I. Jentzsch and C. Dudschig (2009). “Why do we slow down after an error? Mechanisms underlying the effects of posterror slowing”. In: Quarterly Journal of Experimental Psychology 62.2, pp. 209–218. 9/14
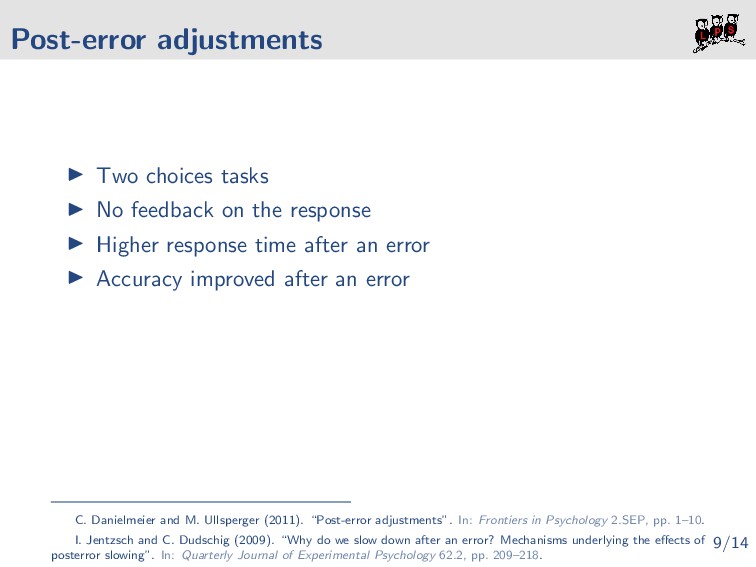
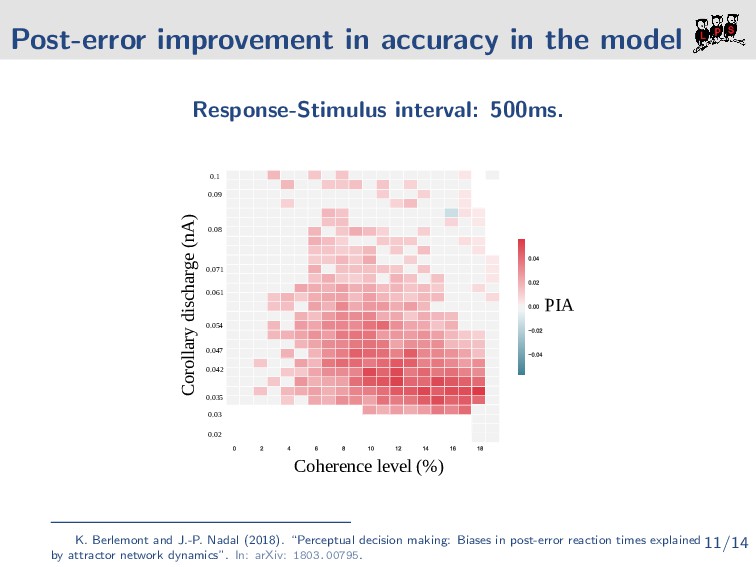
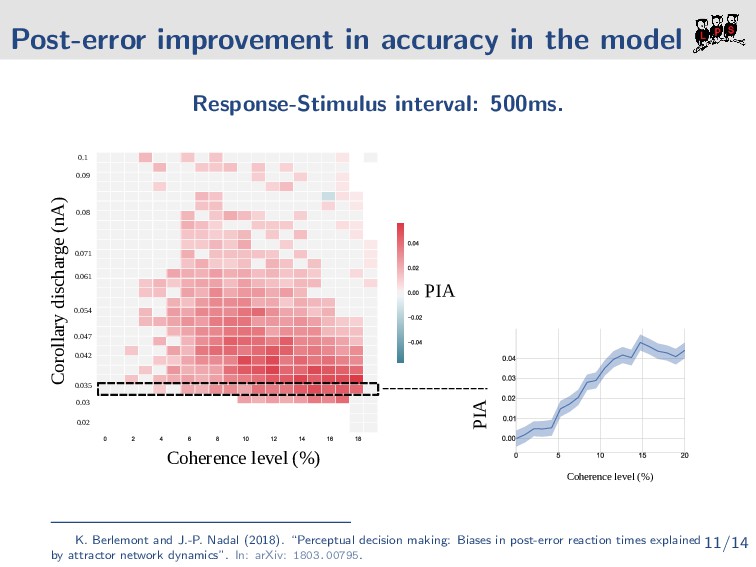
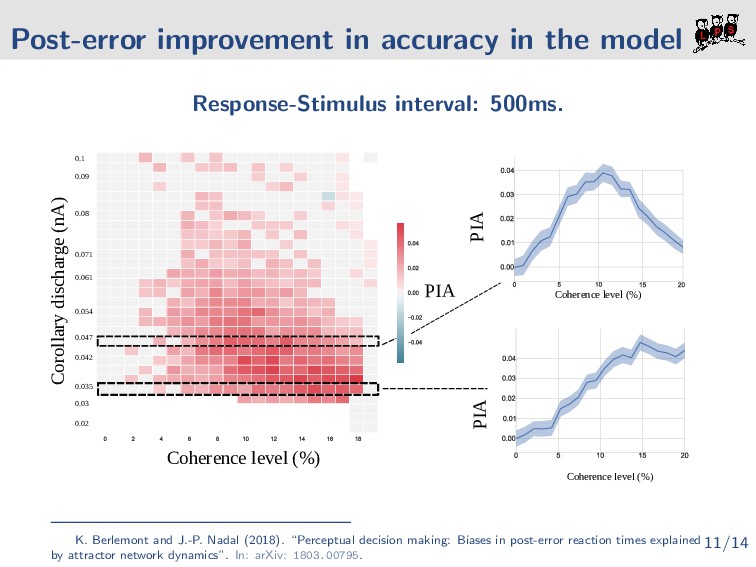
Higher response time after an error Accuracy improved after an error C. Danielmeier and M. Ullsperger (2011). “Post-error adjustments”. In: Frontiers in Psychology 2.SEP, pp. 1–10. I. Jentzsch and C. Dudschig (2009). “Why do we slow down after an error? Mechanisms underlying the effects of posterror slowing”. In: Quarterly Journal of Experimental Psychology 62.2, pp. 209–218. 9/14
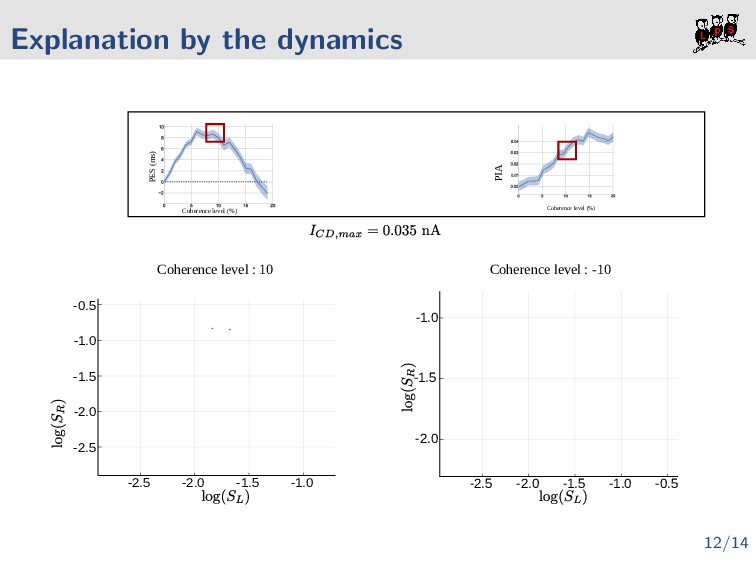
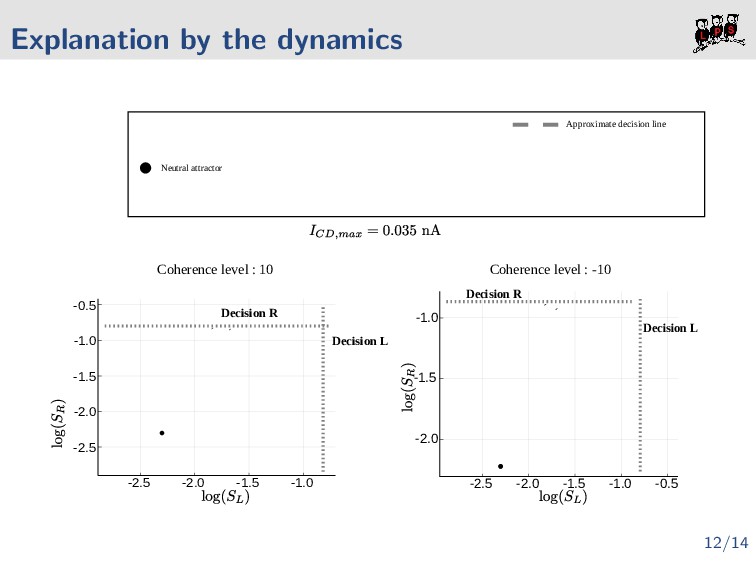
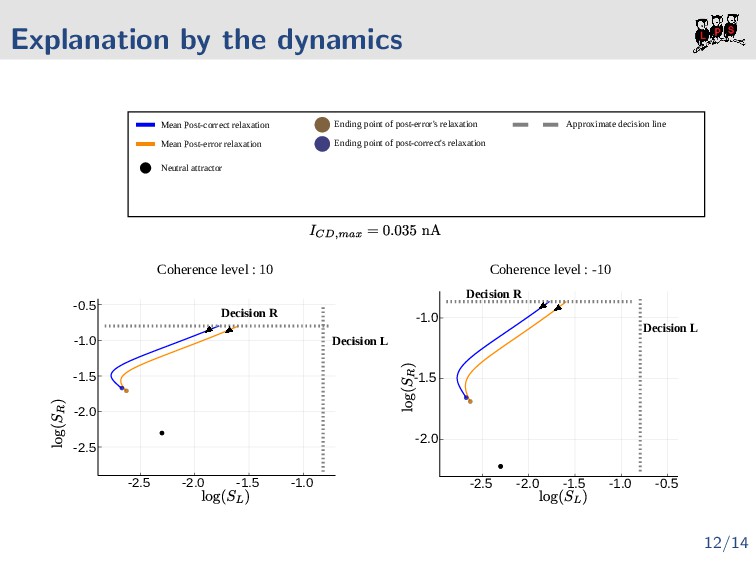
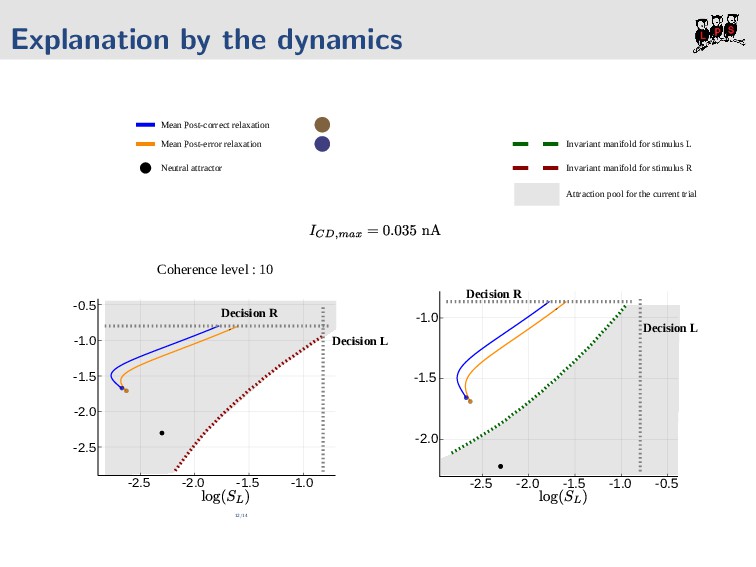
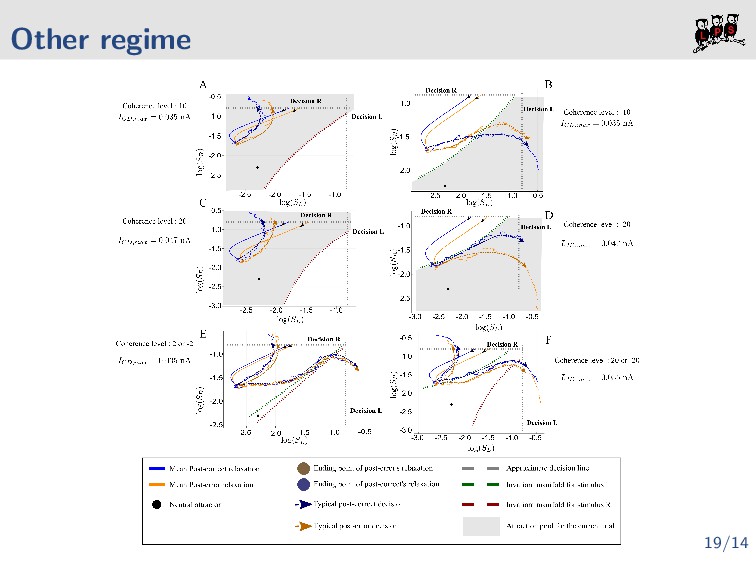
Neutral attractor -2.5 -2.0 -1.5 -1.0 -0.5 -1.5 Decision L Decision R -1.0 -2.0 -2.5 -2.0 -1.5 -1.0 -2.5 -2.0 -1.5 -1.0 -0.5 Decision L Decision R Invariant manifold for stimulus L Invariant manifold for stimulus R Attraction pool for the current trial Coherence level : 10 Approximate decision line Ending point of post-error's relaxation Ending point of post-correct's relaxation Coherence level : -10 12/14
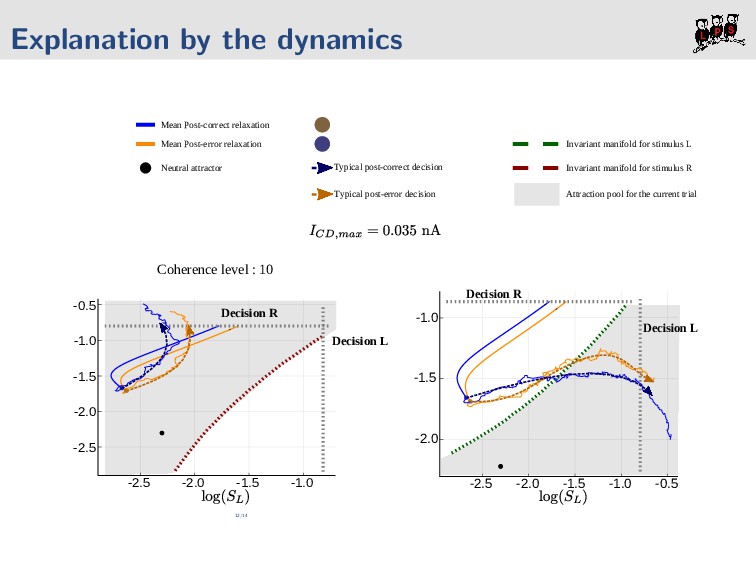
Neutral attractor -2.5 -2.0 -1.5 -1.0 -0.5 -1.5 Decision L Decision R -1.0 -2.0 -2.5 -2.0 -1.5 -1.0 -2.5 -2.0 -1.5 -1.0 -0.5 Decision L Decision R Typical post-correct decision Typical post-error decision Invariant manifold for stimulus L Invariant manifold for stimulus R Attraction pool for the current trial Coherence level : 10 Approximate decision line Ending point of post-error's relaxation Ending point of post-correct's relaxation Coherence level : -10 12/14
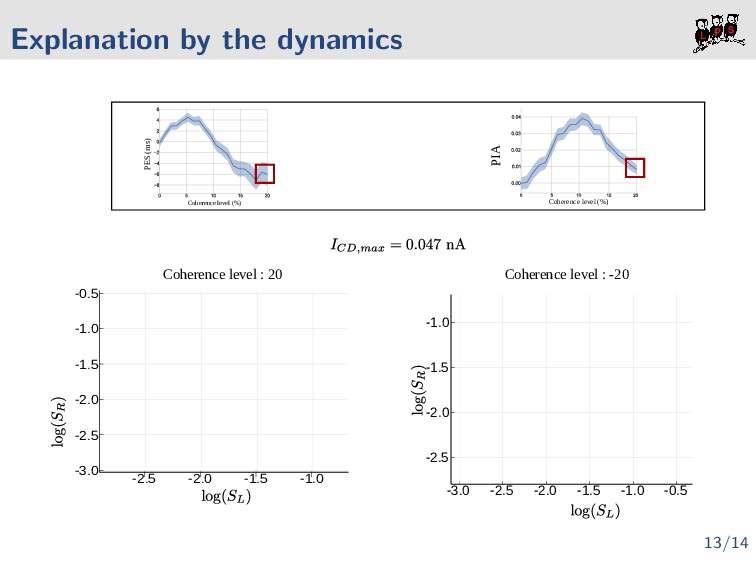
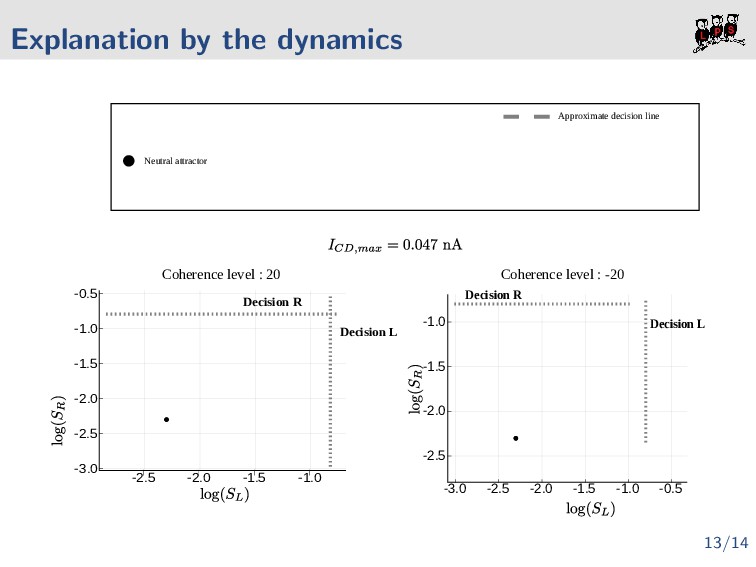
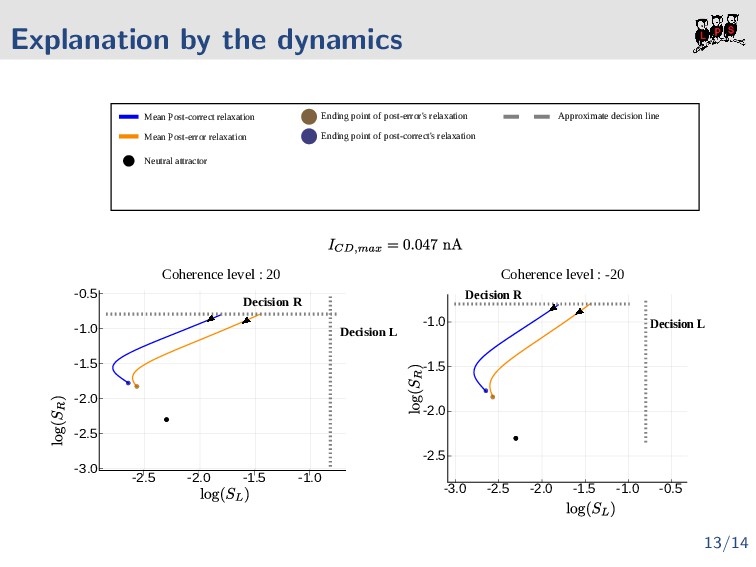
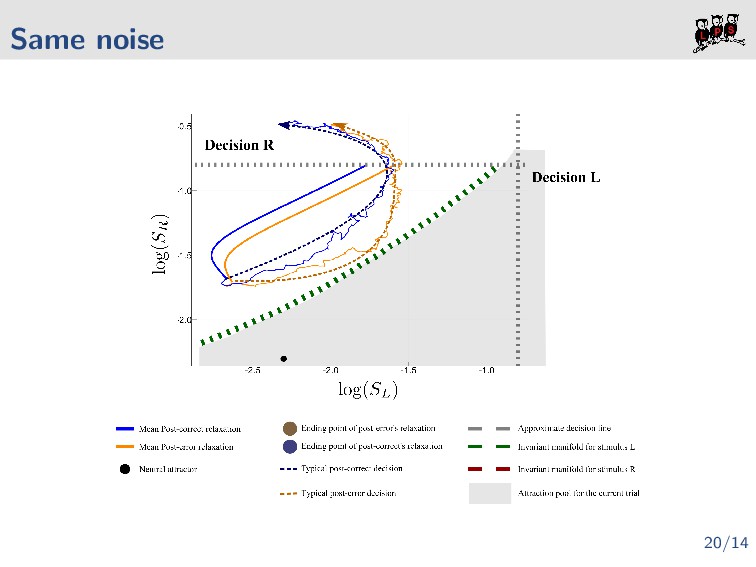
-2.5 -2.0 -1.5 -1.0 Decision L Decision R -2.5 -2.0 -1.5 -1.0 -3.0 -2.5 -2.0 -1.5 -1.0 -0.5 Decision L Decision R Coherence level : 20 Coherence level : -20 Mean Post-correct relaxation Mean Post-error relaxation Neutral attractor Approximate decision line Ending point of post-error's relaxation Ending point of post-correct's relaxation 13/14
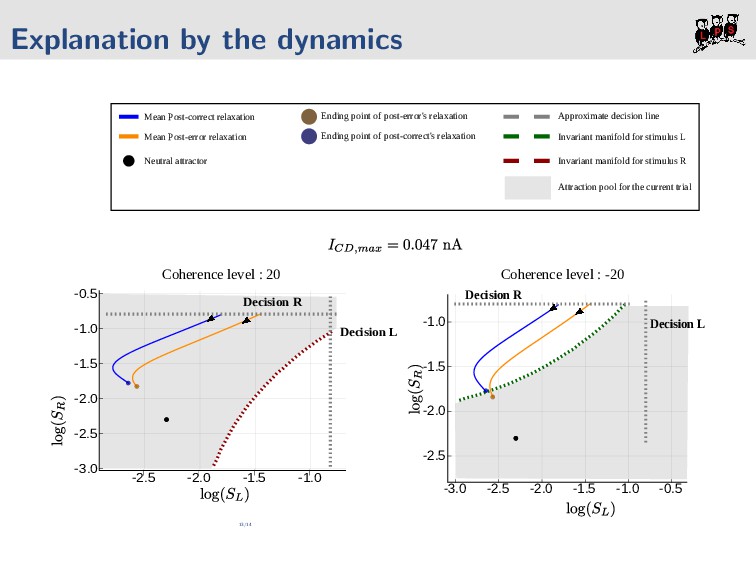
-2.5 -2.0 -1.5 -1.0 Decision L Decision R -2.5 -2.0 -1.5 -1.0 -3.0 -2.5 -2.0 -1.5 -1.0 -0.5 Decision L Decision R Coherence level : 20 Coherence level : -20 Mean Post-correct relaxation Mean Post-error relaxation Neutral attractor Invariant manifold for stimulus L Invariant manifold for stimulus R Attraction pool for the current trial Approximate decision line Ending point of post-error's relaxation Ending point of post-correct's relaxation 13/14
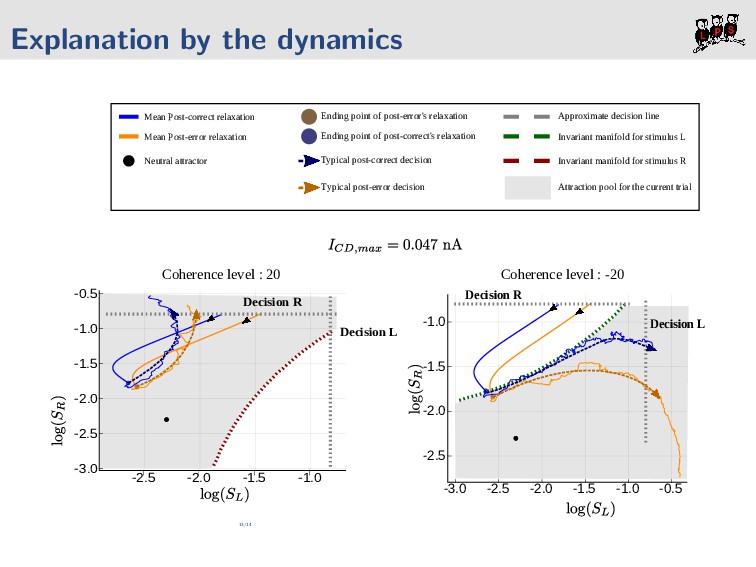
-2.5 -2.0 -1.5 -1.0 Decision L Decision R -2.5 -2.0 -1.5 -1.0 -3.0 -2.5 -2.0 -1.5 -1.0 -0.5 Decision L Decision R Coherence level : 20 Coherence level : -20 Mean Post-correct relaxation Mean Post-error relaxation Neutral attractor Typical post-correct decision Typical post-error decision Invariant manifold for stimulus L Invariant manifold for stimulus R Attraction pool for the current trial Approximate decision line Ending point of post-error's relaxation Ending point of post-correct's relaxation 13/14