Upgrade to Pro — share decks privately, control downloads, hide ads and more …

GrimoireCon North America 2017. Session 1: Introduction to Bitergia Analytics Dashboard and Platform.

GrimoireCon North America 2017. Session 1: Introduction to Bitergia Analytics Dashboard and Platform.

GrimoireCon North America 2017. Session 1: Introduction to Bitergia Analytics Dashboard and Platform.

Bitergia

May 08, 2017
Tweet

More Decks by Bitergia

Other Decks in Technology

Transcript

  1. Outline: use cases Eclipse: https://eclipse.biterg.io GlusterFS: https://glusterfs.biterg.io OPNFV: https://opnfv.bitergi.io PatternFly:

    https://patternfly.biterg.io CNCF: https://cncf.biterg.io Atomic: https://aotmic.biterg.io CoreOS: https://coreos.biterg.io OpenShift: https://openshift.biterg.io Ovirt: https://ovirt.biterg.io Xen: https://xen.biterg.io Puppet: https://puppet.biterg.io Ceph: https://ceph.biterg.io RDO: https://rdo.biterg.io Wikimedia: https://wikimedia.biterg.io
  2. Git

  3. Architecture Original Data Sources Mining Tools Perceval @ GrimoireLab Info

    Enrich. GrimoireELK @ GrimoireLab Viz ElasticSearch + Kibana Others
  4. Some Features Drill down Time frame selection Sharing / embedding

    Data export (CSV…) API access (ElasticSearch API) Allowed users can create widgets and panels Easier validation Search box
  5. Drill Down Any widget is interactive When clicked, the panel

    is updated and all widgets are filtered
  6. Drill Down (Filters) When drilling down, a filter appears (field:value)

    Mouse over: Enable/disable, pin/unpin, invert, remove, edit
  7. Sharing / Embedding We can share / embed panels at

    any moment Eg: share with a team the data for a given repository during the last year
  8. Easier Validation Since we can filter activity: - We can

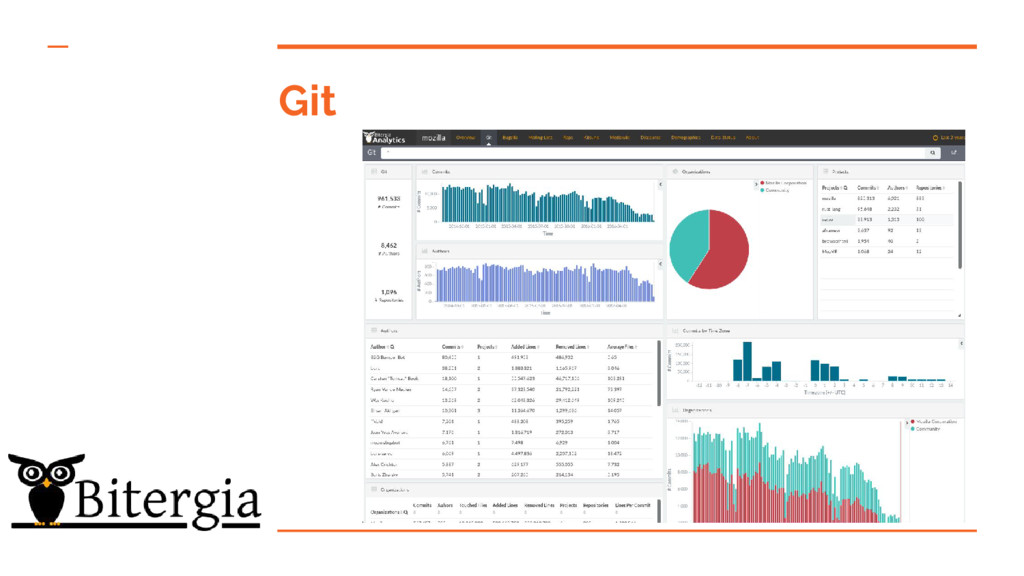
    work at the level of developer or repository - This helps to find inconsistencies in the data - List of commits, changesets, repositories by a developer - Affiliations, unique identities - Checking of oddities in the data, such as peaks
  9. Search Box General search box for filtering purposes: - Look

    for specific field matches: - author_name:”Juan Hernandez” - Look for keywords: - Juan Hernandez => Either Juan or Hernandez across all fields
  10. Aggregation of Data Since Kibana allows for new features -

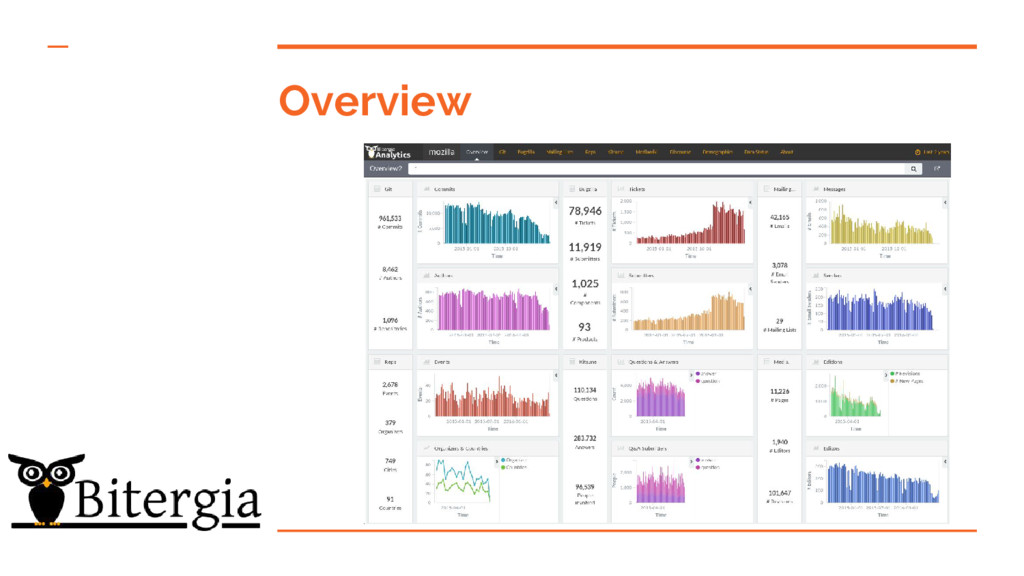
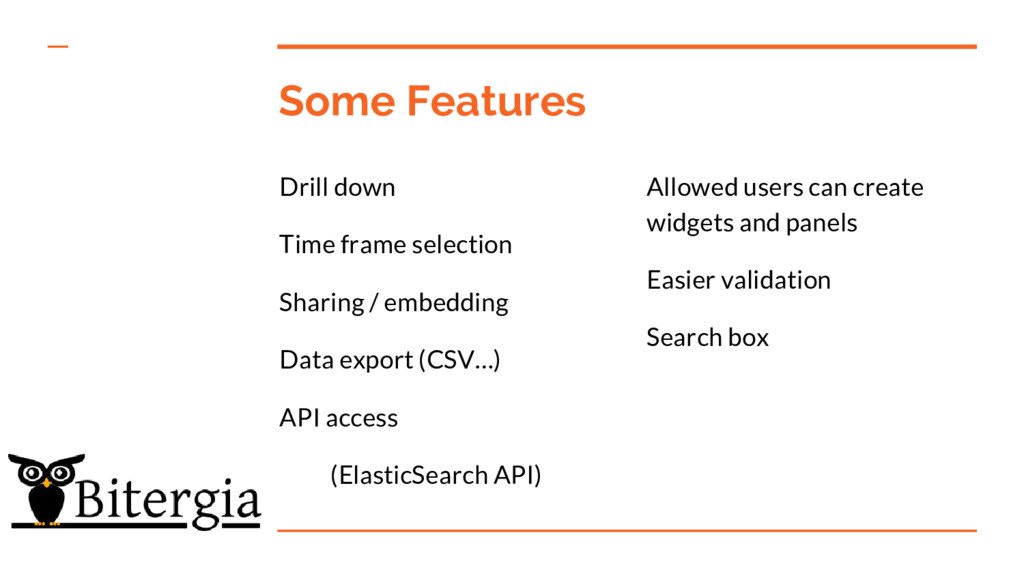
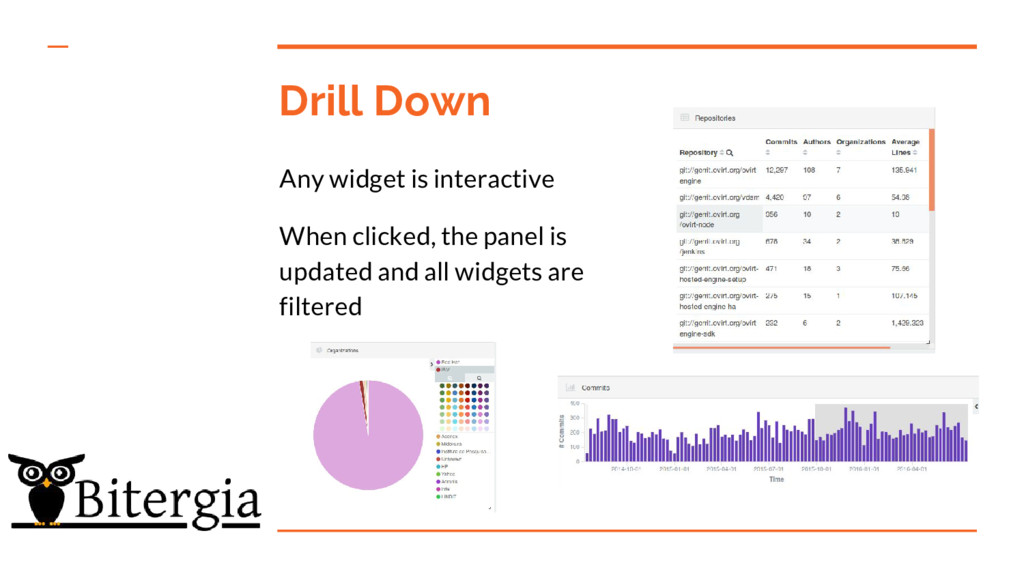
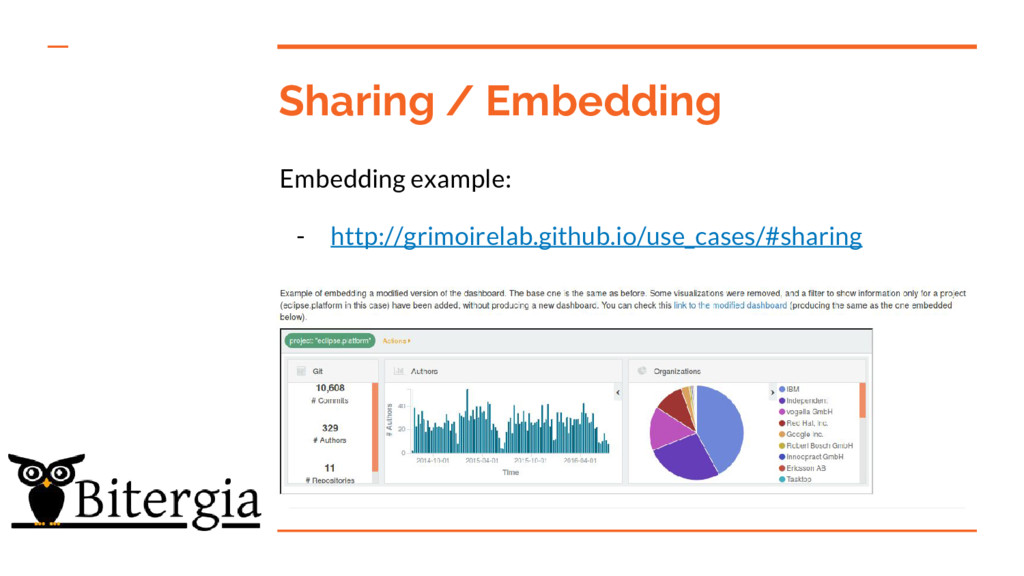
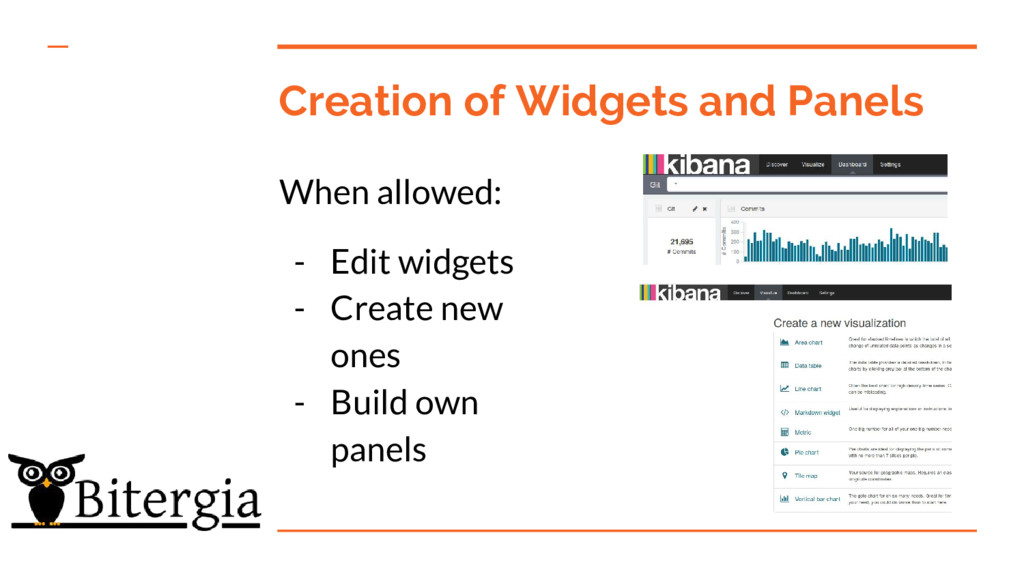
    drill down, timeframe filter, creation of own widgets and others We can aggregate all information in a single dashboard - So we can later share or filter per project of interest
  11. Indexes - Indexes are the magic under Kibana - Those

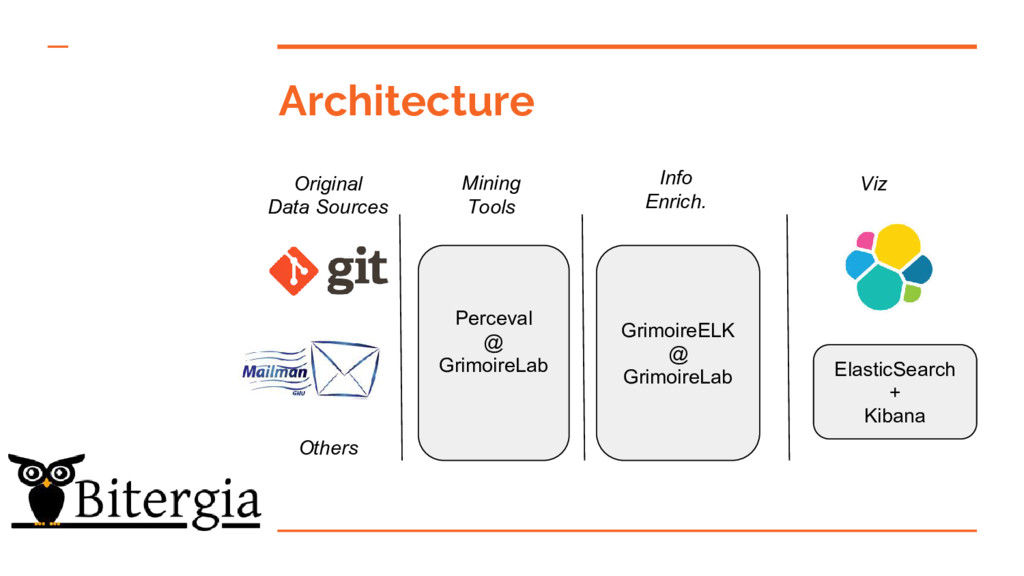
    are enriched - Think of them as big matrixes of information - Each column represents a entity - You can keep adding entities to your analysis - Gender, Organization, Domain, others
  12. Final remarks We’re still shaping the product: you can take

    advantage of that The system is quite flexible Feedback is welcome!