Upgrade to Pro — share decks privately, control downloads, hide ads and more …

AAGW3 - Zhe Guo - Spatial modeling, analysis and its applications in IFPRI

CGIAR-CSI
March 21, 2013

AAGW3 - Zhe Guo - Spatial modeling, analysis and its applications in IFPRI

CGIAR-CSI

March 21, 2013
Tweet

More Decks by CGIAR-CSI

Other Decks in Research

Transcript

  1. Spatial modeling, analysis and its applications in IFPRI Zhe Guo

    ([email protected]) Africa Agriculture GIS Week 2013(AAGW3) March 11-March 16, 2013
  2. Overview  Spatial price modeling  Mapping crop calendar 

    Trends and spatial patterns of Ag. Productivity  Spatial production allocation model (SPAM)  Poverty mapping  Mapping livestock from household and census data 2  Arabic spatial  Modeling Farmers’ Agricultural Knowledge Spillover  The Economics of Land Degradation: A Way Forward for An Action-Oriented Global Economic Assessment
  3. Overview  Spatial price modeling  Mapping crop calendar 

    Trends and spatial patterns of Ag. Productivity  Spatial production allocation model (SPAM)  Poverty mapping  Mapping livestock from household and census data 3  Arabic spatial  Modeling Farmers’ Agricultural Knowledge Spillover  The Economics of Land Degradation: A Way Forward for An Action-Oriented Global Economic Assessment
  4. Fertilizer policy options in East Africa When developing its regional

    fertilizer strategy, AGRA requested an assessment of the impacts of three strategies on local fertilizer prices: 1. Reducing the landed cost of fertilizer through collective bulk purchasing by Eastern and Southern Africa countries. 2. Reducing transport costs through improved road and related transportation infrastructure and transport fleet. 3. Reduced transactions costs through improved harmonization and streamlining of border crossing/customs procedures.
  5. Methodology/Data Development 1. Capture Heterogeneity of Location-Specific Effects over a

    Large Geographic Region. Recognizing that adoption is driven by local realities, such as the effective farmgate prices of inputs and outputs, and site-specific impacts of technologies. 2. Regional Application of a Site-Specific Crop Yield Model (DSSAT) driven by location-specifc estimates of weather, soils and crop management. 3. Collection and analysis of regional transport and market prices (on-going for SSA)
  6. Dual Carriageway Single Carriageway Port Farm Off-road Farmgate Fertilizer Price?

    Pfert, farm = Pfert, port + Build-up costs (Handling + “Barriers” + Transport Costs) Farmgate Fertilizer Price: Pfert, farm Pfert, port Seasonal Road X National Border Assessing Farm-gate Prices: 1. Imported Inputs
  7.  Core is a transport cost model  Input parameters

    can include spatial and non spatial data  Involves simulating every transportation path option from starting point to the end point.  The model first identifies all possible paths from the starting point to the end point.  The model calculates the cost of all possible pathways  Only the least cost path is selected
  8. Dual Carriageway Single Carriageway Port Farm Maize Market Off-road Farmgate

    Fertilizer Price? Farmgate Maize Price? Pfert, farm = Pfert, port + Build-up costs (Handling + “Barriers” + Transport Costs) Farmgate Fertilizer Price: Pfert, farm Pfert, port Farmgate Maize Price Pmaize, farm = Pmaize,market - Transport Costs Pmaize, farm Pmaize,market Seasonal Road X National Border Assessing Farmgate Prices: 2. Output Surplus to Local Markets
  9. 10 IFPRI HPC (80 CPU’s) MANAGEMENT • Planting window •

    Irrigation • Inorganic fertilizer • Organic manure • Tillage • Residue CULTIVAR • Phenology • Max # of kernels • Kernel filling rate *DSSAT Cropping System Model Ver. 4.0.2.000 May 21, 2009; 16:32:33 *RUN 1 : RAINFED LOW NITROGEN MODEL : MZCER040 - MAIZE EXPERIMENT : UFGA8201 MZ NIT X IRR, GAINESVILLE 2N*3I TREATMENT 1 : RAINFED LOW NITROGEN CROP : MAIZE CULTIVAR : McCurdy 84aa ECOTYPE :IB0002 STARTING DATE : FEB 25 1982 PLANTING DATE : FEB 26 1982 PLANTS/m2 : 7.2 ROW SPACING : 61.cm WEATHER : UFGA 1982 SOIL : IBMZ910014 TEXTURE : - Millhopper Fine Sand SOIL INITIAL C : DEPTH:180cm EXTR. H2O:160.9mm NO3: 2.5kg/ha NH4: 12.9kg/ha WATER BALANCE : IRRIGATE ON REPORTED DATE(S) IRRIGATION : 13 mm IN 1 APPLICATIONS NITROGEN BAL. : SOIL-N & N-UPTAKE SIMULATION; NO N-FIXATION N-FERTILIZER : 116 kg/ha IN 3 APPLICATIONS RESIDUE/MANURE : INITIAL : 1000 kg/ha ; 0 kg/ha IN 0 APPLICATIONS ENVIRONM. OPT. : DAYL= 0.00 SRAD= 0.00 TMAX= 0.00 TMIN= 0.00 RAIN= 0.00 CO2 = R330.00 DEW = 0.00 WIND= 0.00 SIMULATION OPT : WATER :Y NITROGEN:Y N-FIX:N PHOSPH :N PESTS :N PHOTO :C ET :R INFIL:S HYDROL :R SOM :G MANAGEMENT OPT : PLANTING:R IRRIG :R FERT :R RESIDUE:N HARVEST:M WTH:M *SUMMARY OF SOIL AND GENETIC INPUT PARAMETERS SOIL LOWER UPPER SAT EXTR INIT ROOT BULK pH NO3 NH4 ORG DEPTH LIMIT LIMIT SW SW SW DIST DENS C cm cm3/cm3 cm3/cm3 cm3/cm3 g/cm3 ugN/g ugN/g % ------------------------------------------------------------------------------- 0- 5 0.026 0.096 0.230 0.070 0.086 1.00 1.30 7.00 0.10 0.50 2.00 5- 15 0.025 0.086 0.230 0.061 0.086 1.00 1.30 7.00 0.10 0.50 1.00 15- 30 0.025 0.086 0.230 0.061 0.086 0.70 1.40 7.00 0.10 0.50 1.00 30- 45 0.025 0.086 0.230 0.061 0.086 0.30 1.40 7.00 0.10 0.50 0.50 45- 60 0.025 0.086 0.230 0.061 0.086 0.30 1.40 7.00 0.10 0.50 0.50 60- 90 0.028 0.090 0.230 0.062 0.076 0.05 1.45 7.00 0.10 0.60 0.10 90-120 0.028 0.090 0.230 0.062 0.076 0.03 1.45 7.00 0.10 0.50 0.10 120-150 0.029 0.130 0.230 0.101 0.130 0.00 1.45 7.00 0.10 0.50 0.04 150-180 0.070 0.258 0.360 0.188 0.258 0.00 1.20 7.00 0.10 0.50 0.24 TOT-180 6.2 22.2 45.3 16.1 21.4 <--cm - kg/ha--> 2.5 12.9 87080 SOIL ALBEDO : 0.18 EVAPORATION LIMIT : 2.00 MIN. FACTOR : 1.00 RUNOFF CURVE # :60.00 DRAINAGE RATE : 0.65 FERT. FACTOR : 0.80 MAIZE CULTIVAR :IB0035-McCurdy 84aa ECOTYPE :IB0002 P1 : 265.00 P2 : 0.3000 P5 : 920.00 G2 : 990.00 G3 : 8.500 PHINT : 39.000 *SIMULATED CROP AND SOIL STATUS AT MAIN DEVELOPMENT STAGES RUN NO. 1 RAINFED LOW NITROGEN CROP GROWTH BIOMASS CROP N STRESS DATE AGE STAGE kg/ha LAI kg/ha % H2O N ------ --- ---------- ----- ----- --- --- ---- ---- 25 FEB 0 Start Sim 0 0.00 0 0.0 0.00 0.00 26 FEB 0 Sowing 0 0.00 0 0.0 0.00 0.00 27 FEB 1 Germinate 0 0.00 0 0.0 0.00 0.00 9 MAR 11 Emergence 29 0.00 1 4.4 0.00 0.00 27 MAR 29 End Juveni 251 0.43 4 1.6 0.00 0.09 1 APR 34 Floral Ini 304 0.44 4 1.5 0.00 0.50 *DSSAT Cropping System Model Ver. 4.0.2.000 May 21, 2009; 16:32:33 *RUN 1 : RAINFED LOW NITROGEN MODEL : MZCER040 - MAIZE EXPERIMENT : UFGA8201 MZ NIT X IRR, GAINESVILLE 2N*3I TREATMENT 1 : RAINFED LOW NITROGEN CROP : MAIZE CULTIVAR : McCurdy 84aa ECOTYPE :IB0002 STARTING DATE : FEB 25 1982 PLANTING DATE : FEB 26 1982 PLANTS/m2 : 7.2 ROW SPACING : 61.cm WEATHER : UFGA 1982 SOIL : IBMZ910014 TEXTURE : - Millhopper Fine Sand SOIL INITIAL C : DEPTH:180cm EXTR. H2O:160.9mm NO3: 2.5kg/ha NH4: 12.9kg/ha WATER BALANCE : IRRIGATE ON REPORTED DATE(S) IRRIGATION : 13 mm IN 1 APPLICATIONS NITROGEN BAL. : SOIL-N & N-UPTAKE SIMULATION; NO N-FIXATION N-FERTILIZER : 116 kg/ha IN 3 APPLICATIONS RESIDUE/MANURE : INITIAL : 1000 kg/ha ; 0 kg/ha IN 0 APPLICATIONS ENVIRONM. OPT. : DAYL= 0.00 SRAD= 0.00 TMAX= 0.00 TMIN= 0.00 RAIN= 0.00 CO2 = R330.00 DEW = 0.00 WIND= 0.00 SIMULATION OPT : WATER :Y NITROGEN:Y N-FIX:N PHOSPH :N PESTS :N PHOTO :C ET :R INFIL:S HYDROL :R SOM :G MANAGEMENT OPT : PLANTING:R IRRIG :R FERT :R RESIDUE:N HARVEST:M WTH:M *SUMMARY OF SOIL AND GENETIC INPUT PARAMETERS SOIL LOWER UPPER SAT EXTR INIT ROOT BULK pH NO3 NH4 ORG DEPTH LIMIT LIMIT SW SW SW DIST DENS C cm cm3/cm3 cm3/cm3 cm3/cm3 g/cm3 ugN/g ugN/g % ------------------------------------------------------------------------------- 0- 5 0.026 0.096 0.230 0.070 0.086 1.00 1.30 7.00 0.10 0.50 2.00 5- 15 0.025 0.086 0.230 0.061 0.086 1.00 1.30 7.00 0.10 0.50 1.00 15- 30 0.025 0.086 0.230 0.061 0.086 0.70 1.40 7.00 0.10 0.50 1.00 30- 45 0.025 0.086 0.230 0.061 0.086 0.30 1.40 7.00 0.10 0.50 0.50 45- 60 0.025 0.086 0.230 0.061 0.086 0.30 1.40 7.00 0.10 0.50 0.50 60- 90 0.028 0.090 0.230 0.062 0.076 0.05 1.45 7.00 0.10 0.60 0.10 90-120 0.028 0.090 0.230 0.062 0.076 0.03 1.45 7.00 0.10 0.50 0.10 120-150 0.029 0.130 0.230 0.101 0.130 0.00 1.45 7.00 0.10 0.50 0.04 150-180 0.070 0.258 0.360 0.188 0.258 0.00 1.20 7.00 0.10 0.50 0.24 TOT-180 6.2 22.2 45.3 16.1 21.4 <--cm - kg/ha--> 2.5 12.9 87080 SOIL ALBEDO : 0.18 EVAPORATION LIMIT : 2.00 MIN. FACTOR : 1.00 RUNOFF CURVE # :60.00 DRAINAGE RATE : 0.65 FERT. FACTOR : 0.80 MAIZE CULTIVAR :IB0035-McCurdy 84aa ECOTYPE :IB0002 P1 : 265.00 P2 : 0.3000 P5 : 920.00 G2 : 990.00 G3 : 8.500 PHINT : 39.000 *SIMULATED CROP AND SOIL STATUS AT MAIN DEVELOPMENT STAGES RUN NO. 1 RAINFED LOW NITROGEN CROP GROWTH BIOMASS CROP N STRESS DATE AGE STAGE kg/ha LAI kg/ha % H2O N ------ --- ---------- ----- ----- --- --- ---- ---- 25 FEB 0 Start Sim 0 0.00 0 0.0 0.00 0.00 26 FEB 0 Sowing 0 0.00 0 0.0 0.00 0.00 27 FEB 1 Germinate 0 0.00 0 0.0 0.00 0.00 9 MAR 11 Emergence 29 0.00 1 4.4 0.00 0.00 27 MAR 29 End Juveni 251 0.43 4 1.6 0.00 0.09 1 APR 34 Floral Ini 304 0.44 4 1.5 0.00 0.50 *DSSAT Cropping System Model Ver. 4.0.2.000 May 21, 2009; 16:32:33 *RUN 1 : RAINFED LOW NITROGEN MODEL : MZCER040 - MAIZE EXPERIMENT : UFGA8201 MZ NIT X IRR, GAINESVILLE 2N*3I TREATMENT 1 : RAINFED LOW NITROGEN CROP : MAIZE CULTIVAR : McCurdy 84aa ECOTYPE :IB0002 STARTING DATE : FEB 25 1982 PLANTING DATE : FEB 26 1982 PLANTS/m2 : 7.2 ROW SPACING : 61.cm WEATHER : UFGA 1982 SOIL : IBMZ910014 TEXTURE : - Millhopper Fine Sand SOIL INITIAL C : DEPTH:180cm EXTR. H2O:160.9mm NO3: 2.5kg/ha NH4: 12.9kg/ha WATER BALANCE : IRRIGATE ON REPORTED DATE(S) IRRIGATION : 13 mm IN 1 APPLICATIONS NITROGEN BAL. : SOIL-N & N-UPTAKE SIMULATION; NO N-FIXATION N-FERTILIZER : 116 kg/ha IN 3 APPLICATIONS RESIDUE/MANURE : INITIAL : 1000 kg/ha ; 0 kg/ha IN 0 APPLICATIONS ENVIRONM. OPT. : DAYL= 0.00 SRAD= 0.00 TMAX= 0.00 TMIN= 0.00 RAIN= 0.00 CO2 = R330.00 DEW = 0.00 WIND= 0.00 SIMULATION OPT : WATER :Y NITROGEN:Y N-FIX:N PHOSPH :N PESTS :N PHOTO :C ET :R INFIL:S HYDROL :R SOM :G MANAGEMENT OPT : PLANTING:R IRRIG :R FERT :R RESIDUE:N HARVEST:M WTH:M *SUMMARY OF SOIL AND GENETIC INPUT PARAMETERS SOIL LOWER UPPER SAT EXTR INIT ROOT BULK pH NO3 NH4 ORG DEPTH LIMIT LIMIT SW SW SW DIST DENS C cm cm3/cm3 cm3/cm3 cm3/cm3 g/cm3 ugN/g ugN/g % ------------------------------------------------------------------------------- 0- 5 0.026 0.096 0.230 0.070 0.086 1.00 1.30 7.00 0.10 0.50 2.00 5- 15 0.025 0.086 0.230 0.061 0.086 1.00 1.30 7.00 0.10 0.50 1.00 15- 30 0.025 0.086 0.230 0.061 0.086 0.70 1.40 7.00 0.10 0.50 1.00 30- 45 0.025 0.086 0.230 0.061 0.086 0.30 1.40 7.00 0.10 0.50 0.50 45- 60 0.025 0.086 0.230 0.061 0.086 0.30 1.40 7.00 0.10 0.50 0.50 60- 90 0.028 0.090 0.230 0.062 0.076 0.05 1.45 7.00 0.10 0.60 0.10 90-120 0.028 0.090 0.230 0.062 0.076 0.03 1.45 7.00 0.10 0.50 0.10 120-150 0.029 0.130 0.230 0.101 0.130 0.00 1.45 7.00 0.10 0.50 0.04 150-180 0.070 0.258 0.360 0.188 0.258 0.00 1.20 7.00 0.10 0.50 0.24 TOT-180 6.2 22.2 45.3 16.1 21.4 <--cm - kg/ha--> 2.5 12.9 87080 SOIL ALBEDO : 0.18 EVAPORATION LIMIT : 2.00 MIN. FACTOR : 1.00 RUNOFF CURVE # :60.00 DRAINAGE RATE : 0.65 FERT. FACTOR : 0.80 MAIZE CULTIVAR :IB0035-McCurdy 84aa ECOTYPE :IB0002 P1 : 265.00 P2 : 0.3000 P5 : 920.00 G2 : 990.00 G3 : 8.500 PHINT : 39.000 *SIMULATED CROP AND SOIL STATUS AT MAIN DEVELOPMENT STAGES RUN NO. 1 RAINFED LOW NITROGEN CROP GROWTH BIOMASS CROP N STRESS DATE AGE STAGE kg/ha LAI kg/ha % H2O N ------ --- ---------- ----- ----- --- --- ---- ---- 25 FEB 0 Start Sim 0 0.00 0 0.0 0.00 0.00 26 FEB 0 Sowing 0 0.00 0 0.0 0.00 0.00 27 FEB 1 Germinate 0 0.00 0 0.0 0.00 0.00 9 MAR 11 Emergence 29 0.00 1 4.4 0.00 0.00 27 MAR 29 End Juveni 251 0.43 4 1.6 0.00 0.09 1 APR 34 Floral Ini 304 0.44 4 1.5 0.00 0.50 OUTPUT Phenology flowering, grain/seed/tuber, maturity Yield component grain/seed/tuber, biomass, LAI Growth grain/seed/tuber, biomass, LAI Soil nitrogen balance, water balance, carbon balance 0 1 2 3 4 5 6 7 8 9 10 0 50 100 150 200 Yield (t/ha) Fertilizer (kg[N]/ha)
  10. Maize Yield Simulation Settings  Resolution: 5 arc-minutes ( 10

    km gridcells)  Extent: Kenya, Tanzania, Rwanda, Burundi, Uganda  Climate: 50 realizations of daily weather from historical monthly mean climate  Yield Model: CERES-Maize in DSSAT-CSM v4.5  Soil: FAO HWSD v1.1 + ISRIC WISE v1.1  Maize Variety: OPV (medium maturity)  Planting window: HC Growing Seasons + IIASA GAEZ v3.0  Fertilizer rate: Basal and topdressing of urea (0, 10, 20, …, 100 kg[N]/ha)  Water: Not managed (i.e., rainfed system)
  11. Estimating Value Cost Ratios (VCRs) “Fertilizer markets have failed in

    Africa”  Why? – Scattered and small size of local market – Weak demand for use with food staple crops – High transportation cost – poor road and rail infrastructure, particularly in landlocked countries – Low profitability Value-Cost Ratio (VCR)  N = fertilizer application rate (kg/ha)  y(N) = maize yield with fertilizer at N rate (t/ha)  y(N) = y(N) – y(0) (t/ha) “…IFDC suggests VCR>2 to accommodate price and climatic risks and still provide an incentive to farmers” World Bank ARD Note Issue 21 (2007) fert ilizer x,y maize x,y x,y x,y Price N Price y(N) VCR    
  12. VCRs in Northern and Central Corridors Northern Corridor Country VCR

    (av. max) Av. N appl. at max VCR (kg/ha) Maize yield (kg/ha) Urea price (US$/Ton) Maize price (US$/ton) Kenya 3.31 26.0 1,650 446 186 Rwanda 1.54 20.0 1,473 587 156 Uganda 2.17 30.3 2,274 544 114 Corridor 2.80 27.1 1,849 489 160 Central Corridor Country VCR (av. max) Av N appl. at max VCR (kg/ha) Maize yield (kg/ha) Urea price (US$/Ton) Maize price (US$/ton) Burundi 4.03 28.9 3,343 601 198 Rwanda 1.71 22.2 1,808 601 146 Tanzania 2.09 27.5 2,607 499 90 Corridor 2.24 27.0 2,584 521 108
  13. Urea Use VCRs: Country Means Country VCR (av. max) Av.

    N appl. at max VCR (kg/ha) Maize yield (kg/ha) Urea price (US$/Ton) Maize price (US$/ton) Burundi 3.95 29.4 3,266 600 195 Kenya 1.59 26.4 1,203 513 126 Rwanda 1.67 22.4 1,795 601 146 Tanzania 2.18 31.8 2,821 549 117 Uganda 2.38 37.6 2,925 556 104 Region 1.93 29.9 1,943 534 121
  14. Urea Use VCRs: AEZ means Avg. Max. VCR Av. Yield

    at Max. VCR (kg ha-1) Av. Fert. Rate at Max. VCR (kg[N] ha-1) Lowlands Arid 0.74 897 34 Lowlands Semi-Arid 2.00 1,636 30 Lowlands Sub-Humid 1.97 2,154 26 Lowlands Humid 2.90 3,243 39 Highlands Semi-Arid 2.31 2,414 30 Highlands Sub-Humid 2.65 2,530 29 Highlands Humid 2.80 2,255 28 Region 2.19 2,161 31
  15. (2) Reduce transport costs (1) Reduce landed cost of urea

    (3) Streamline customs/ border regulations Baseline 20% change 50% change SCENARIO ANALYSIS
  16. RAINFED WHEAT 1. Agro-climatic suitability Recommended Fertilizer Rate No Fertilizer

    2. Yield responses to fertilizer High : 8000 Low : 1 Mean Yield (kg/ha) 4000 3. Modeling of farm-gate prices Transport cost: Port to Farm-gate Transport cost: Capital to Farm-gate Wheat farming enterprise data 0 50 100 150 200 250 300 350 400 450 Wheat price (US$/ton) Nominal world wheat price Real world wheat price International wheat and fertilizer prices 4. Profitability analysis Profitability Sensitivity Analysis Tool (Excel) Variety: Digelu Variety: Veery Kenya Ethiopia Yield Yield No fert. 100% Rec. Fert. No fert. 100% Rec. Fert. Net Economic Return and Potential Production Country Net economic return (US $/Ha) Incremental net economic return (%) T0 T1 T2 T0 to T1 T0 to T2 T1 to T2 Angola -198.60 -85.75 -22.11 56.82 88.87 74.22 Burundi 753.11 1096.98 1362.42 45.66 80.91 24.20 Ethiopia 59.62 173.80 233.87 191.51 292.27 34.56 Kenya 741.03 976.46 1160.50 31.77 56.61 18.85 Madagascar 161.46 239.31 267.92 48.22 65.94 11.96 Mozambique -46.94 29.15 39.20 162.10 183.51 34.48 Rwanda 1131.30 1377.55 1566.96 21.77 38.51 13.75 Tanzania 379.00 554.67 658.47 46.35 73.74 18.71 DRC 171.67 347.30 454.33 102.31 164.65 30.82 Uganda 639.29 903.64 1103.94 41.35 72.68 22.17 Zambia 67.72 310.20 449.48 358.06 563.73 44.90 Zimbabwe -25.72 236.49 400.16 1019.48 1655.83 69.21 Source: CIMMYT – HarvestChoice “Wheat Potential for Africa “ (2011)
  17. General Conclusions • Fertilizer import, transport, and transactions cost have

    a very strong influence on farm-gate fertilizer prices • Consequently, policies and investments that reduce these costs can have very broad-scale economic benefits • There is high spatial variation in the response to nitrogen application as a consequence of the variation in climate and soils • The confounding of local variation in input and output prices, weather and soil leads to greater spatial variation in the profitability of production and, consequently, on the incentives to adopt new technologies. • While undergoing further validation and calibration, there appear to be many locations in in East Africa where nitrogen application appears not to be profitable* * Analysis was limited to urea use only and higher N response can be obtained through a range of complementary inputs and management practices
  18. Issues and Next Steps  On-going validation and refinement using

    a broader range of empirical data, e.g., – Improved road network and fertilizer cost build up data – Observed farm-gate prices – Farm level fertilizer use efficiency data – Including P as well as N in crop simulation – Household survey data  Improved empirical estimation approach under development (e.g. Media, vector+ raster) including seasonality (temporal change in surplus/deficit regions)  Now running crop model with historic weather record to assess (climate-induced) temporal variability in productivity and profitability  No plans (yet!) to assemble historic prices and assess joint impacts of climate and price volatility on profitability  Extending data and analytical base to most of SSA  Feedback and collaborative opportunities to improve, extend and apply approach welcomed by HarvestChoice team!
  19. Overview  Spatial price modeling  Mapping crop calendar 

    Trends and spatial patterns of Ag. Productivity  Spatial production allocation model (SPAM)  Poverty mapping  Mapping livestock from household and census data 21  Arabic spatial  Modeling Farmers’ Agricultural Knowledge Spillover  The Economics of Land Degradation: A Way Forward for An Action-Oriented Global Economic Assessment
  20. Background  Crop calendar is important: 1. to a large

    number of organizations and individuals who are concerned with production, marketing, processing and trade of food and feed products. 2. to seed and input suppliers 3. To crop growth modeler 4. To the stakeholders and farmers
  21. Background  FAO (2007) - Many countries, with an emphasis

    on developing countries, especially Africa. Mostly national-level data, but some  large countries are divided into two or three regions  USDA (2006) - Many countries, with an emphasis on Europe, Asia and North America. Mostly national-level data, but some large countries are divided into two regions  USDA-FAS (2008) - High-resolution, sub-national data for Russia and Ukraine. National-level data for Argentina, Côte d’Ivoire, Ethiopia,  Iran, Iraq, Kenya, Nigeria, Somalia, Syria, Tanzania, Turkey and Zimbabwe  USDA-NASS (1997) - State-level data for the United States  IMD-AGRIMET (2008) Very high-resolution, district-level data for India  USDA-FAS (2003) - State-level data for Australia Source: Center for Sustainability and the Global Environment (SAGE)
  22. FAO crop calendar Country Agro-ecological zones Administrative areas Agricultural practices

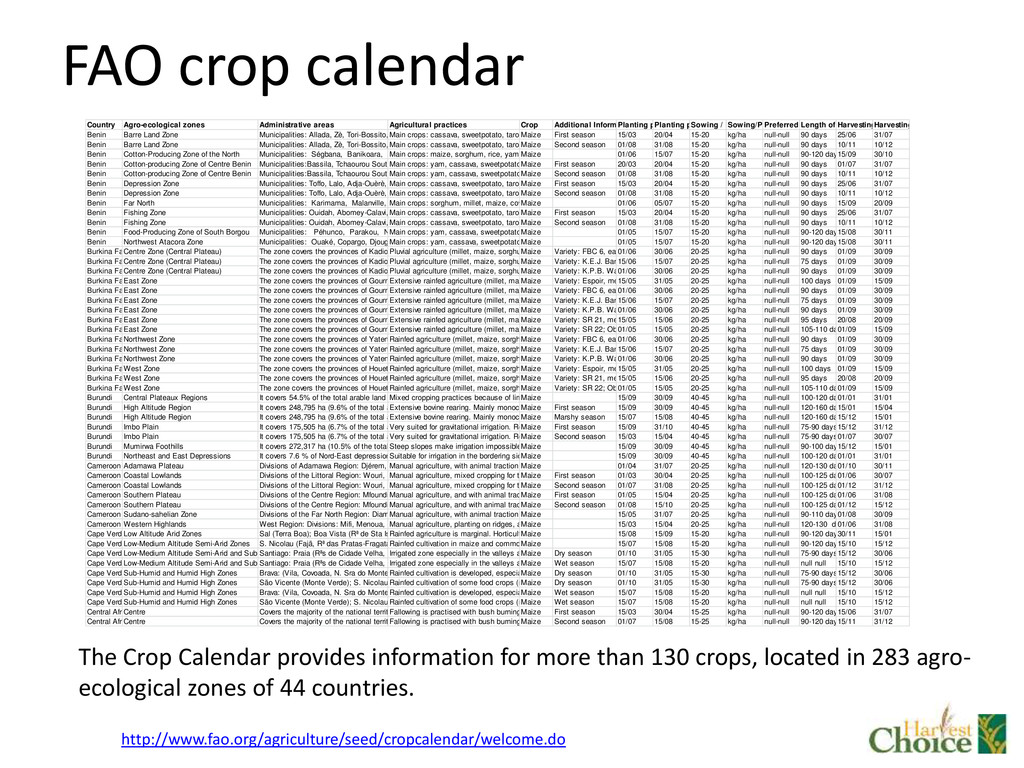
    Crop Additional Information Planting period - onset Planting period - end Sowing / Planting rate Sowing/Planting rate unit Preferred sowing/planting period Length of the cropping cycle Harvesting period - onset Harvesting period - end Benin Barre Land Zone Municipalities: Allada, Zè, Tori-Bossito, Kpomassè, Djakotomè, Klouékanmè, Bopa, Dogbo, Houéyogbé, Sakété, ifangni Avrankou, Adjara, Akpro-missérété, Porto-Novo, Agbangnizou, Abomey , Bohicon, Ouinhi, Main crops: cassava, sweetpotato, taro, maize, rice, sorghum, groundnut, cowpea, angole pea, soybean, dohi, Bambara groundnut, goussi, tomato, pepper, okra, oil palm. Maize First season 15/03 20/04 15-20 kg/ha null-null 90 days 25/06 31/07 Benin Barre Land Zone Municipalities: Allada, Zè, Tori-Bossito, Kpomassè, Djakotomè, Klouékanmè, Bopa, Dogbo, Houéyogbé, Sakété, ifangni Avrankou, Adjara, Akpro-missérété, Porto-Novo, Agbangnizou, Abomey , Bohicon, Ouinhi, Main crops: cassava, sweetpotato, taro, maize, rice, sorghum, groundnut, cowpea, angole pea, soybean, dohi, Bambara groundnut, goussi, tomato, pepper, okra, oil palm. Maize Second season 01/08 31/08 15-20 kg/ha null-null 90 days 10/11 10/12 Benin Cotton-Producing Zone of the North Municipalities: Ségbana, Banikoara, Gogounou, Kérou Kouandé. Kandi South Main crops: maize, sorghum, rice, yam, cassava, sweetpotato, cowpea, groundnut, soybean, tomato, pepper, okra. Maize cultivation is mostly fertilized. Maize 01/06 15/07 15-20 kg/ha null-null 90-120 days 15/09 30/10 Benin Cotton-producing Zone of Centre Benin Municipalities:Bassila, Tchaourou South, Kétou, Main crops: yam, cassava, sweetpotato, maize, sorghum, rice, groundnut, cowpea, soybean, Angola pea, dohi, goussi, tomato, pepper, okra Maize First season 20/03 20/04 15-20 kg/ha null-null 90 days 01/07 31/07 Benin Cotton-producing Zone of Centre Benin Municipalities:Bassila, Tchaourou South, Kétou, Main crops: yam, cassava, sweetpotato, maize, sorghum, rice, groundnut, cowpea, soybean, Angola pea, dohi, goussi, tomato, pepper, okra Maize Second season 01/08 31/08 15-20 kg/ha null-null 90 days 10/11 10/12 Benin Depression Zone Municipalities: Toffo, Lalo, Adja-Ouèrè, Pobè. Main crops: cassava, sweetpotato, taro, maize, rice, sorghum, groundnut, cowpea, Angola pea, soybean, dohi, Bambara groundnut, goussi, tomato, pepper, okra, oil palm. Maize First season 15/03 20/04 15-20 kg/ha null-null 90 days 25/06 31/07 Benin Depression Zone Municipalities: Toffo, Lalo, Adja-Ouèrè, Pobè. Main crops: cassava, sweetpotato, taro, maize, rice, sorghum, groundnut, cowpea, Angola pea, soybean, dohi, Bambara groundnut, goussi, tomato, pepper, okra, oil palm. Maize Second season 01/08 31/08 15-20 kg/ha null-null 90 days 10/11 10/12 Benin Far North Municipalities: Karimama, Malanville, North Kandi Municipality Main crops: sorghum, millet, maize, cowpea, soybean, groundnut, okra, rice, potato, tomato, pepper, onion. Rice, potato, tomato. onion is irrigated Maize 01/06 05/07 15-20 kg/ha null-null 90 days 15/09 20/09 Benin Fishing Zone Municipalities: Ouidah, Abomey-Calavi, Sô-Ava;Lokossa, Athiémé, Comè, Grand-Popo, Sèmè-Kpodji; Aguégué, Dangbo, Adjohoun, Bonou Main crops: cassava, sweetpotato, taro, maize, rice, cowpea, groundnut, Angola pea, onion, tomato, pepper, okra, oil palm and coconut. Maize First season 15/03 20/04 15-20 kg/ha null-null 90 days 25/06 31/07 Benin Fishing Zone Municipalities: Ouidah, Abomey-Calavi, Sô-Ava;Lokossa, Athiémé, Comè, Grand-Popo, Sèmè-Kpodji; Aguégué, Dangbo, Adjohoun, Bonou Main crops: cassava, sweetpotato, taro, maize, rice, cowpea, groundnut, Angola pea, onion, tomato, pepper, okra, oil palm and coconut. Maize Second season 01/08 31/08 15-20 kg/ha null-null 90 days 10/11 10/12 Benin Food-Producing Zone of South Borgou Municipalities: Péhunco, Parakou, N'dali, Pèrèrè, Nikki, Kalalé, Sinendé, Bembèrèkè, Tchaorou North Main crops: yam, cassava, sweetpotato, maize, sorghum, rice, cowpea, soybean, groundnut, voandzou, tomato, pepper, okra. Maize 01/05 15/07 15-20 kg/ha null-null 90-120 days 15/08 30/11 Benin Northwest Atacora Zone Municipalities: Ouaké, Copargo, Djougou West, Tanguiéta, Cobly, Matéri, Boukoumbé, Toucountouna. Main crops: yam, cassava, sweetpotato, taro, maize, sorghum, millet, fonio, rice, cowpea, soybean, groundnut, voandzou, sesame, tomato, pepper, okra, goussi. Maize 01/05 15/07 15-20 kg/ha null-null 90-120 days 15/08 30/11 Burkina Faso Centre Zone (Central Plateau) The zone covers the provinces of Kadiogo, Bazèga, Boulkiemdé, Ziro, Sapouy, Sissili, Boulgou, Koulpelgo, Nahouri, Zounwégo, Ganzourgou, Oubritenga, Sanmatenga, Kouritenga, Sanguié, and Namentenga. Pluvial agriculture (millet, maize, sorghum, cowpeas, tubers), cash crops (cotton) and irrigated crops (rice, vegetable crops) as well as sedentary livestock comprised mainly of small ruminants a Maize Variety: FBC 6, early for semi-intensive agriculture, roasting maize 01/06 30/06 20-25 kg/ha null-null 90 days 01/09 30/09 Burkina Faso Centre Zone (Central Plateau) The zone covers the provinces of Kadiogo, Bazèga, Boulkiemdé, Ziro, Sapouy, Sissili, Boulgou, Koulpelgo, Nahouri, Zounwégo, Ganzourgou, Oubritenga, Sanmatenga, Kouritenga, Sanguié, and Namentenga. Pluvial agriculture (millet, maize, sorghum, cowpeas, tubers), cash crops (cotton) and irrigated crops (rice, vegetable crops) as well as sedentary livestock comprised mainly of small ruminants a Maize Variety: K.E.J. Barka, extra early for traditional agriculture 15/06 15/07 20-25 kg/ha null-null 75 days 01/09 30/09 Burkina Faso Centre Zone (Central Plateau) The zone covers the provinces of Kadiogo, Bazèga, Boulkiemdé, Ziro, Sapouy, Sissili, Boulgou, Koulpelgo, Nahouri, Zounwégo, Ganzourgou, Oubritenga, Sanmatenga, Kouritenga, Sanguié, and Namentenga. Pluvial agriculture (millet, maize, sorghum, cowpeas, tubers), cash crops (cotton) and irrigated crops (rice, vegetable crops) as well as sedentary livestock comprised mainly of small ruminants a Maize Variety: K.P.B. Wari, early for semi-intensive agriculture 01/06 30/06 20-25 kg/ha null-null 90 days 01/09 30/09 Burkina Faso East Zone The zone covers the provinces of Gourman, Gnagnan, Tapoa, Kompienga and Komandjari. Extensive rainfed agriculture (millet, maize, sorghum, groundnut, cowpea, cotton...) and irrigated agriculture (rice, vegetables) and extensive livestock rearing (bovine, small ruminant and poultry). Maize Variety: Espoir, medium cycle for semi-intensive agriculture 15/05 31/05 20-25 kg/ha null-null 100 days 01/09 15/09 Burkina Faso East Zone The zone covers the provinces of Gourman, Gnagnan, Tapoa, Kompienga and Komandjari. Extensive rainfed agriculture (millet, maize, sorghum, groundnut, cowpea, cotton...) and irrigated agriculture (rice, vegetables) and extensive livestock rearing (bovine, small ruminant and poultry). Maize Variety: FBC 6, early for semi-intensive agriculture, roasting maize 01/06 30/06 20-25 kg/ha null-null 90 days 01/09 30/09 Burkina Faso East Zone The zone covers the provinces of Gourman, Gnagnan, Tapoa, Kompienga and Komandjari. Extensive rainfed agriculture (millet, maize, sorghum, groundnut, cowpea, cotton...) and irrigated agriculture (rice, vegetables) and extensive livestock rearing (bovine, small ruminant and poultry). Maize Variety: K.E.J. Barka, extra early for traditional agriculture 15/06 15/07 20-25 kg/ha null-null 75 days 01/09 30/09 Burkina Faso East Zone The zone covers the provinces of Gourman, Gnagnan, Tapoa, Kompienga and Komandjari. Extensive rainfed agriculture (millet, maize, sorghum, groundnut, cowpea, cotton...) and irrigated agriculture (rice, vegetables) and extensive livestock rearing (bovine, small ruminant and poultry). Maize Variety: K.P.B. Wari, early for semi-intensive agriculture 01/06 30/06 20-25 kg/ha null-null 90 days 01/09 30/09 Burkina Faso East Zone The zone covers the provinces of Gourman, Gnagnan, Tapoa, Kompienga and Komandjari. Extensive rainfed agriculture (millet, maize, sorghum, groundnut, cowpea, cotton...) and irrigated agriculture (rice, vegetables) and extensive livestock rearing (bovine, small ruminant and poultry). Maize Variety: SR 21, medium cycle for semi-intensive agriculture 15/05 15/06 20-25 kg/ha null-null 95 days 20/08 20/09 Burkina Faso East Zone The zone covers the provinces of Gourman, Gnagnan, Tapoa, Kompienga and Komandjari. Extensive rainfed agriculture (millet, maize, sorghum, groundnut, cowpea, cotton...) and irrigated agriculture (rice, vegetables) and extensive livestock rearing (bovine, small ruminant and poultry). Maize Variety: SR 22; Obatampa, medium cycle for semi-intensive agriculture 01/05 15/05 20-25 kg/ha null-null 105-110 days 01/09 15/09 Burkina Faso Northwest Zone The zone covers the provinces of Yatenga, Bam, Passoré, Sourou, Nayala, Kourwéogo, Loroum, and Zandoma. Rainfed agriculture (millet, maize, sorghum, cowpeas), cash crops (cotton) and irrigated crops (rice, vegetable crops) as well as extensive livestock rearing that comprises bovine, ovine, caprine, Maize Variety: FBC 6, early for semi-intensive agriculture, roasting maize 01/06 30/06 20-25 kg/ha null-null 90 days 01/09 30/09 Burkina Faso Northwest Zone The zone covers the provinces of Yatenga, Bam, Passoré, Sourou, Nayala, Kourwéogo, Loroum, and Zandoma. Rainfed agriculture (millet, maize, sorghum, cowpeas), cash crops (cotton) and irrigated crops (rice, vegetable crops) as well as extensive livestock rearing that comprises bovine, ovine, caprine, Maize Variety: K.E.J. Barka, extra early for traditional agriculture 15/06 15/07 20-25 kg/ha null-null 75 days 01/09 30/09 Burkina Faso Northwest Zone The zone covers the provinces of Yatenga, Bam, Passoré, Sourou, Nayala, Kourwéogo, Loroum, and Zandoma. Rainfed agriculture (millet, maize, sorghum, cowpeas), cash crops (cotton) and irrigated crops (rice, vegetable crops) as well as extensive livestock rearing that comprises bovine, ovine, caprine, Maize Variety: K.P.B. Wari, early for semi-intensive agriculture 01/06 30/06 20-25 kg/ha null-null 90 days 01/09 30/09 Burkina Faso West Zone The zone covers the provinces of Houet, Kénédougou, Comoé, Léraba, Balé, Mouhoun, Kossi, Banwa, Bougouriba, Ioba, Noumbiel, Poni, and Tuy. Rainfed agriculture (millet, maize, sorghum, cowpeas, roots and tubers, fonio), cash crops (cotton) and irrigated crops (rice, sugarcane, vegetable crops) as well as an extensive livestock rearing Maize Variety: Espoir, medium cycle for semi-intensive agriculture 15/05 31/05 20-25 kg/ha null-null 100 days 01/09 15/09 Burkina Faso West Zone The zone covers the provinces of Houet, Kénédougou, Comoé, Léraba, Balé, Mouhoun, Kossi, Banwa, Bougouriba, Ioba, Noumbiel, Poni, and Tuy. Rainfed agriculture (millet, maize, sorghum, cowpeas, roots and tubers, fonio), cash crops (cotton) and irrigated crops (rice, sugarcane, vegetable crops) as well as an extensive livestock rearing Maize Variety: SR 21, medium cycle for semi-intensive agriculture 15/05 15/06 20-25 kg/ha null-null 95 days 20/08 20/09 Burkina Faso West Zone The zone covers the provinces of Houet, Kénédougou, Comoé, Léraba, Balé, Mouhoun, Kossi, Banwa, Bougouriba, Ioba, Noumbiel, Poni, and Tuy. Rainfed agriculture (millet, maize, sorghum, cowpeas, roots and tubers, fonio), cash crops (cotton) and irrigated crops (rice, sugarcane, vegetable crops) as well as an extensive livestock rearing Maize Variety: SR 22; Obatampa, medium cycle for semi-intensive agriculture 01/05 15/05 20-25 kg/ha null-null 105-110 days 01/09 15/09 Burundi Central Plateaux Regions It covers 54.5% of the total arable land of the country and comprises the following 9 provinces: 1. Gitega (Mutaho, Bugendana, Gihogazi, Giheta, Gishubi, Bukirasazi and Itaba municipalities) 2. Mwaro (kayokwe, Nyagµbihanga and Bi Mixed cropping practices because of limited land and human overpopulation. Irrigation is difficult because of steep slopes. Intensive exploitation of marsh lands. Mixed cropping practices, poultry Maize 15/09 30/09 40-45 kg/ha null-null 100-120 days 01/01 31/01 Burundi High Altitude Region It covers 248,795 ha (9.6% of the total area of the country. It extends to the following 5 provinces: 1. Kayanza in the North of the region (Kabarore, Muruta and Bukinanyana municipalities) 2. Muramvya in the Centre-West (Bukeye and Extensive bovine rearing. Mainly monoculture because of the existence of large unexploited lands. Irrigation is difficult because of high mountains. Maize First season 15/09 30/09 40-45 kg/ha null-null 120-160 days 15/01 15/04 Burundi High Altitude Region It covers 248,795 ha (9.6% of the total area of the country. It extends to the following 5 provinces: 1. Kayanza in the North of the region (Kabarore, Muruta and Bukinanyana municipalities) 2. Muramvya in the Centre-West (Bukeye and Extensive bovine rearing. Mainly monoculture because of the existence of large unexploited lands. Irrigation is difficult because of high mountains. Maize Marshy season 15/07 15/08 40-45 kg/ha null-null 120-160 days 15/12 15/01 Burundi Imbo Plain It covers 175,505 ha (6.7% of the total arable area of the country)It extends to 4 provinces which are: 1. Cibitoke in the Northeast of the country (Rugombo and Buganda municipalities) 2. Bubanza (Gihanga and Mpanda municipalities) Very suited for gravitational irrigation. Relatively reduced cropping cycle because temperature and humidity are favourable for crops. Extensive zone for bovine grazing because of availability of na Maize First season 15/09 31/10 40-45 kg/ha null-null 75-90 days15/12 31/12 Burundi Imbo Plain It covers 175,505 ha (6.7% of the total arable area of the country)It extends to 4 provinces which are: 1. Cibitoke in the Northeast of the country (Rugombo and Buganda municipalities) 2. Bubanza (Gihanga and Mpanda municipalities) Very suited for gravitational irrigation. Relatively reduced cropping cycle because temperature and humidity are favourable for crops. Extensive zone for bovine grazing because of availability of na Maize Second season 15/03 15/04 40-45 kg/ha null-null 75-90 days01/07 30/07 Burundi Mumirwa Foothills It covers 272,317 ha (10.5% of the total arable land of the country). It extends to the same provinces as the Imbo Plain region and also includes the municipalities: Murwi and Mugina in the Cibitoke province in the north of the country; Steep slopes make irrigation impossible. Intensive mixed cropping practices because of overpopulation. Maize 15/09 30/09 40-45 kg/ha null-null 90-100 days 15/12 15/01 Burundi Northeast and East Depressions It covers 7.6 % of Nord-East depressions and 11.1% of the depressions is the total arable land of the country. It comprises 3 provinces: 1. Kirundo (Bugabira, Busoni, Ntega,Vumbi and Gitobe municipalities) 2. Ruyigi (Gisuru, Kinyinya Suitable for irrigation in the bordering side of the East with weak slopes dominated by several industrial sugar cane plantations. North regions difficult to irrigate because of small undulating hills w Maize 15/09 30/09 40-45 kg/ha null-null 100-120 days 01/01 31/01 Cameroon Adamawa Plateau Divisions of Adamawa Region: Djérem, Faro and Déo, Mbéré, Mayo Banyo, Vina Manual agriculture, with animal traction, monoculture on maize, fertilizer use on maize, mixed cultivation for the other food crops. Mechanized maize cultivation by specialized farmers. Cropping Maize 01/04 31/07 20-25 kg/ha null-null 120-130 days 01/10 30/11 Cameroon Coastal Lowlands Divisions of the Littoral Region: Wouri, Nkam, Sanaga Maritime, Mungo. Divisions of the Southwest Region: Manyu, Ndian, Fako, Meme, Lebialem, Kupe-Manenguba. Manual agriculture, mixed cropping for the food crops. Industrial plantations of rubber, tea, banana and oil palms. Flat ploughing. Maize First season 01/03 30/04 20-25 kg/ha null-null 100-125 days 01/06 30/07 Cameroon Coastal Lowlands Divisions of the Littoral Region: Wouri, Nkam, Sanaga Maritime, Mungo. Divisions of the Southwest Region: Manyu, Ndian, Fako, Meme, Lebialem, Kupe-Manenguba. Manual agriculture, mixed cropping for the food crops. Industrial plantations of rubber, tea, banana and oil palms. Flat ploughing. Maize Second season 01/07 31/08 20-25 kg/ha null-null 100-125 days 01/12 31/12 Cameroon Southern Plateau Divisions of the Centre Region: Mfoundi, Nyong and Kéllé, Upper Sanaga, Lékié, Nyon and So'o, Mefou and Afamba, Mbam and Inoubou, Mbam and Kim, Mefou and Akono. Divisions of the South Region: Dja and Lobo, Ocean, Ntem Manual agriculture, and with animal traction, mixed cropping for food crops. Flat manual plough. Maize First season 01/05 15/04 20-25 kg/ha null-null 100-125 days 01/06 31/08 Cameroon Southern Plateau Divisions of the Centre Region: Mfoundi, Nyong and Kéllé, Upper Sanaga, Lékié, Nyon and So'o, Mefou and Afamba, Mbam and Inoubou, Mbam and Kim, Mefou and Akono. Divisions of the South Region: Dja and Lobo, Ocean, Ntem Manual agriculture, and with animal traction, mixed cropping for food crops. Flat manual plough. Maize Second season 01/08 15/10 20-25 kg/ha null-null 100-125 days 01/12 15/12 Cameroon Sudano-sahelian Zone Divisions of the Far North Region: Diamaré, Mayo-Kani, Logone and Chari, Mayo-Sava, Mayo-Tsanaga, Mayo-Danay. Divisions of the North Region: Bénoué, Mayo-Louti, Mayo-Rey, Faro. Manual agriculture, with animal traction, monoculture is generally practiced; fertilizer and chemical pest control used on cotton and irrigated rice. Rice irrigation is practiced in Lagdo and in SEMR Maize 15/05 31/07 20-25 kg/ha null-null 90-110 days 01/08 30/09 Cameroon Western Highlands West Region: Divisions: Mifi, Menoua, Bamboutos, Ndé, Upper-Nkam, Koung-Khi, High-Plateaux. Divisions of the Northwest Region: Mezam, Menchum, Dongang-Mantung, Bui, Momo, Ngoketunjia, Boyo. Manual agriculture, planting on ridges, animal traction, mixed cropping for food crops. Ploughing in contour lines on hill slopes. Maize 15/03 15/04 20-25 kg/ha null-null 120-130 days 01/06 31/08 Cape Verde Low Altitude Arid Zones Sal (Terra Boa); Boa Vista (Rª de Sta Isabel, Bofareira, Estância de Baixo, João Galego, Cabeça dos Tarafes, Fundo Figueira, Rabil); Maio (Laje Branca- Cascabulho, Figueira Horta- Rª Chico Vaz, Rª Lagoa). São Vicente (Rª Vinha, Rainfed agriculture is marginal. Horticultural production hydroponic greenhouse is in full expansion.Rainfed cultivation of maize, common beans, date palms, watermelon, coconut, and melon. Ho Maize 15/08 15/09 15-20 kg/ha null-null 90-120 days 30/11 15/01 Cape Verde Low-Medium Altitude Semi-Arid Zones S. Nicolau (Fajã, Rª das Pratas-Fragata, Rª Brava, Caleijão, Queimadas, Juncalinho, Água das Patas)S. Antão: Porto Novo (Rª da Cruz, Alto Mira, Martiene, Lagedos, Rª Fria, Rª dos Bodes, Casa de Meio) - Sud et Ouest; Fogo: S. F Rainfed cultivation in maize and common beans. Pluvial land (35 ha) converted to irrigated areas (Faja Galery). Irrigated crops on wind-protected valleys with micro-climate that is favourable for su Maize 15/07 15/08 15-20 kg/ha null-null 90-120 days 15/10 15/12 Cape Verde Low-Medium Altitude Semi-Arid and Sub-Humid Zones Santiago: Praia (Rªs de Cidade Velha, S. Martinho Grande e Pequeno); S. Domingos (Rª de Baía, Rª de Acahada Baleia, Monte Negro, Lagoa); Santa Cruz (Rª Seca, Rª da Picos, Rª de Santa Cruz); Santa Catarina (Rª Flamengos, Rª Irrigated zone especially in the valleys and on terrace slopes. Irrigation from water sources, wells and borings. In the recent years, fruit production has been market-driven with modernization of th Maize Dry season 01/10 31/05 15-30 kg/ha null-null 75-90 days15/12 30/06 Cape Verde Low-Medium Altitude Semi-Arid and Sub-Humid Zones Santiago: Praia (Rªs de Cidade Velha, S. Martinho Grande e Pequeno); S. Domingos (Rª de Baía, Rª de Acahada Baleia, Monte Negro, Lagoa); Santa Cruz (Rª Seca, Rª da Picos, Rª de Santa Cruz); Santa Catarina (Rª Flamengos, Rª Irrigated zone especially in the valleys and on terrace slopes. Irrigation from water sources, wells and borings. In the recent years, fruit production has been market-driven with modernization of th Maize Wet season 15/07 15/08 15-20 kg/ha null-null null null 15/10 15/12 Cape Verde Sub-Humid and Humid High Zones Brava: (Vila, Covoada, N. Sra do Monte, Campo Baixo, Sorno, Ferreiros); S. Antão: Ribeira Grande (Rª Grande, Rª da Torre, Rª de garça); Paul (Rª de Paul, Campo, Chã d'Igreja) - Nord; Fogo: (Mosteiros - Pai António, Igreja). Rainfed cultivation is developed, especially with maize/common beans, manioc, sweet potato and mango. Potential zone for horticulture (especially temperate crops). Sugar cane is the most cul Maize Dry season 01/10 31/05 15-30 kg/ha null-null 75-90 days15/12 30/06 Cape Verde Sub-Humid and Humid High Zones São Vicente (Monte Verde); S. Nicolau (Monte Gordo, Fajã de Riba); S. Antão (Cova, Corda, Covão, Fundão, Pintão, Lombo Branco, Figueiral, Pico da Cruz, Santa Isabel,..) - Centre; Fogo: Mosteiros (Monte Velha, Rª do Iheu, Atalaia Rainfed cultivation of some food crops (maize, common beans, roots and tubers, groundnuts and some vegetables (2 cropping season/year). In the altitude there is cultivation of maize/common b Maize Dry season 01/10 31/05 15-30 kg/ha null-null 75-90 days15/12 30/06 Cape Verde Sub-Humid and Humid High Zones Brava: (Vila, Covoada, N. Sra do Monte, Campo Baixo, Sorno, Ferreiros); S. Antão: Ribeira Grande (Rª Grande, Rª da Torre, Rª de garça); Paul (Rª de Paul, Campo, Chã d'Igreja) - Nord; Fogo: (Mosteiros - Pai António, Igreja). Rainfed cultivation is developed, especially with maize/common beans, manioc, sweet potato and mango. Potential zone for horticulture (especially temperate crops). Sugar cane is the most cul Maize Wet season 15/07 15/08 15-20 kg/ha null-null null null 15/10 15/12 Cape Verde Sub-Humid and Humid High Zones São Vicente (Monte Verde); S. Nicolau (Monte Gordo, Fajã de Riba); S. Antão (Cova, Corda, Covão, Fundão, Pintão, Lombo Branco, Figueiral, Pico da Cruz, Santa Isabel,..) - Centre; Fogo: Mosteiros (Monte Velha, Rª do Iheu, Atalaia Rainfed cultivation of some food crops (maize, common beans, roots and tubers, groundnuts and some vegetables (2 cropping season/year). In the altitude there is cultivation of maize/common b Maize Wet season 15/07 15/08 15-20 kg/ha null-null null null 15/10 15/12 Central African Republic Centre Covers the majority of the national territory, between 5° and 9° N and the towns of Bouar (Nana Mambéré), Bossembélé (Ombella M'Poko), Bozoum (Ouham Péndé), Bossangoa (Ouham), Kaga Bandoro (Nana Gribizi), Sibut (Kémo), B Fallowing is practised with bush burning. In some areas the density of trees and shrubs limits deep ploughing. Animal traction is used in the savannah and cotton zones for ploughing and transpo Maize First season 15/03 30/04 15-25 kg/ha null-null 90-120 days 15/06 31/07 Central African Republic Centre Covers the majority of the national territory, between 5° and 9° N and the towns of Bouar (Nana Mambéré), Bossembélé (Ombella M'Poko), Bozoum (Ouham Péndé), Bossangoa (Ouham), Kaga Bandoro (Nana Gribizi), Sibut (Kémo), B Fallowing is practised with bush burning. In some areas the density of trees and shrubs limits deep ploughing. Animal traction is used in the savannah and cotton zones for ploughing and transpo Maize Second season 01/07 15/08 15-25 kg/ha null-null 90-120 days 15/11 31/12 http://www.fao.org/agriculture/seed/cropcalendar/welcome.do The Crop Calendar provides information for more than 130 crops, located in 283 agro- ecological zones of 44 countries.
  23. Vegetation Index L is the canopy background adjustment that addresses

    non-linear, differential NIR and red radiant transfer through a canopy, and C1, C2 are the coefficients of the aerosol resistance term, which uses the blue band to correct for aerosol influences in the red band. The coefficients adopted in the MODIS-EVI algorithm are; L=1, C1 = 6, C2 = 7.5, and G (gain factor) = 2.5.
  24. Crop calendar- Planting date (first season) Legend Planting date 0

    - 70 71 - 120 121 - 170 171 - 210 211 - 260 261 - 300 301 - 365 Maize area
  25. Overview  Spatial price modeling  Mapping crop calendar 

    Trends and spatial patterns of Ag. Productivity  Spatial production allocation model (SPAM)  Poverty mapping  Mapping livestock from household and census data 30  Arabic spatial  Modeling Farmers’ Agricultural Knowledge Spillover  The Economics of Land Degradation: A Way Forward for An Action-Oriented Global Economic Assessment
  26. What is “Productivity”?  Partial Factor Productivity – Land Productivity

    Yield = Output / Harvested area – Labor Productivity LP = Output / Total hours worked  Useful measures but:  do not measure productivity of all resources  can lead to misleading policy prescriptions
  27. Land and Labor Productivity in SSA, 1961-2009 Labor productivity (2004-06

    US$ PPP) Land productivity (2004-06 US$ PPP) SSA as a whole: labor productivity >> land productivity; but land productivity increased much faster, more than tripled
  28. As expected, different picture when consider different sub-regions of Africa

    Labor productivity (2004-06 US$ PPP) Land productivity (2004-06 US$ PPP) Western SSA Eastern & Central Southern
  29. Again, different picture when consider different countries Labor productivity (2004-06

    US$ PPP) Land productivity (2004-06 US$ PPP) Nigeria South Africa Ethiopia, 1993-2009 Kenya
  30. 35

  31. Ag. Mkt Pop Pot. Access Density Potential Development Strategies High

    High High HHH Perishable cash crops HHH Dairy, intensive livestock HHH Non-perishable cash crops HHH Rural non-farm development Low High HLH Non-perishable cash crops HLH High input perennials HLH Livestock intensification, improved grazing Medium High High MHH High Input cereals MHH Perishable cash crops MHH Dairy, intensive livestock MHH Rural non-farm development Low High MLH High Input cereals MLH Non-perishable cash crops MLH Livestock intensification, improved grazing Low High High LHH with irrigation investment LHH High Input cereals LHH Perishable Cash Crops LHH Dairy, intensive livestock LHH Rural non-farm development Low Low LLL Low input cereals LLL Limited livestock intensification LLL Emigration Example of Potential Regional Development Strategies Source: ASARECA Strategy. Omamo et al. 2006
  32. A. Regional Spatial Characterization of Agricultural Productivity Opportunities & Challenges

    B. Key System Typologies for focusing productivity efforts (e.g. country x farming system) C. Representative Farm Analysis of Productivity Enhancing Options D. Case Study Analysis of Factors Affecting the Scale and Sustainability of Productivity Growth Strategic Opportunities for Productivity Enhancing Policies & Investments Focus Geographies/Systems Overview of Framework and Sequence
  33. Overview  Spatial price modeling  Mapping crop calendar 

    Trends and spatial patterns of Ag. Productivity  Spatial production allocation model (SPAM)  Poverty mapping  Mapping livestock from household and census data 38  Arabic spatial  Modeling Farmers’ Agricultural Knowledge Spillover  The Economics of Land Degradation: A Way Forward for An Action-Oriented Global Economic Assessment
  34. Objectives  Providing policy-makers and analysts with reliable and detailed

    information on livestock  Improving the spatial resolution of information  Showing how integration of different data sources can greatly enhance analysis and knowledge  Using alternative method based on a wide array of data (surveys, census, satellite, FAO…) Contact: Carlo Azzarri, [email protected]
  35. Data  UNPS 09/10: 2,975 (2,375)* HHs from 322 EAs

    (out of 783 of the UNHS 05/06), nationally + Kampala&other urban, and rural Central, Eastern, Western, Northern representative. Two visits (one for cropping season), twelve-month period  UNLC 08: 964,047 HHs from all 80 districts (for a total of 8,870 EAs with at least 50 HHs/EA). Visit in February only  (ILRI, IFPRI/HarvestChoice, FAO spatial database) *45 interviews were not complete; 555 hhs are mover (364 are split-offs and 191 original movers) Contact: Carlo Azzarri, [email protected]
  36. Agro-Ecological Zones Tropic - cool / humid Tropic - cool

    / subhumid Tropic - warm / humid Tropic - warm / subhumid Source: Contact: Carlo Azzarri, [email protected]
  37. NDVI (Annual mean) * 10000 < 2000 2,001 - 4,000

    4,001 - 5,000 5,001 - 6,000 6,001 - 7,000 7,001 - 8,000 > 8,000 Contact: Carlo Azzarri, [email protected]
  38. Amount  Stover available for feed = Crop Residue x

    Utilization Factor Utilization Factor from Uganda HH Survey  Maize: 0.812  Sorghum: 0.840  Millet: 0.776  Rice: 0.485 Global crop-livestock simulation model: stover as feed source Stover dry matter utilizable as feed source* M. Herrero, P.K. Thornton, A. Notenbaert, S. Msangi, S. Wood, R. Kruska, J. Dixon, D. Bossio, J. van de Steeg, H.A. Freeman, X. Li, and P.P. Rao. 2012. Drivers of Change in Crop-Livestock Systems and their Potential Impacts on Agro-ecosystems Services and Human Well-being to 2030.
  39. High resolution cattle density from FAO Source: Gridded livestock of

    the world, FAO (2005) Data are at 5 km2 resolution (sum of the pixels is scaled to match FAO country total cattle headcount) Contact: Carlo Azzarri, [email protected]
  40. Model/1  Small Area Estimation (SAE): 1. identifying characteristics with

    common definitions (and distributions) in both NPS and NLC, used as potential explanatory variables (correlates) in a regression using the survey data: = ∗ + = + Contact: Carlo Azzarri, [email protected]
  41. Model/2 2. combining the results of the first-stage regression model

    with census variables: = ∗ + +  Assumptions: spatial correlation b/n EA and subcounty, area homogeneity  Predictors (X): farm size, pasture land, other land, # of livestock heads by type (including exotic/indigenous bulls, cows, calves, and small ruminants), # of eggs and liters of milk weekly produced, age and sex of household head, whether the household hired agricultural labor, dummies by agro-ecological zone, NDVI) Contact: Carlo Azzarri, [email protected]
  42. Overview  Spatial price modeling  Mapping crop calendar 

    Trends and spatial patterns of Ag. Productivity  Spatial production allocation model (SPAM)  Poverty mapping  Mapping livestock from household and census data 52  Arabic spatial  Modeling Farmers’ Agricultural Knowledge Spillover  The Economics of Land Degradation: A Way Forward for An Action-Oriented Global Economic Assessment
  43. Arab Spatial: An online database and web-mapping tool with more

    than 150 food security and development-related indicators Arab Spatial Development and Food Security Atlas Clemens Breisinger, [email protected]
  44.  Based on consistent conceptual framework of food security for

    development  Innovative mapping concept and technology  Flexible to accommodate any number of layers at national, subnational, and pixel levels  Dynamic display of indicators over time  Download of maps (as .csv) and meta data (as .xlsx)  Going forward  Add tools for cross- and inter-country correlation and trend analyses and comparative statistics (e.g., scatter plots, bar charts, summary tables)  Link to e-libraries for improved use as data sharing platform  Expand to incorporate country-specific atlases (e.g. “Egypt Spatial”)  Expand to countries in other world regions (e.g. Africa and Central Asia) www.arabspatial.org Arab Spatial: What is Special? Clemens Breisinger, [email protected]
  45. Overview  Spatial price modeling  Mapping crop calendar 

    Trends and spatial patterns of Ag. Productivity  Spatial production allocation model (SPAM)  Poverty mapping  Mapping livestock from household and census data 55  Arabic spatial  Modeling Farmers’ Agricultural Knowledge Spillover  The Economics of Land Degradation: A Way Forward for An Action-Oriented Global Economic Assessment
  46. Why Spillover Matters? Spillover occurs when knowledge created and acquired

    by one farmer can be used by another; • Free-rider is a farmer who receives the benefit of a particular knowledge through spillover but “avoids” paying for it; • Free-rider causes the private market to supply an amount that is sub-optimal; • If a third party decides that the total benefits exceed the costs, it can provide the agricultural knowledge and pay for it John M. Ulimwengu, [email protected]
  47. Our Contributions  Modeling knowledge spillover as a networking process

    among farmers;  Using seven different knowledge measures;  Computing direct, indirect and total spatial effects of covariate John M. Ulimwengu, [email protected]
  48. Ugandan Nat’l Household Survey 2005/2006 • Nationally representative • Covered

    7,426 households • Used GPS for households and crops locations John M. Ulimwengu, [email protected]
  49. Ugandan Nat’l Household Survey 2005/2006: Knowledge Questions & Answers 1.

    Which of the following crops improve soil fertility by capturing nutrients; making food and putting it back it to the soil? (Answer: Beans) 2. Which of the following cassava planting methods provides better yields? (Answer: Vertically planted sticks) 3. Which of the following methods increase susceptibility of crops to pests and diseases? (Answer: Late season planting) 4. Which of the following crops would follow beans better in a rotation? (Answer: Maize) 5. For best results banana should be left with a total____________ plants in each stool (stand)? (Answer: Three) 6. _________ is the most common pest on bananas? (Answer: Banana weevils) 7. What is the recommended quantity of DAP that has to be applied per hill/hole when planting maize? (Answer: One bottle top) John M. Ulimwengu, [email protected]
  50. Empirical model  Following LeSage and Pace (2009) and Lesage

    et al. (2011), we use a spatial autoregressive (SAR) probit as follows ∗ = ∗ + + , ~ 0, where ∗represents nx1 vector of latent unobservable agricultural knowledge, is the nxn spatial weight matrix ∗ = =1 + Hence, =1 = =1 where = − −1 = + + 22 + ⋯ , is the probability of having agricultural knowledge with as the probability rule or function. John M. Ulimwengu, [email protected]
  51. Concluding Remarks  Failure to account for spillover biases estimation

    of policy effects;  Free-riding reduces both the willingness and the amount to pay for agricultural services;  Free-riding can reduce both the quantity and the quality of agricultural services;  Possible solutions to free-rider problem: 1. Set up coordination mechanisms such as Federal Business Opportunities (FBO’s); 2. Clearly define and adequately enforce property rights: irrelevant in the case of farmer-to-farmer knowledge spillover; John M. Ulimwengu, [email protected]
  52. Overview  Spatial price modeling  Mapping crop calendar 

    Trends and spatial patterns of Ag. Productivity  Spatial production allocation model (SPAM)  Poverty mapping  Mapping livestock from household and census data 62  Arabic spatial  Modeling Farmers’ Agricultural Knowledge Spillover  The Economics of Land Degradation: A Way Forward for An Action-Oriented Global Economic Assessment
  53. Objectives of the IFPRI-ZEF background study  Assess the current

    state of knowledge on Land Degradation and its Economics (ELD)  Propose methodological approaches for an integrated global assessment of ELD  Use case studies to illustrate the proposed ELD approaches  Propose a global partnership for the implementation of a global ELD assessment 63 Ephraim Nkonya, [email protected]
  54. 64 Quite often, the relationship between poverty and land degradation

    is not uniform, but context-specific, which necessitates comprehensive approaches involving SLM packages, rather than isolated SLM options. Land Degradation and Poverty Cartography: Zhe Guo, using Data from Global Land Cover Facility, Tucker et al (2004), NOAA AVHRR NDVI data from GIMMS Ephraim Nkonya, [email protected]
  55. Variable Resolution Baseline End line Source of data NDVI 8km

    x 8km 1982–84 2003–06 Global Land Cover Facility (www.landcover.org), Tucker, Pinzon, and Brown 2004); NOAA AVHRR NDVI data from GIMMS Population density 0.5o x 0.5o 1990 2005 CIESIN (2010) 65 Land Degradation and Population Density Ephraim Nkonya, [email protected]
  56. Variable Resolution Baseline End line Source of data NDVI 8km

    x 8km 1982–84 2003–06 Global Land Cover Facility (www.landcover.org), Tucker, Pinzon, and Brown 2004); NOAA AVHRR NDVI data from GIMMS Government effectiveness Country 1996–98 2007–09 Worldwide Governance Indicators: http://info.worldbank.org/governance/wgi/index.asp Land Degradation and Government Effectiveness Ephraim Nkonya, [email protected]
  57.  Is it worth taking action against land degradation? (bench

    marked against Costs of Inaction)  What are the costs of Action against land degradation?  Where and when should Action take place? – Where costs of Action are lowest? – Where cost of Inaction are highest? – Where the impact on human well-being is highest? – Prevention is better than cure 67 Costs of Action vs Costs of Inaction Ephraim Nkonya, [email protected]