Upgrade to Pro — share decks privately, control downloads, hide ads and more …

Circular Leverage in Bank-NBFI Synthetic Risk T...

Circular Leverage in Bank-NBFI Synthetic Risk Transfer Networks

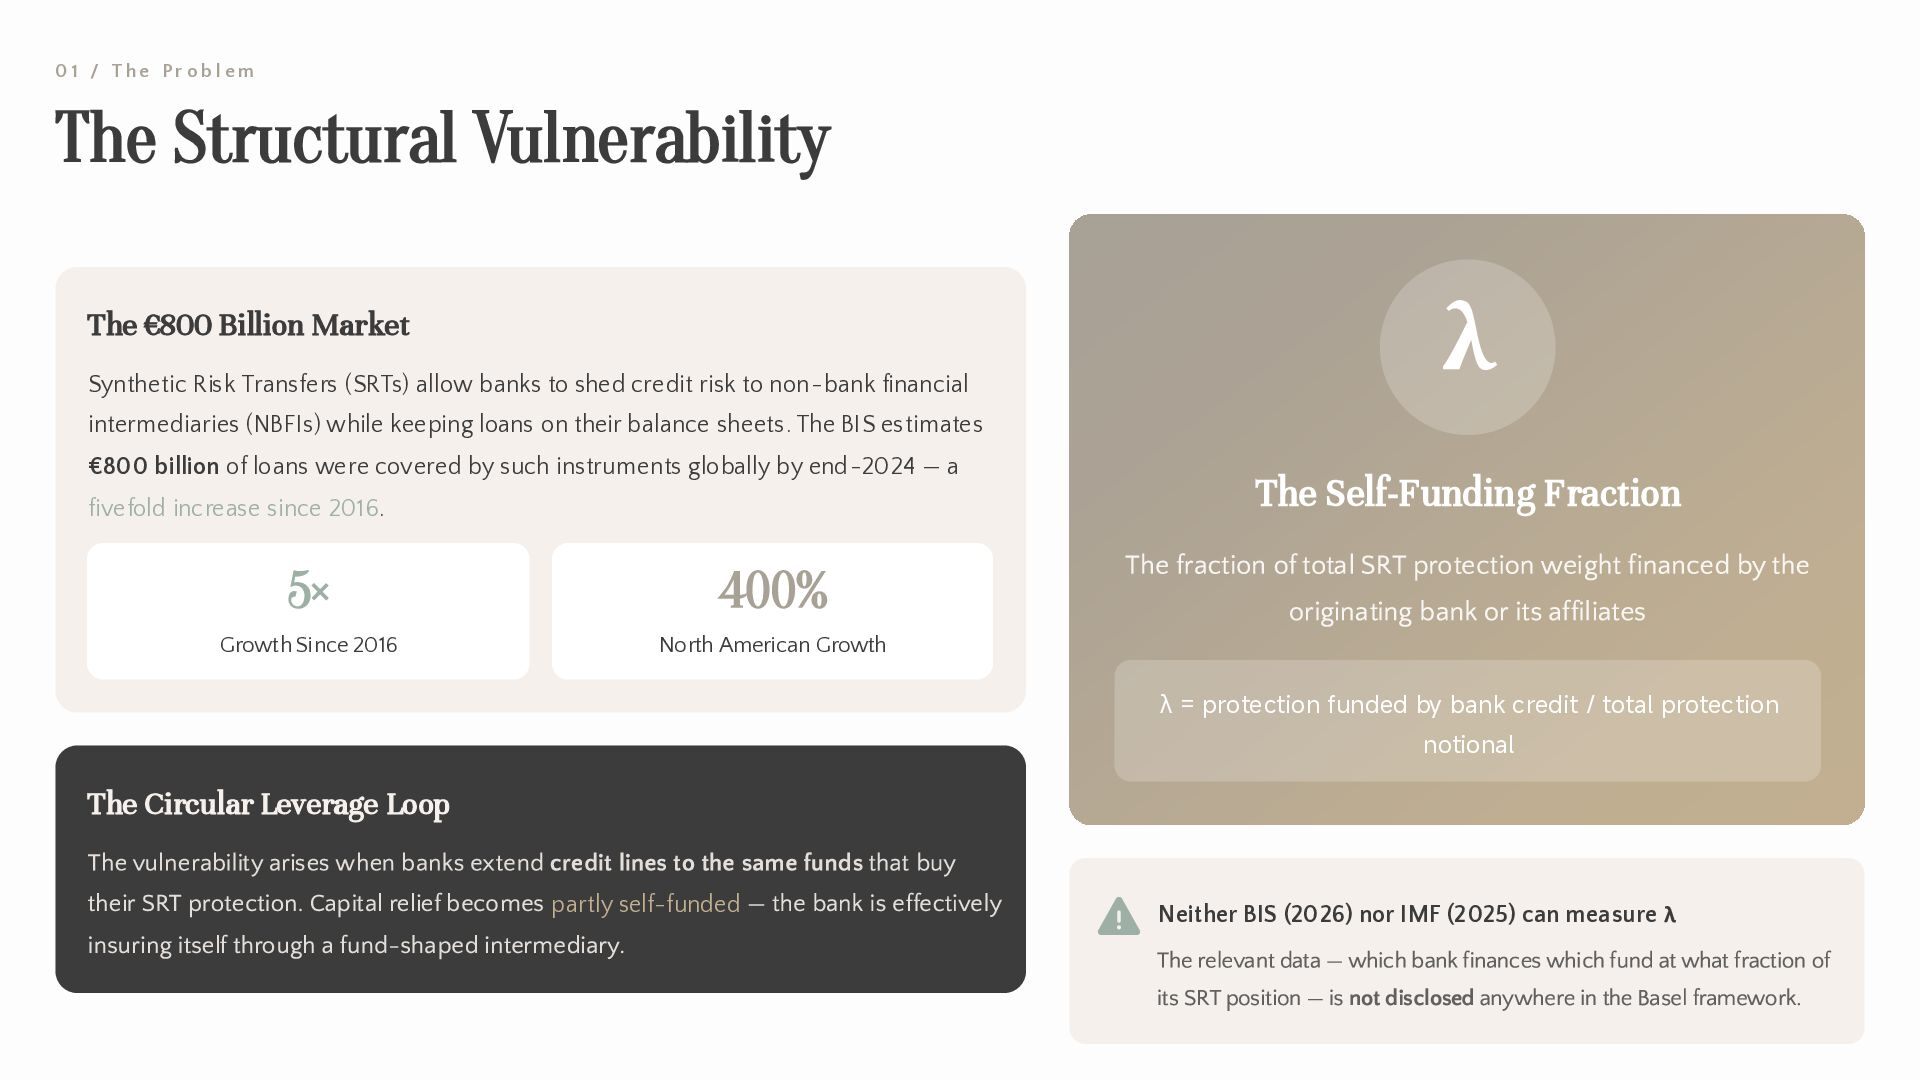
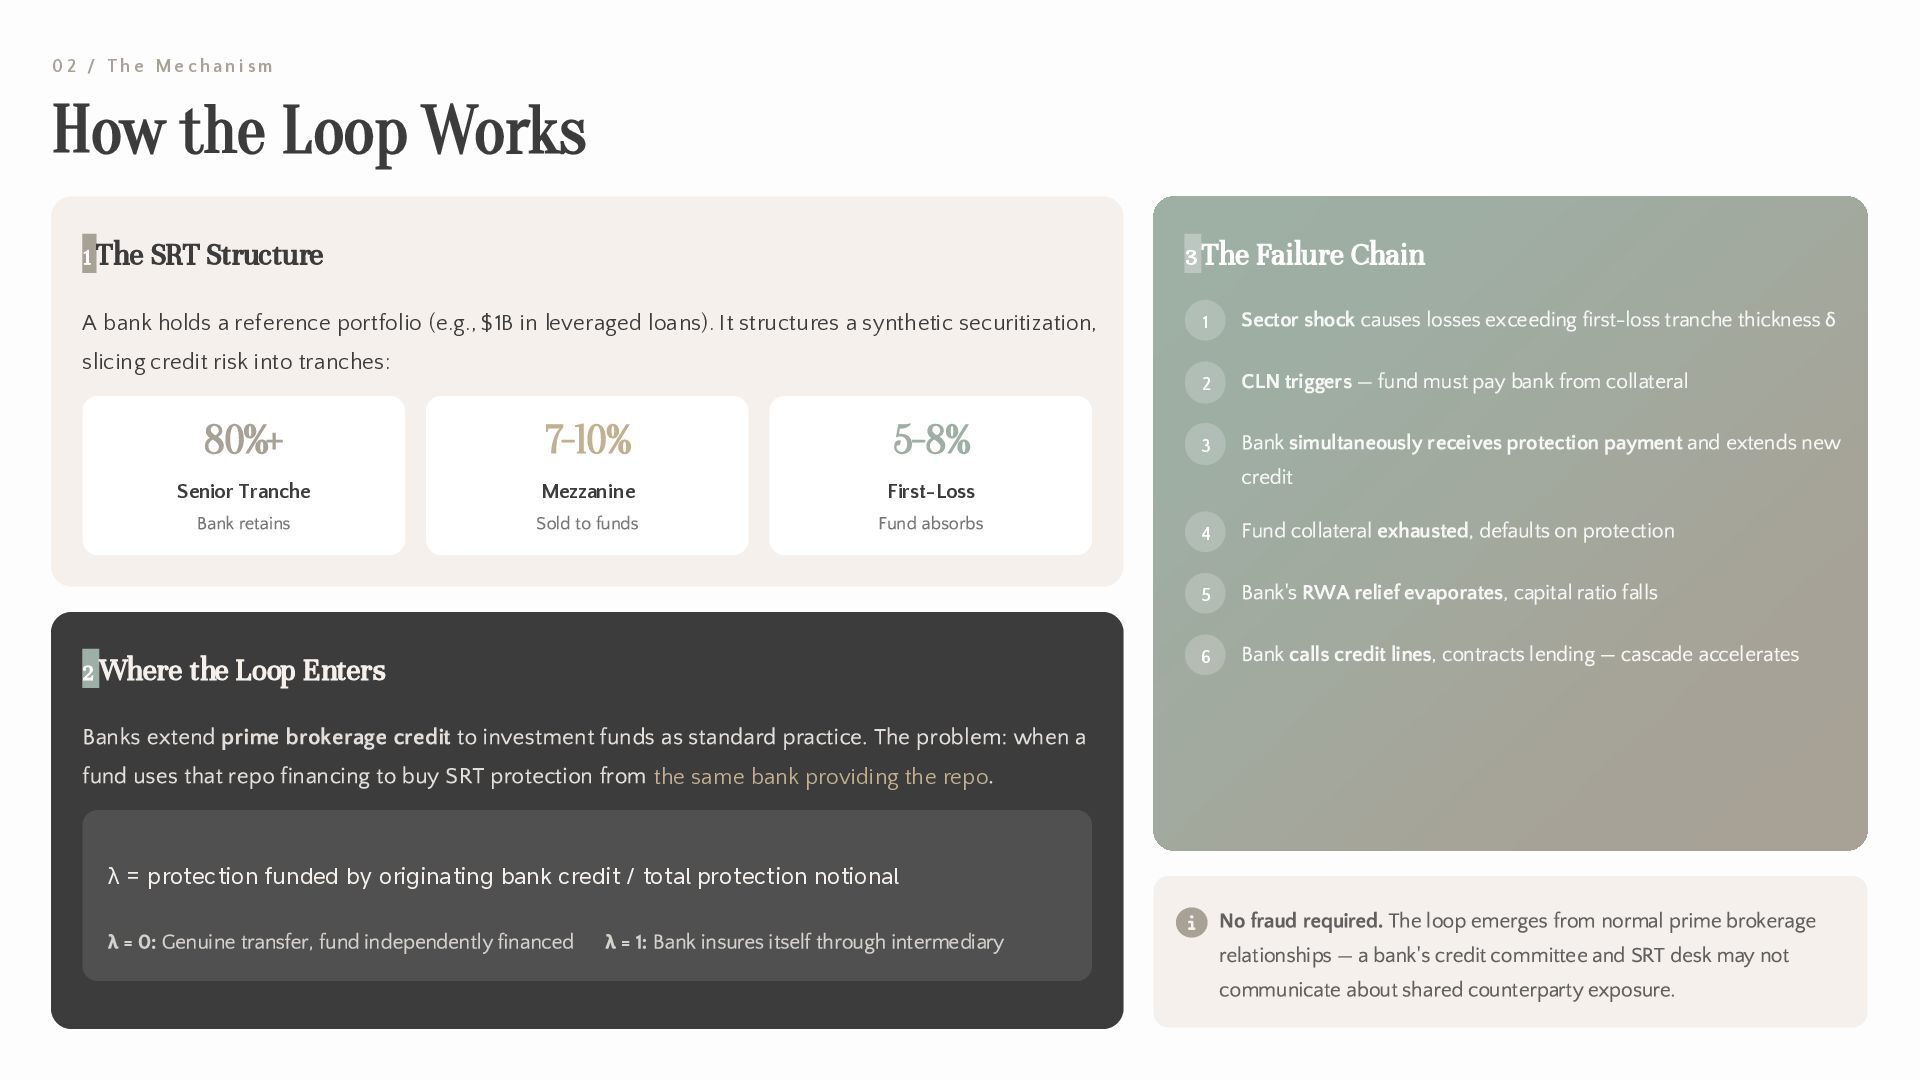
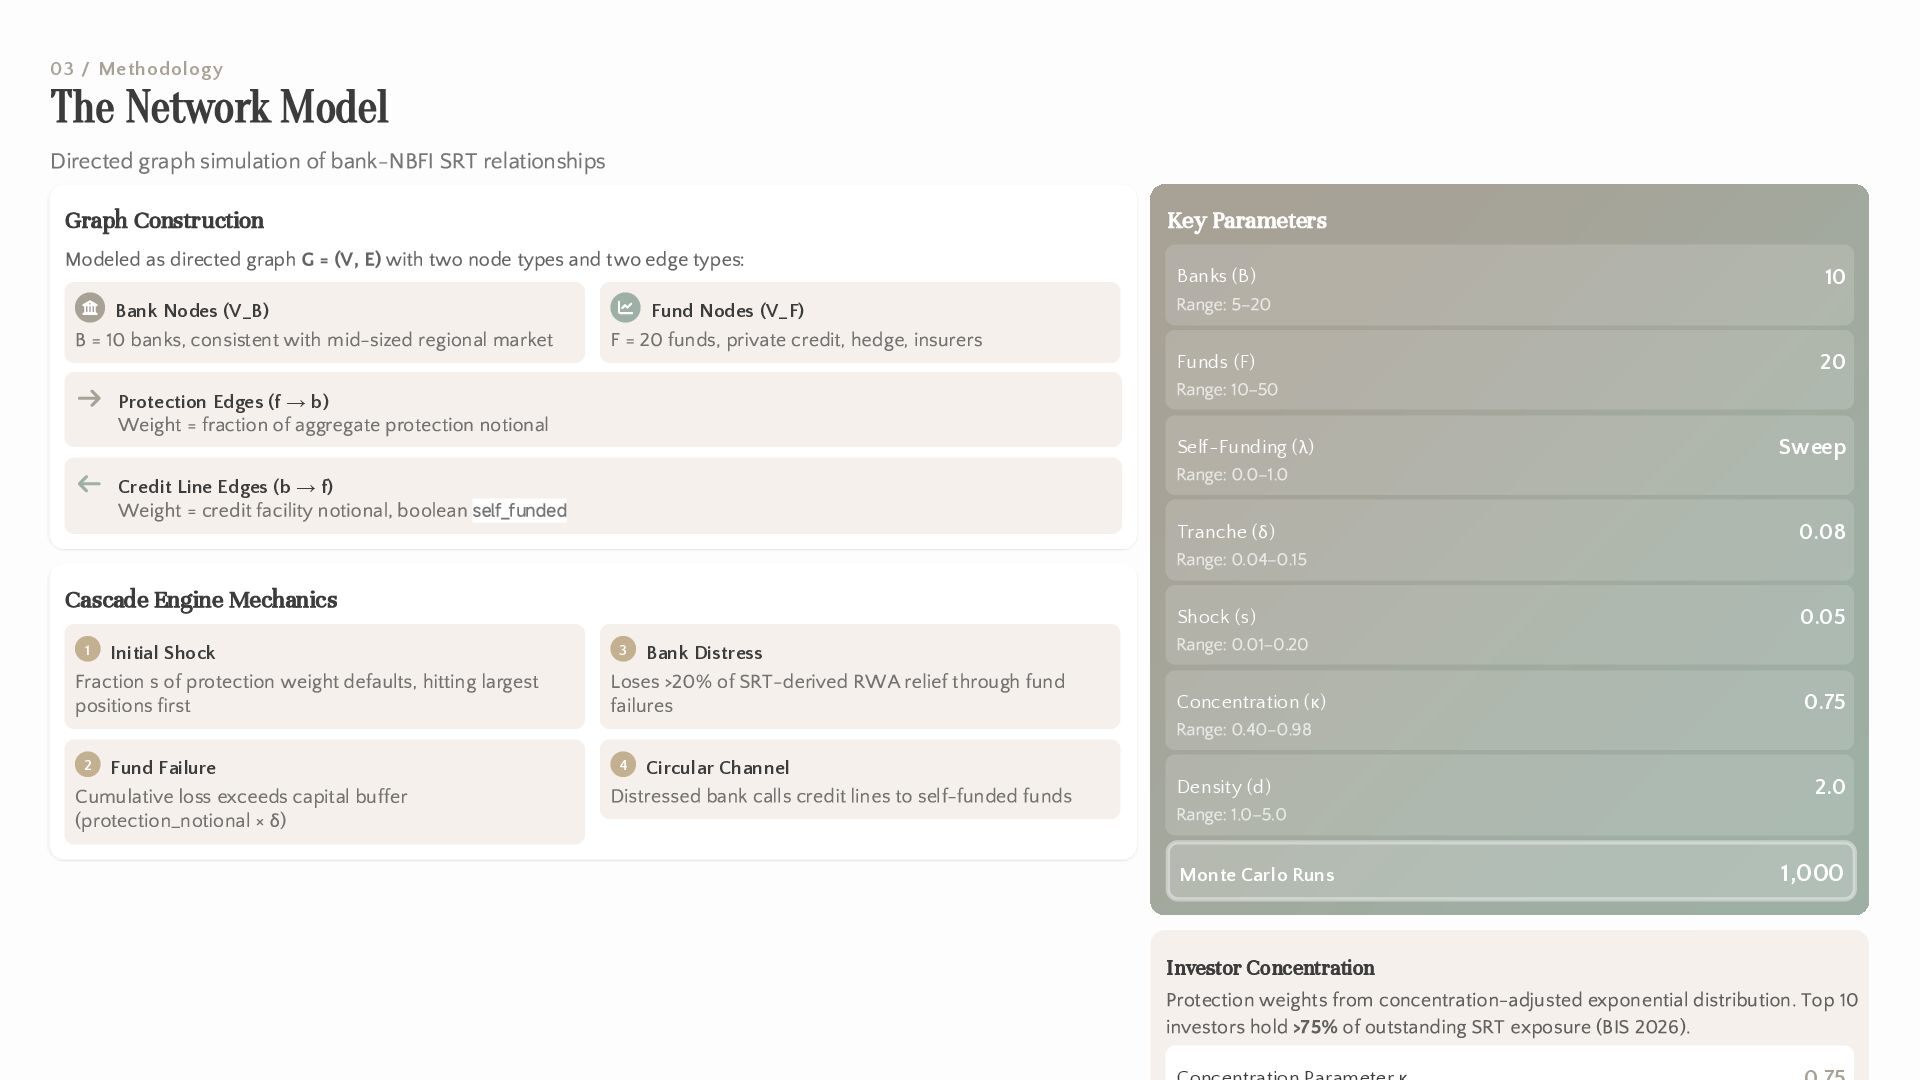
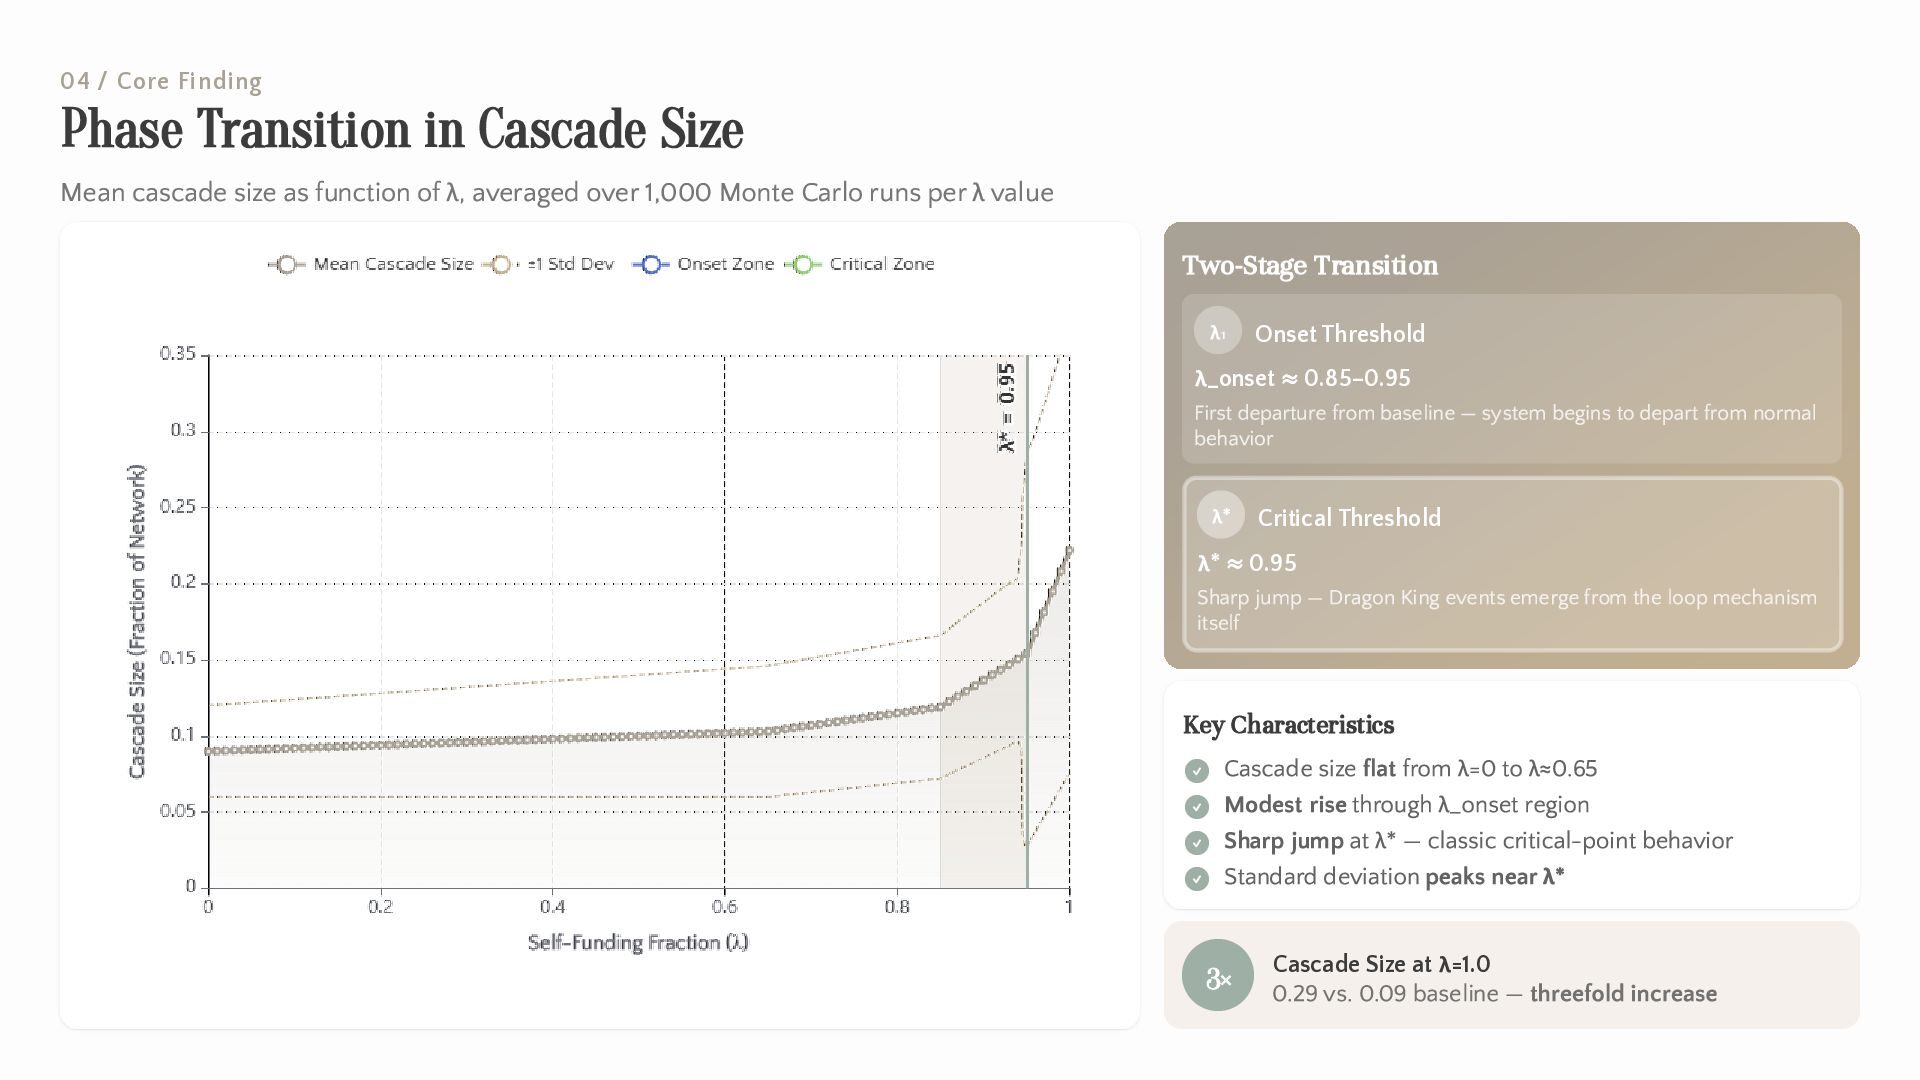
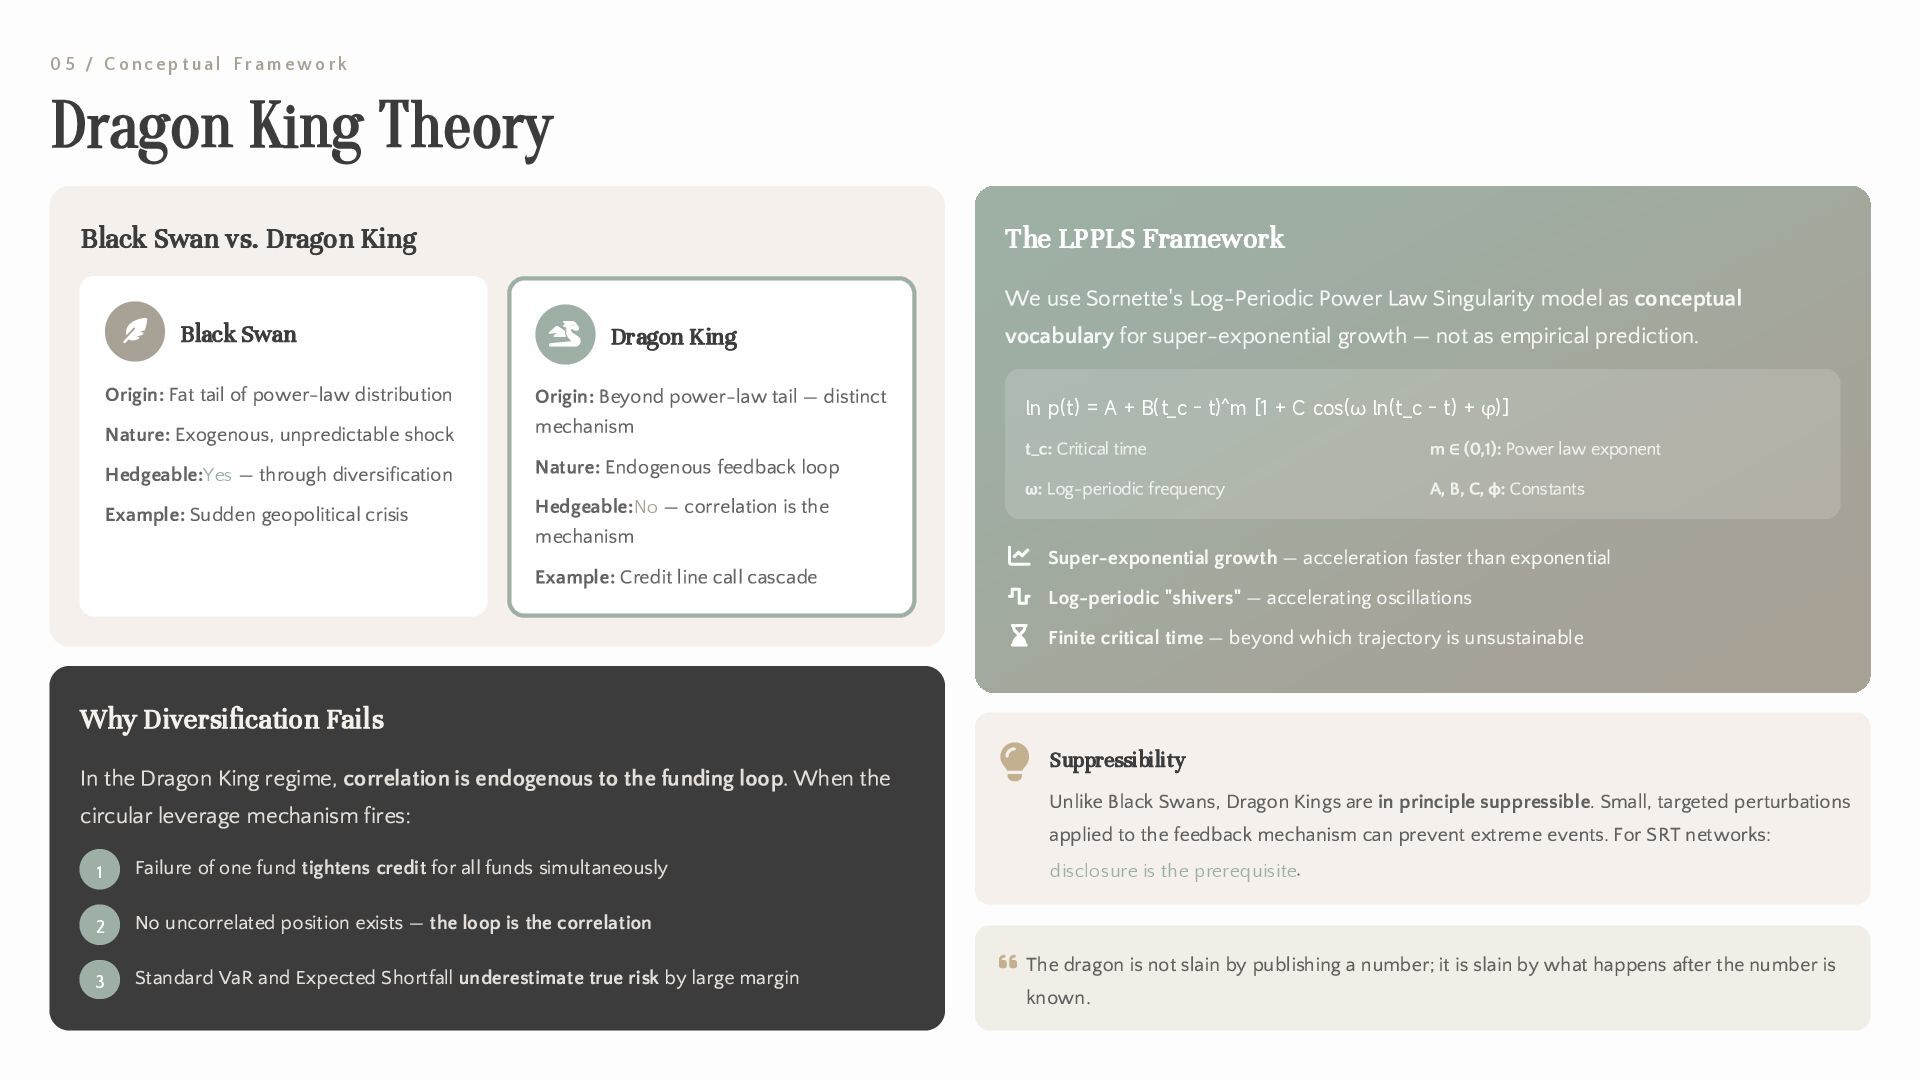
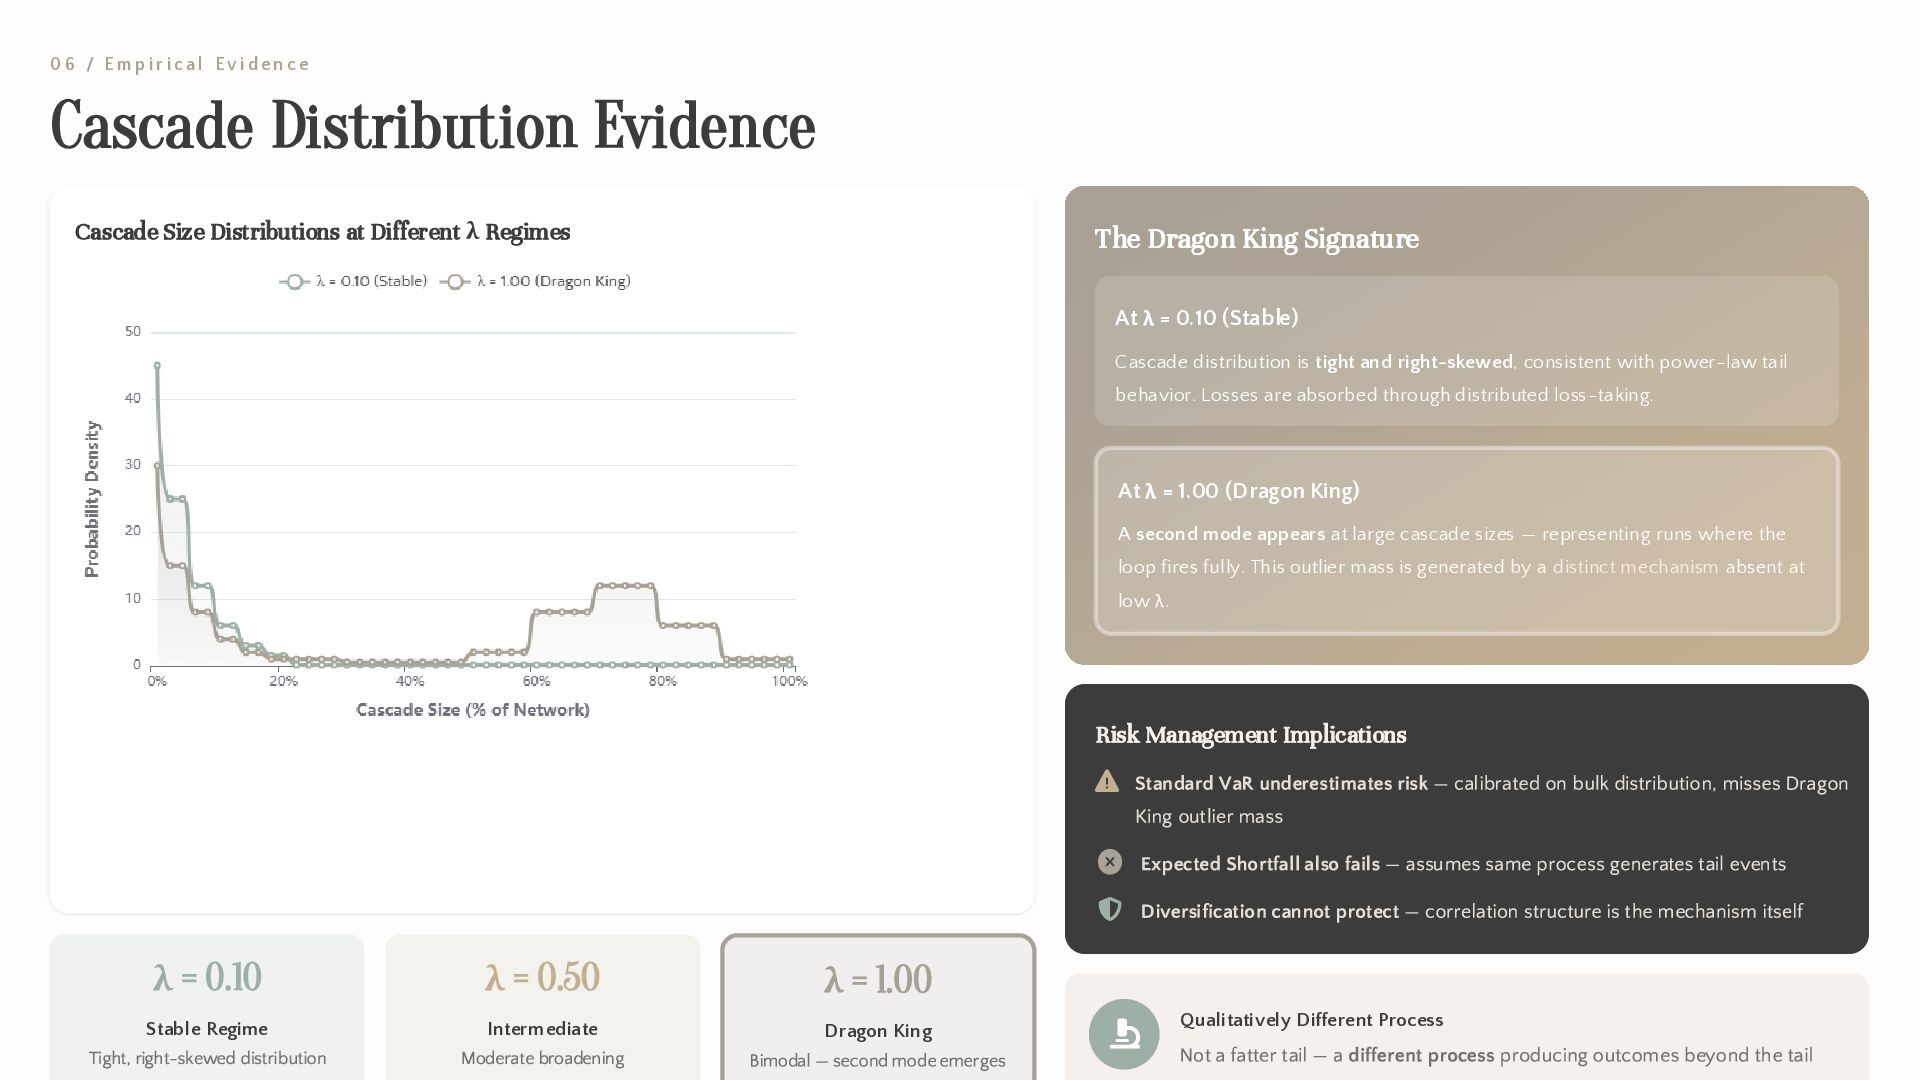
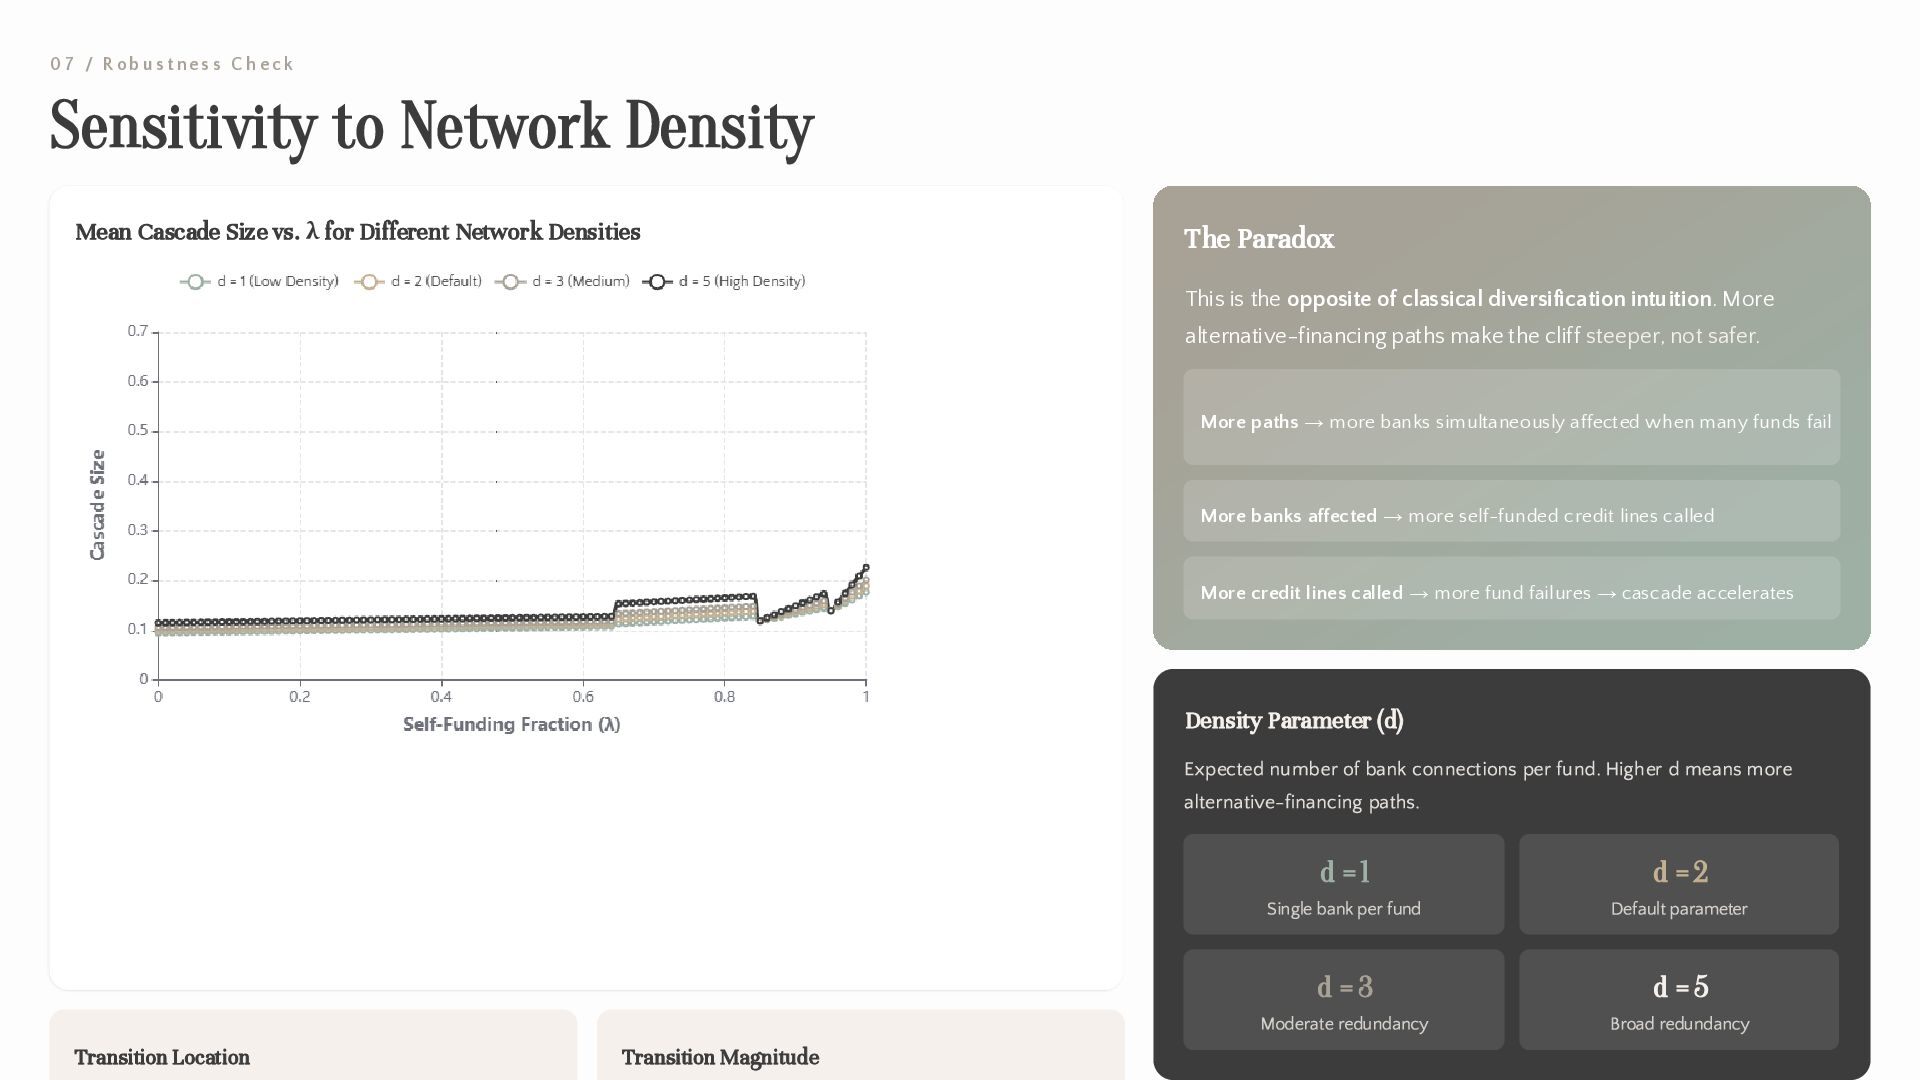
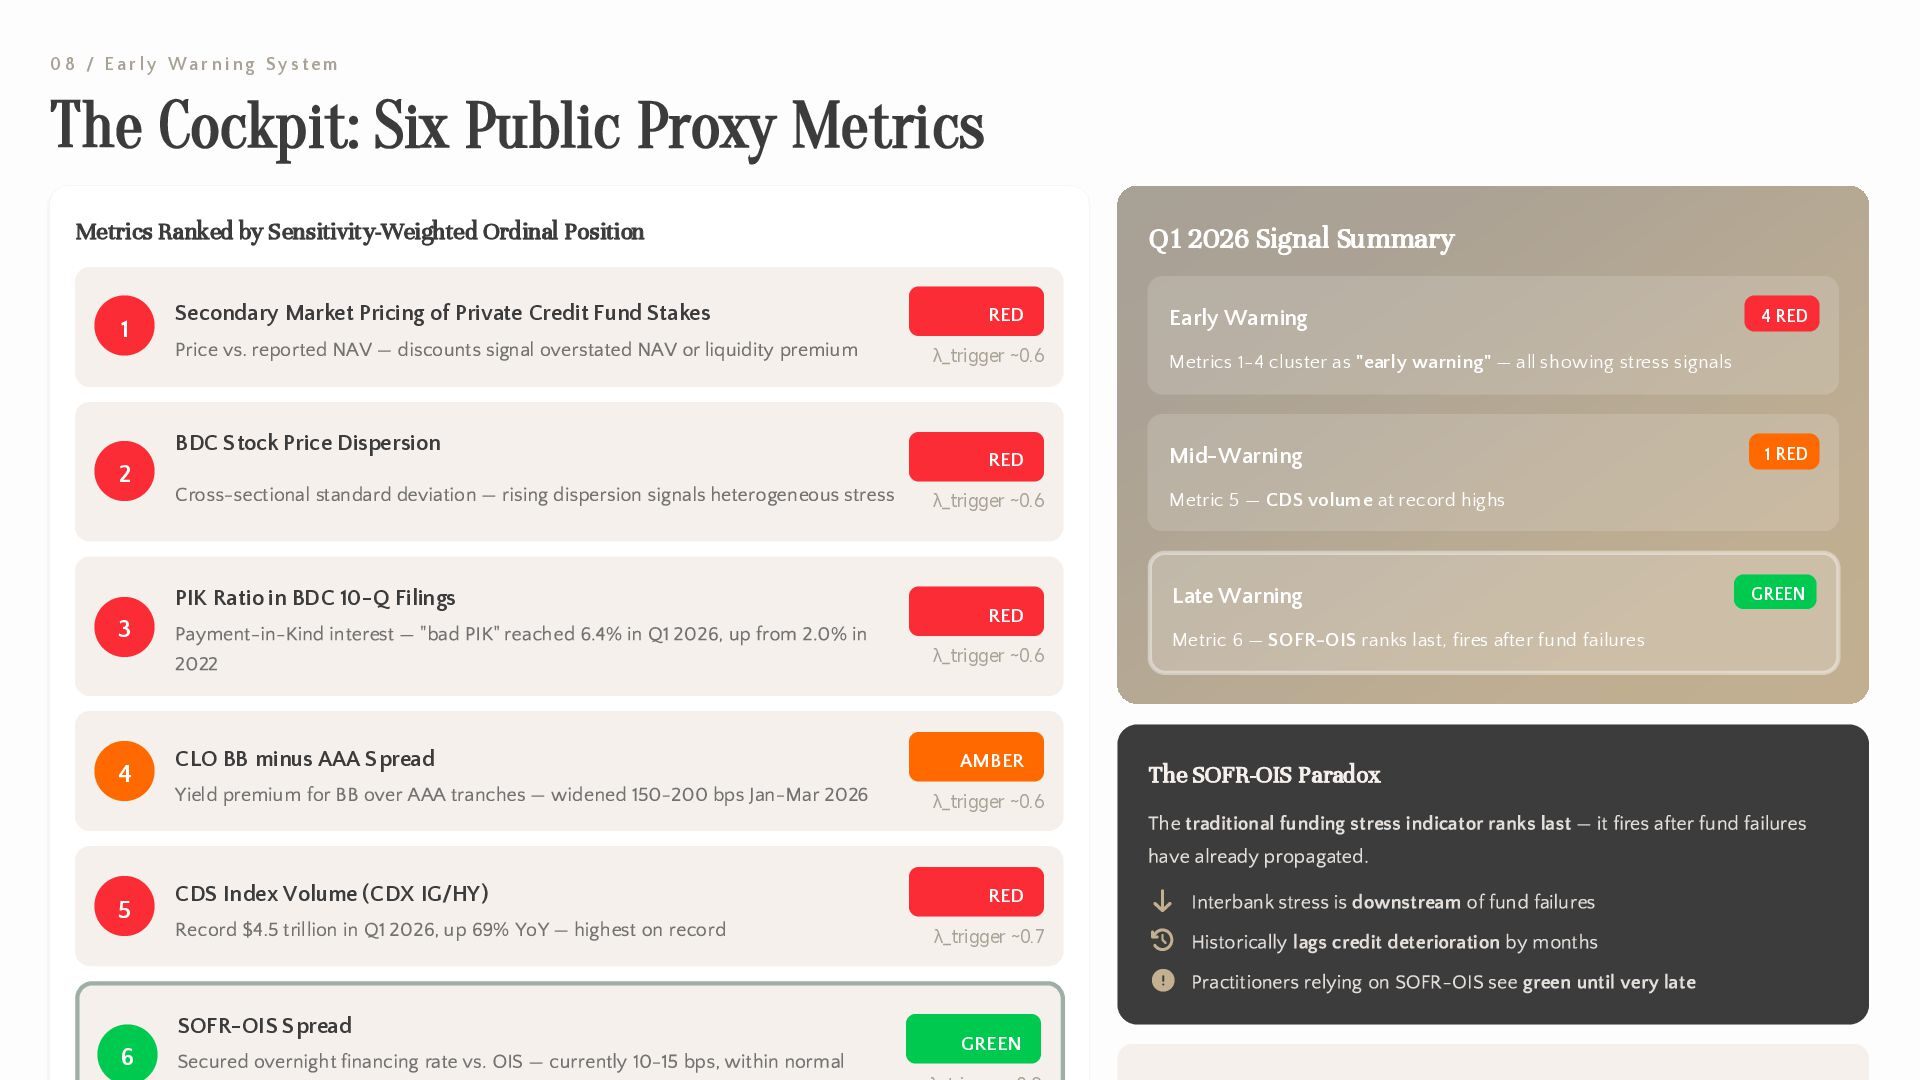
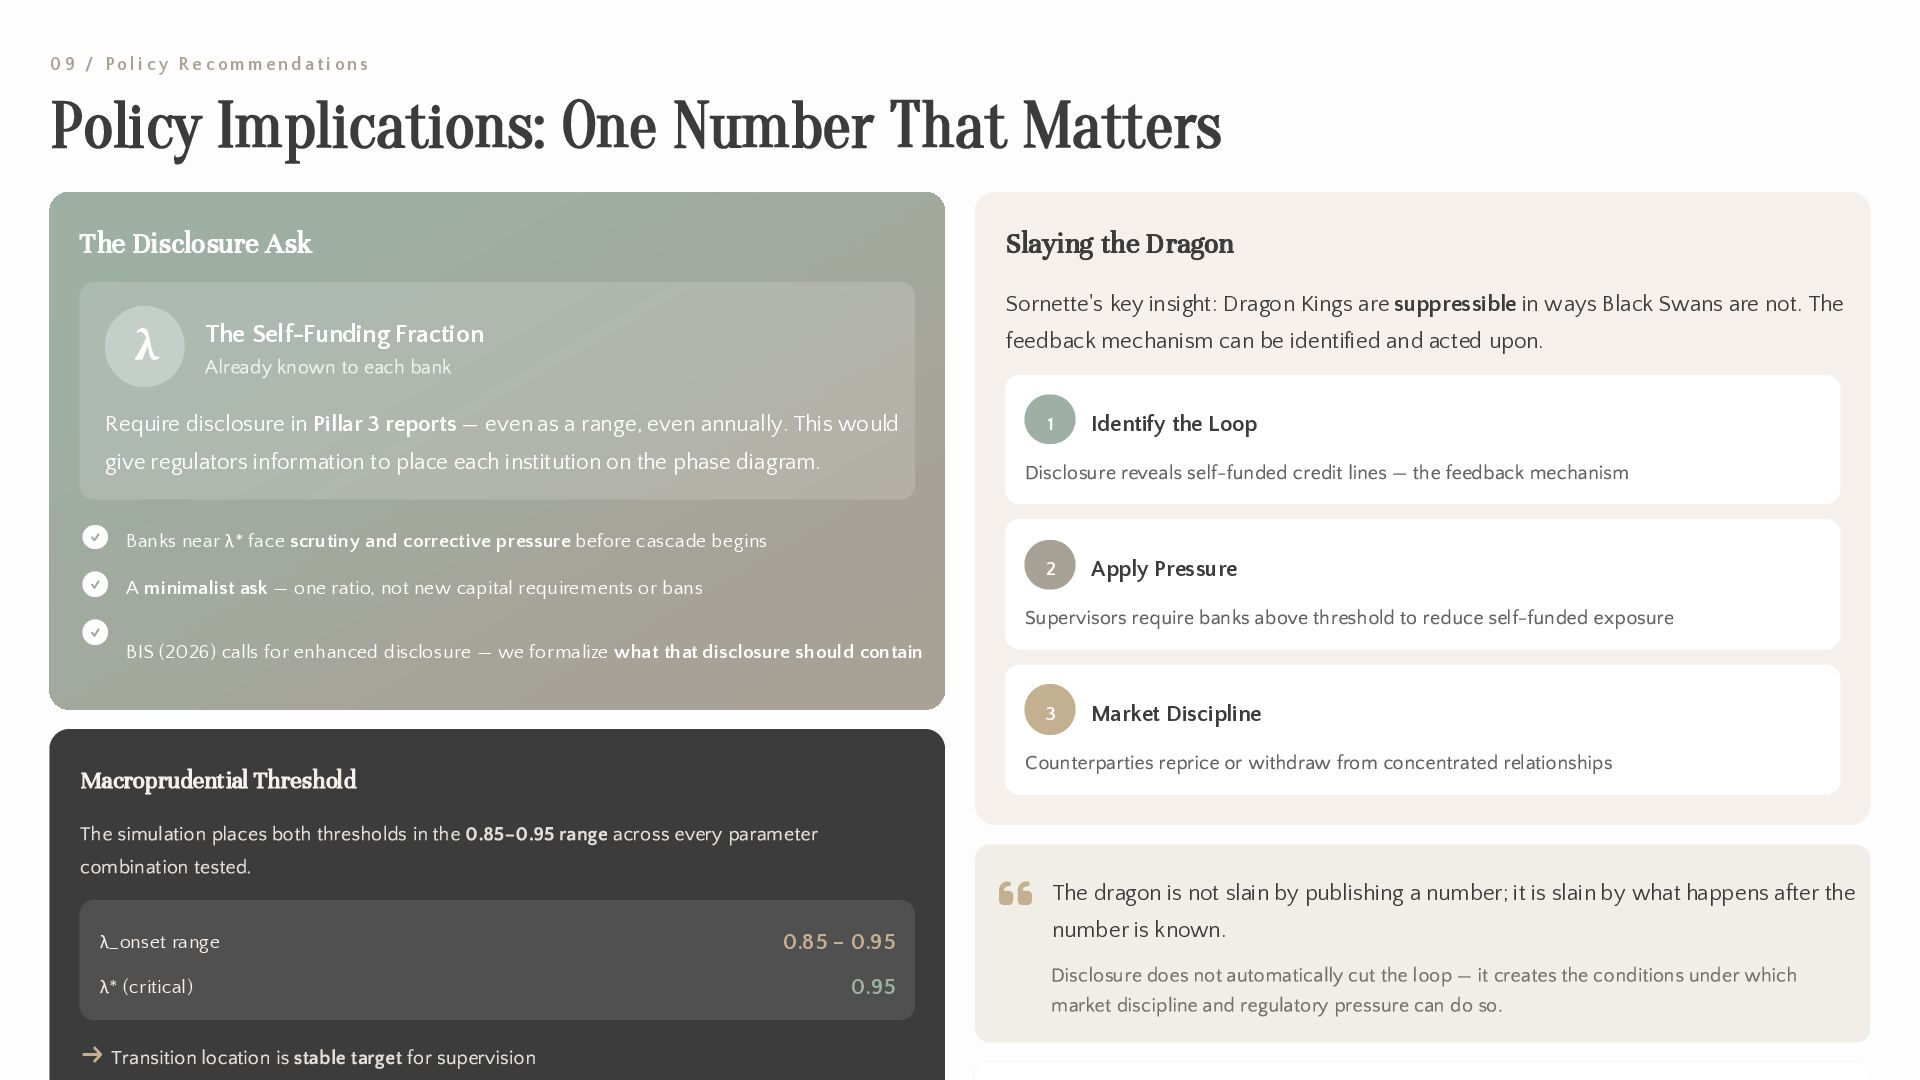
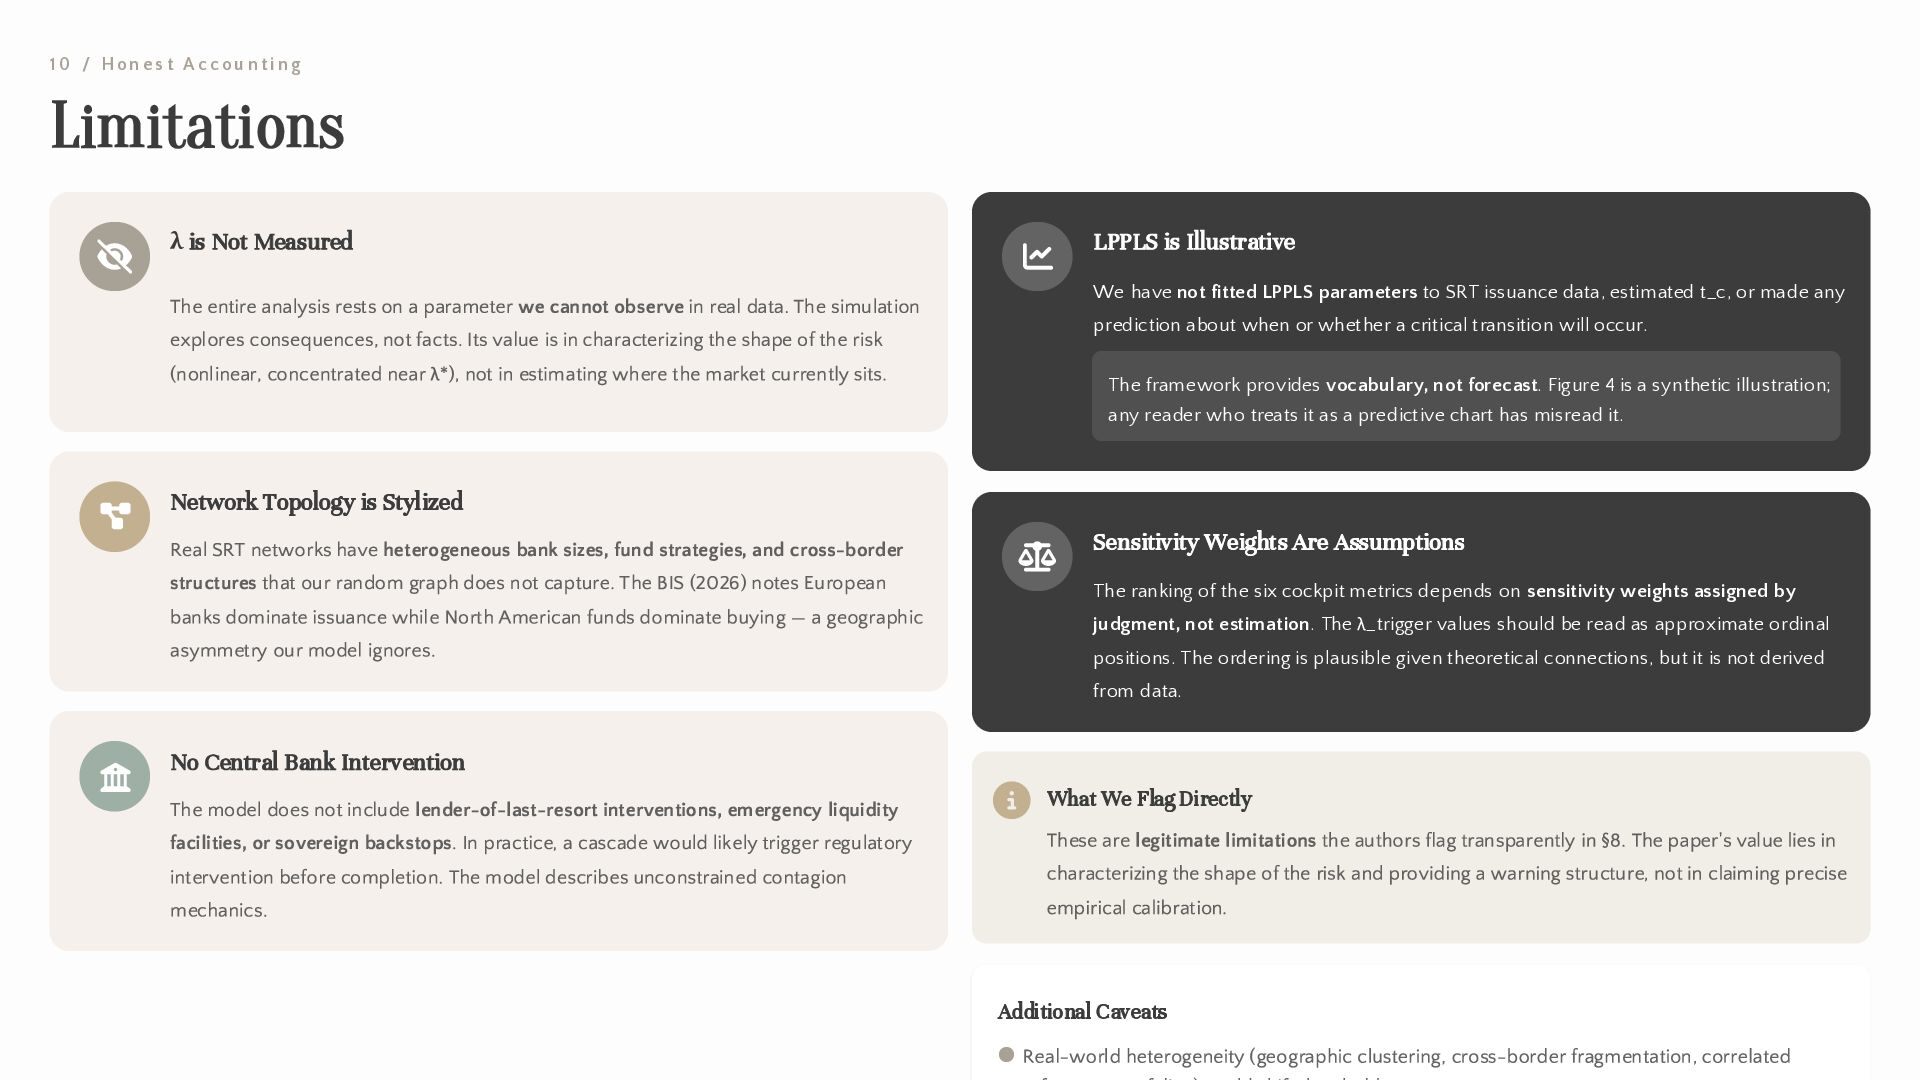
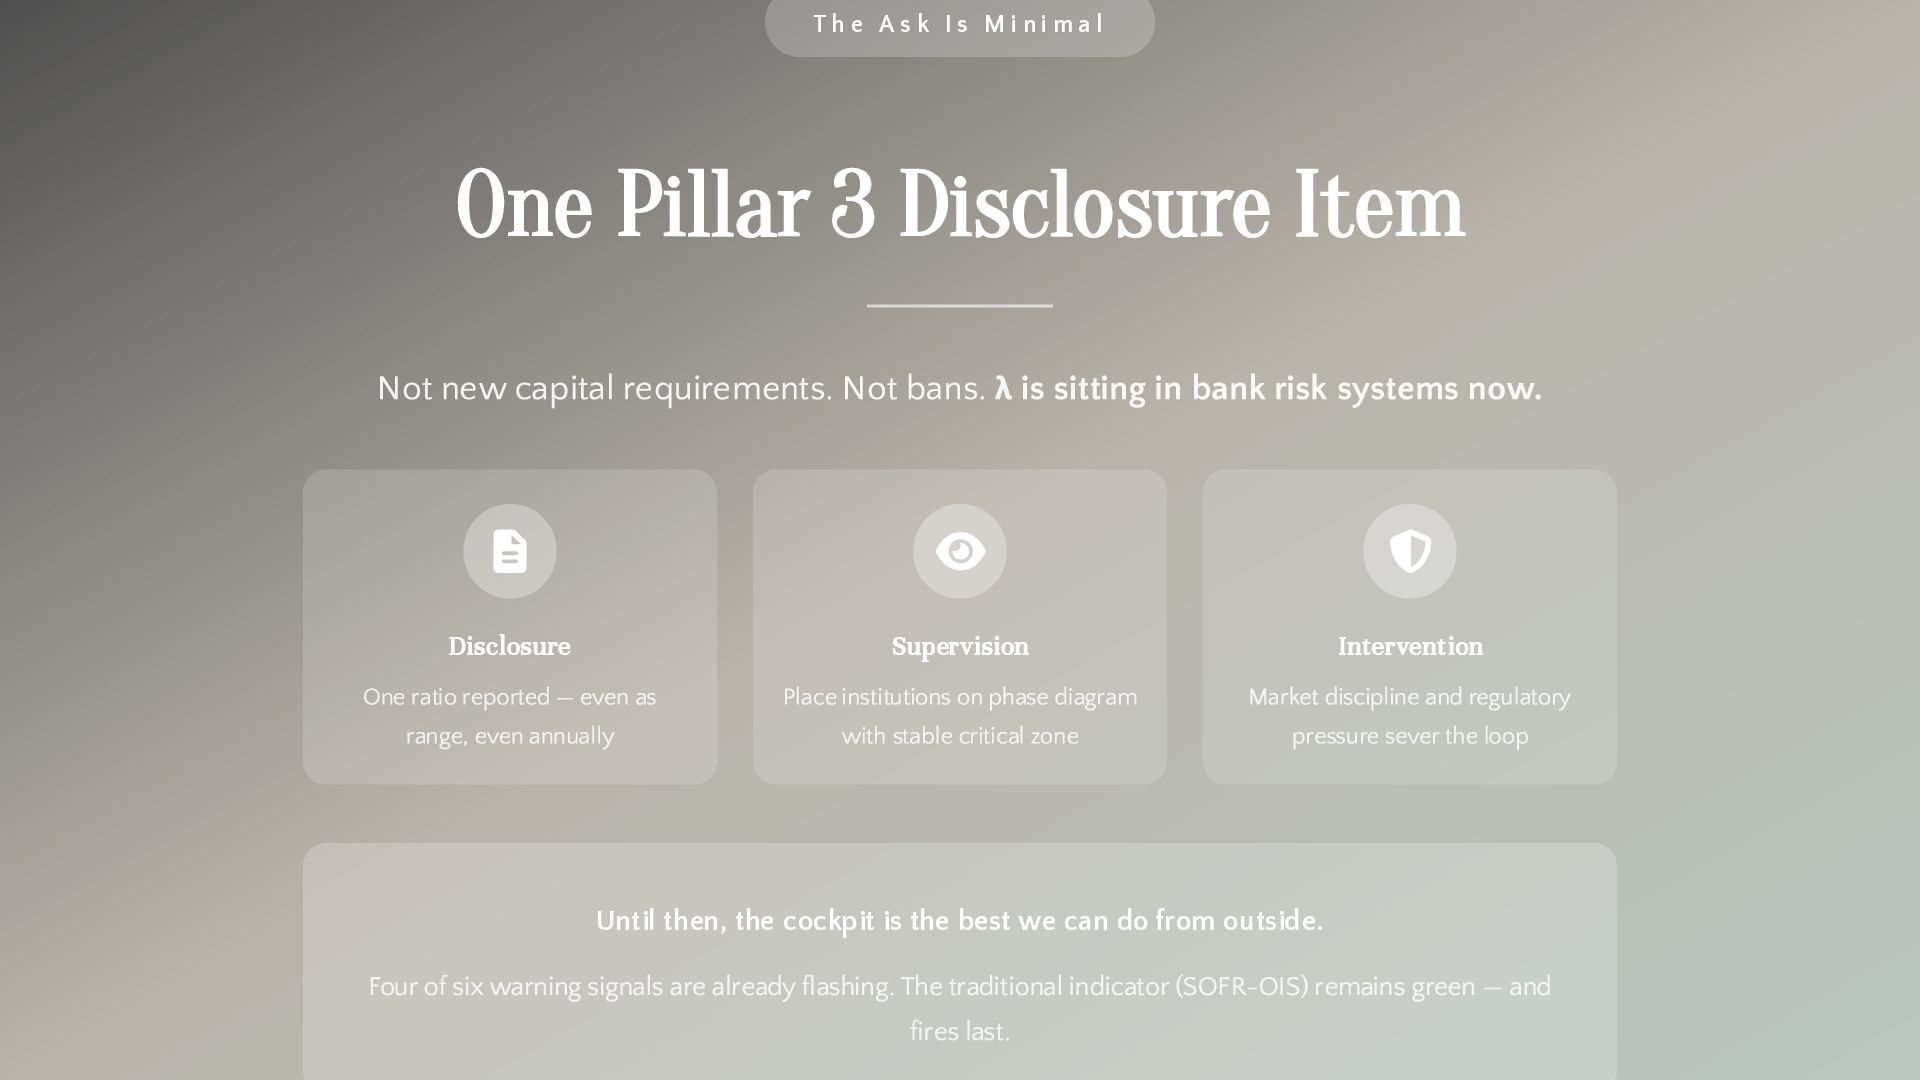
Synthetic Risk Transfers (SRTs) let banks shed credit risk to non-bank financial intermediaries (NBFIs) while keeping the underlying loans on their balance sheets. A structural vulnerability arises when the same banks extend credit lines to the funds that buy their SRT protection, creating a circular leverage loop in which the capital relief is partly self-funded. We formalize this loop as a single parameter, λ, the fraction of total SRT protection weight financed by the originating bank or its affiliates. Using a directed network model of bank-NBFI SRT relationships, we simulate contagion cascades across 1,000 random network realizations for each λ value. The simulation shows a two-stage phase transition: cascade size first departs meaningfully from its baseline at $λ_{onset}$ ≈ 0.85–0.95 (the exact position depends on network density), then jumps sharply at λ* ≈ 0.95 where Dragon King events emerge from the loop mechanism itself. The transition *location* is invariant across network density, investor concentration, shock size, and tranche thickness; what density controls is cascade *magnitude* at high λ, which scales from 0.18 to 0.61 across the tested range. Because λ is not disclosed, we cannot place the real market on this phase diagram. Instead, we propose six publicly observable proxy metrics, computable without proprietary data, ranked by sensitivity-weighted ordinal position relative to λ*. The ranking uses judgment-assigned sensitivity weights and should be read as ordinal. We use the Log-Periodic Power Law Singularity (LPPLS) framework as conceptual vocabulary for the super-exponential growth of SRT issuance observed since 2016, without fitting LPPLS parameters to data or predicting a critical time. As of Q1 2026, four of six proxy metrics show stress signals; the one metric most practitioners watch, SOFR-OIS, does not. One number, λ, would let supervisors place banks on the phase diagram. It is already known to each originating bank and is not reported. Simulation code is released under MIT license.

**Keywords:** synthetic risk transfer, circular leverage, network contagion, phase transition, Dragon King, LPPLS, private credit, systemic risk

Avatar for dyb

dyb PRO

April 27, 2026

Resources

More Decks by dyb

Other Decks in Research

Transcript

  1. F i n a n c i a l N

    e t w o r k C o n t a g i o n R e s e a r c h Circular Leverage in Bank-NBFI Synthetic Risk Transfer Networks When banks finance the funds that buy their own protection, capital relief becomes self-funded — and the system approaches a phase transition. Daniyel Yaacov Bilar Chokmah LLC 17 April 2026 ׳ל ן ָסיִנ ְּ ב ו״פשת
  2. 0 1 / T he P r ob l e

    m The Structural Vulnerability The €800 Billion Market Synthetic Risk Transfers (SRTs) allow banks to shed credit risk to non-bank financial intermediaries (NBFIs) while keeping loans on their balance sheets. The BIS estimates €800 billion of loans were covered by such instruments globally by end-2024 — a fivefold increase since 2016. 5× Growth Since 2016 400% North American Growth The Circular Leverage Loop partly self-funded λ The Self-Funding Fraction λ = protection funded by bank credit / total protection notional Neither BIS (2026) nor IMF (2025) can measure λ
  3. 0 2 / T h e M e c h

    a n i sm How the Loop Works 1 The SRT Structure A bank holds a reference portfolio (e.g., $1B in leveraged loans). It structures a synthetic securitization, slicing credit risk into tranches: 80%+ Senior Tranche 7-10% Mezzanine 5-8% First-Loss 2 Where the Loop Enters the same bank providing the repo λ = protection funded by originating bank credit / total protection notional 3 The Failure Chain 1 2 3 4 5 6
  4. 03 / Methodology The Network Model Graph Construction Bank Nodes

    (V_B) Fund Nodes (V_F) Protection Edges (f → b) Credit Line Edges (b → f) Cascade Engine Mechanics 1 Initial Shock 2 Fund Failure 3 Bank Distress 4 Circular Channel Key Parameters Banks (B) 10 Funds (F) 20 Self-Funding (λ) Sweep Tranche (δ) 0.08 Shock (s) 0.05 Concentration (κ) 0.75 Density (d) 2.0 Monte Carlo Runs 1,000 Investor Concentration
  5. 04 / Core Finding Phase Transition in Cascade Size Two-Stage

    Transition λ₁ Onset Threshold λ_onset ≈ 0.85–0.95 λ* Critical Threshold λ* ≈ 0.95 Key Characteristics 3× Cascade Size at λ=1.0
  6. 0 5 / C o nc e p t ua

    l F r a m e w o rk Dragon King Theory Black Swan vs. Dragon King Black Swan Yes Dragon King No Why Diversification Fails 1 2 3 The LPPLS Framework ln p(t) = A + B(t_c - t)^m [1 + C cos(ω ln(t_c - t) + φ)] Suppressibility disclosure is the prerequisite
  7. 0 6 / E m p i r i c

    a l Ev i d e n c e Cascade Distribution Evidence Cascade Size Distributions at Different λ Regimes λ = 0.10 Stable Regime λ = 0.50 Intermediate λ = 1.00 Dragon King The Dragon King Signature At λ = 0.10 (Stable) Cascade distribution is tight and right-skewed, consistent with power-law tail behavior. Losses are absorbed through distributed loss-taking. At λ = 1.00 (Dragon King) A second mode appears at large cascade sizes — representing runs where the loop fires fully. This outlier mass is generated by a distinct mechanism absent at low λ. Risk Management Implications Qualitatively Different Process
  8. 0 7 / R ob u st ne s s

    C h e c k Sensitivity to Network Density Mean Cascade Size vs. λ for Different Network Densities Transition Location Transition Magnitude The Paradox This is the opposite of classical diversification intuition. More alternative-financing paths make the cliff steeper, not safer. More paths → more banks simultaneously affected when many funds fail More banks affected → more self-funded credit lines called More credit lines called → more fund failures → cascade accelerates Density Parameter (d) d = 1 d = 2 d = 3 d = 5
  9. 0 8 / E a r l y Wa r

    n i ng Sy st e m The Cockpit: Six Public Proxy Metrics Metrics Ranked by Sensitivity-Weighted Ordinal Position 1 Secondary Market Pricing of Private Credit Fund Stakes RED λ_trigger ~0.6 2 BDC Stock Price Dispersion RED λ_trigger ~0.6 3 PIK Ratio in BDC 10-Q Filings RED λ_trigger ~0.6 4 CLO BB minus AAA Spread AMBER λ_trigger ~0.6 5 CDS Index Volume (CDX IG/HY) RED λ_trigger ~0.7 6 SOFR-OIS Spread GREEN Q1 2026 Signal Summary Early Warning 4 RED Metrics 1-4 cluster as "early warning" — all showing stress signals Mid-Warning 1 RED Metric 5 — CDS volume at record highs Late Warning GREEN Metric 6 — SOFR-OIS ranks last, fires after fund failures The SOFR-OIS Paradox
  10. 0 9 / Po l i c y Re c

    om m e n d a t i on s Policy Implications: One Number That Matters The Disclosure Ask λ The Self-Funding Fraction Require disclosure in Pillar 3 reports — even as a range, even annually. This would give regulators information to place each institution on the phase diagram. Banks near λ* face scrutiny and corrective pressure before cascade begins A minimalist ask — one ratio, not new capital requirements or bans BIS (2026) calls for enhanced disclosure — we formalize what that disclosure should contain Macroprudential Threshold λ_onset range 0.85 – 0.95 λ* (critical) 0.95 Slaying the Dragon Sornette's key insight: Dragon Kings are suppressible in ways Black Swans are not. The feedback mechanism can be identified and acted upon. 1 Identify the Loop 2 Apply Pressure 3 Market Discipline The dragon is not slain by publishing a number; it is slain by what happens after the number is known.
  11. 1 0 / H on e s t A c

    c ou n t i n g Limitations λ is Not Measured Network Topology is Stylized No Central Bank Intervention LPPLS is Illustrative We have not fitted LPPLS parameters to SRT issuance data, estimated t_c, or made any prediction about when or whether a critical transition will occur. The framework provides vocabulary, not forecast. Figure 4 is a synthetic illustration; any reader who treats it as a predictive chart has misread it. Sensitivity Weights Are Assumptions The ranking of the six cockpit metrics depends on sensitivity weights assigned by judgment, not estimation. The λ_trigger values should be read as approximate ordinal positions. The ordering is plausible given theoretical connections, but it is not derived from data. What We Flag Directly Additional Caveats
  12. T h e A s k I s M i

    n i m a l One Pillar 3 Disclosure Item Disclosure Supervision Intervention Until then, the cockpit is the best we can do from outside.