Upgrade to Pro — share decks privately, control downloads, hide ads and more …

SOC 4650/5650 - Lecture-A - Projections

SOC 4650/5650 - Lecture-A - Projections

Modified lecture for remote learning during Spring 2020.

Christopher Prener

March 30, 2020
Tweet

More Decks by Christopher Prener

Other Decks in Education

Transcript

  1. AGENDA INTRO TO GISC / WEEK 10 / LECTURE A

    1. Front Matter 2. Projections Overview 3. Working with Projections in R 4. Back Matter
  2. ▸ We are used to thinking about earth as a

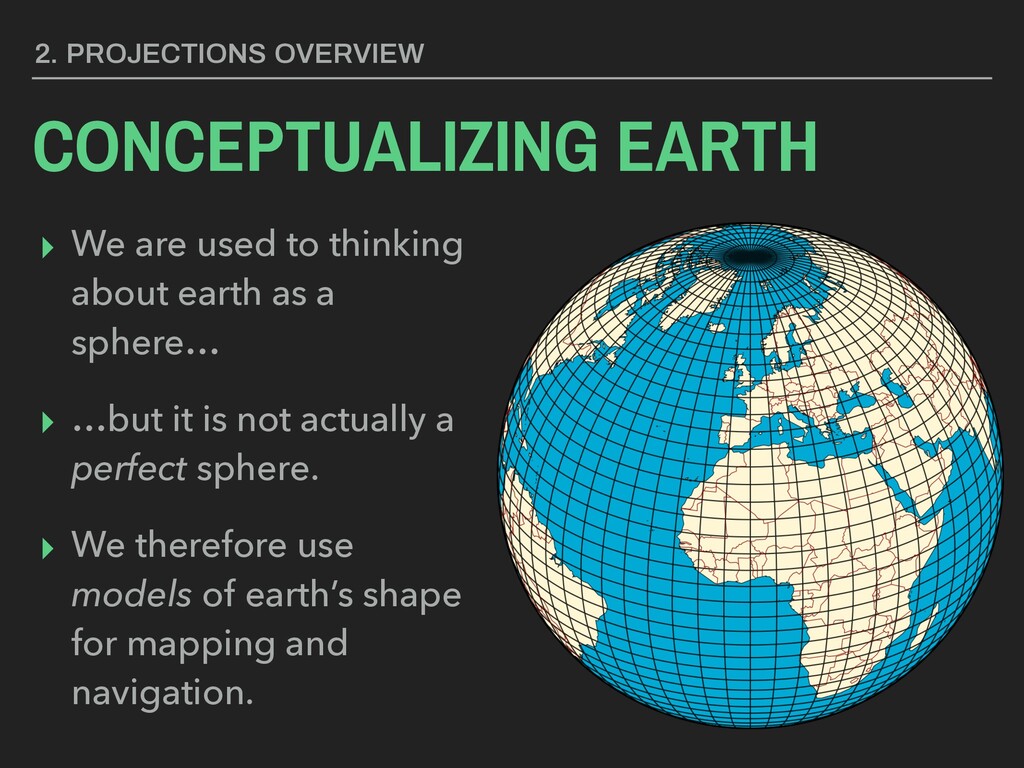
    sphere… ▸ …but it is not actually a perfect sphere. ▸ We therefore use models of earth’s shape for mapping and navigation. 2. PROJECTIONS OVERVIEW CONCEPTUALIZING EARTH
  3. KEY TERM An ellipsoid (or 
 spheroid) is a mathematical


    model depicting the earth
 in a three-dimensional space. GRS 1980 and WGS 1984 are most common. Source: Maher 2010, p. 170
  4. KEY TERM A datum is a collection
 of known locations

    used
 to locate data on an ellipsoid. 
 NAD 1983 and WGS 1984 are two common datums. Source: Maher 2010, p. 171
  5. KEY TERM A geographic coordinate
 system is combination of
 an

    ellipsoid, a datum, a prime meridian, and a specified unit of measure. NAD 1983 and WGS 1984 are two systems. Source: Maher 2010, p. 171
  6. 2. PROJECTIONS OVERVIEW WHY MULTIPLE SYSTEMS? ▸ In attempting to

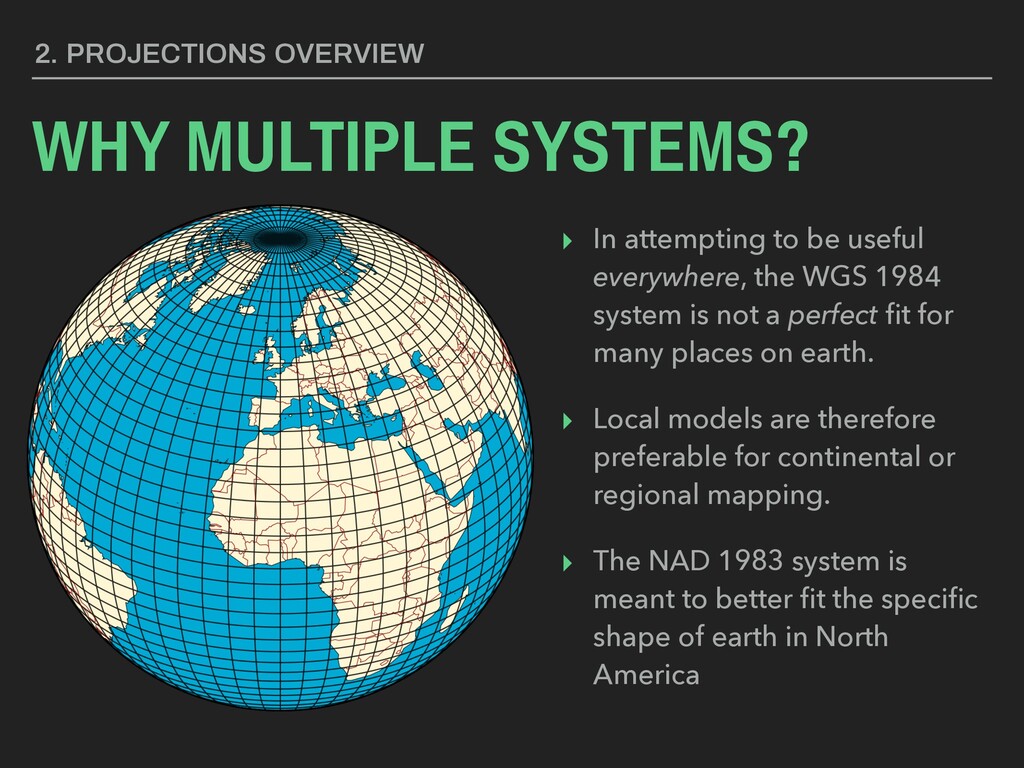
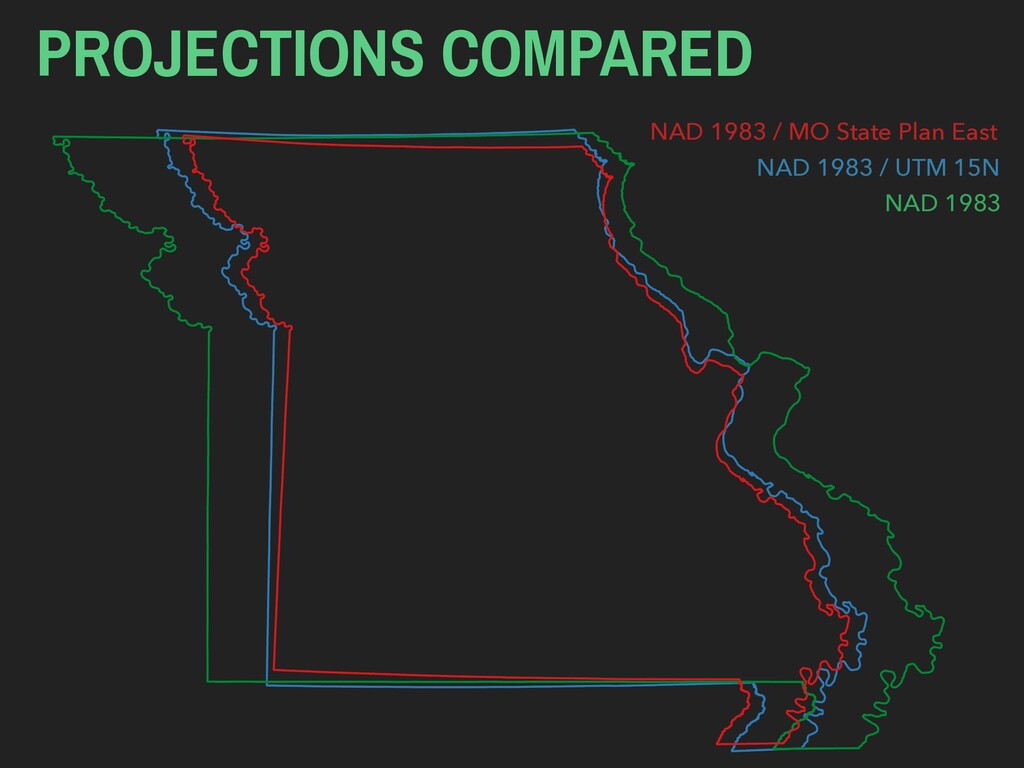
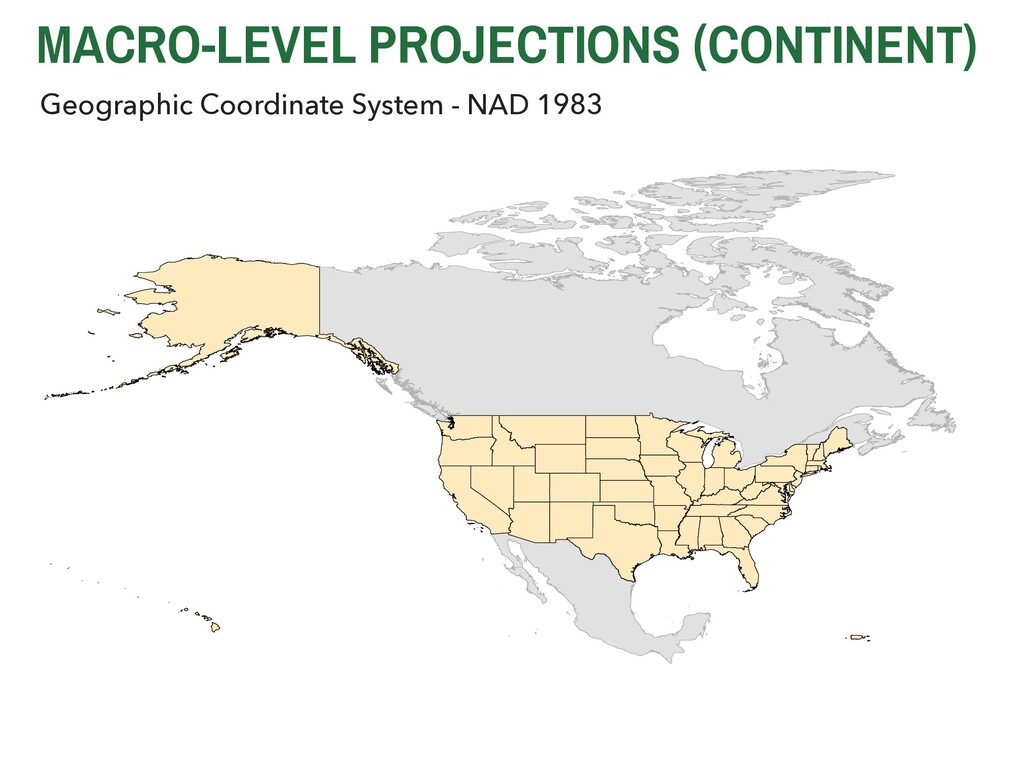
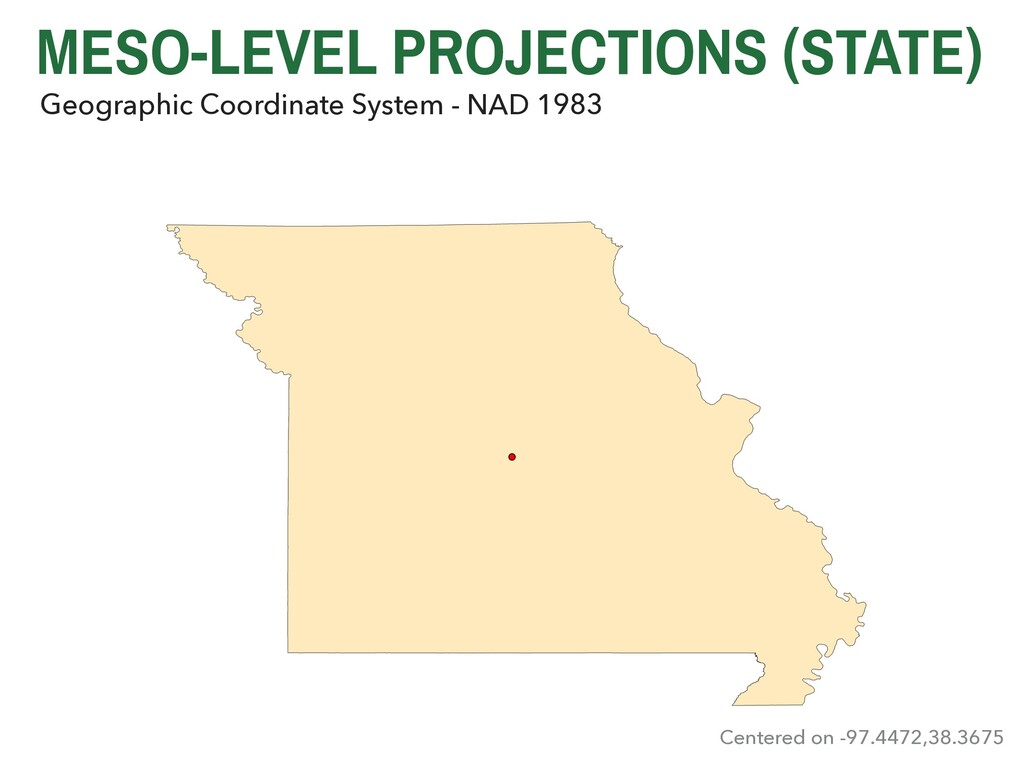
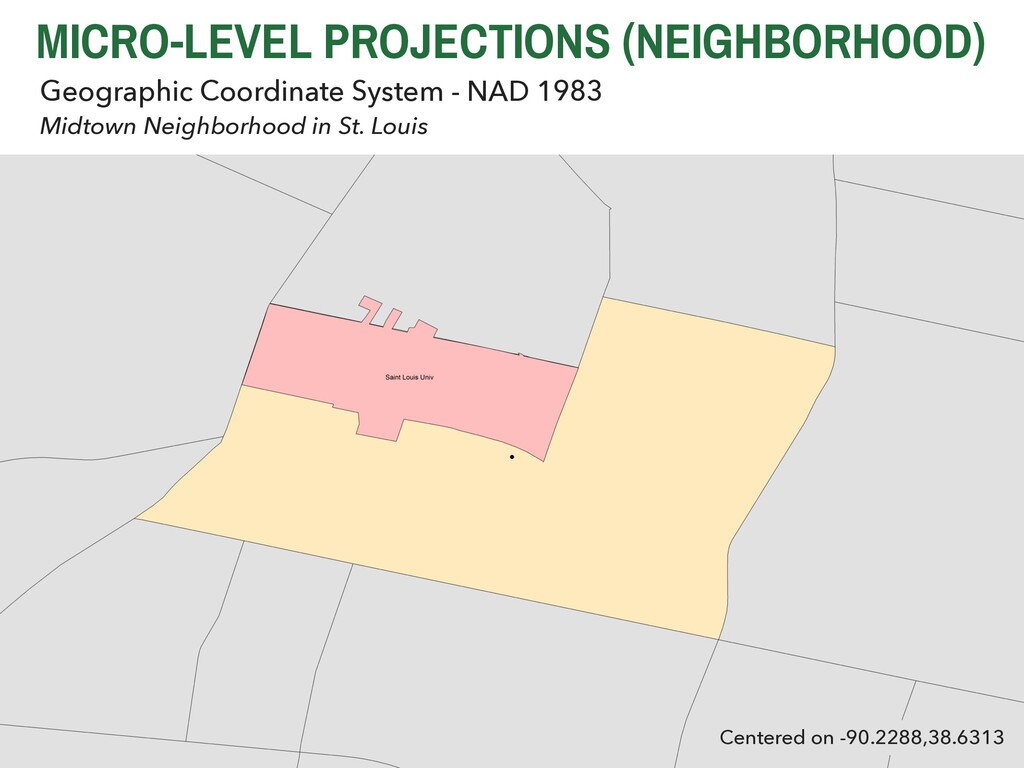
    be useful everywhere, the WGS 1984 system is not a perfect fit for many places on earth. ▸ Local models are therefore preferable for continental or regional mapping. ▸ The NAD 1983 system is meant to better fit the specific shape of earth in North America
  7. 2. PROJECTIONS OVERVIEW BUT MAPS ARE NOT 3D This presents

    a challenge for print and computer mapping, where our surfaces are only capable of conveying two dimensional space.
  8. 2. PROJECTIONS OVERVIEW BUT MAPS ARE NOT 3D However, when

    we transform three dimensional data into two dimensional space, we will inevitably distort them.
  9. ▸ Carl Fredrich Gauss • Born 1777, died 1855 •

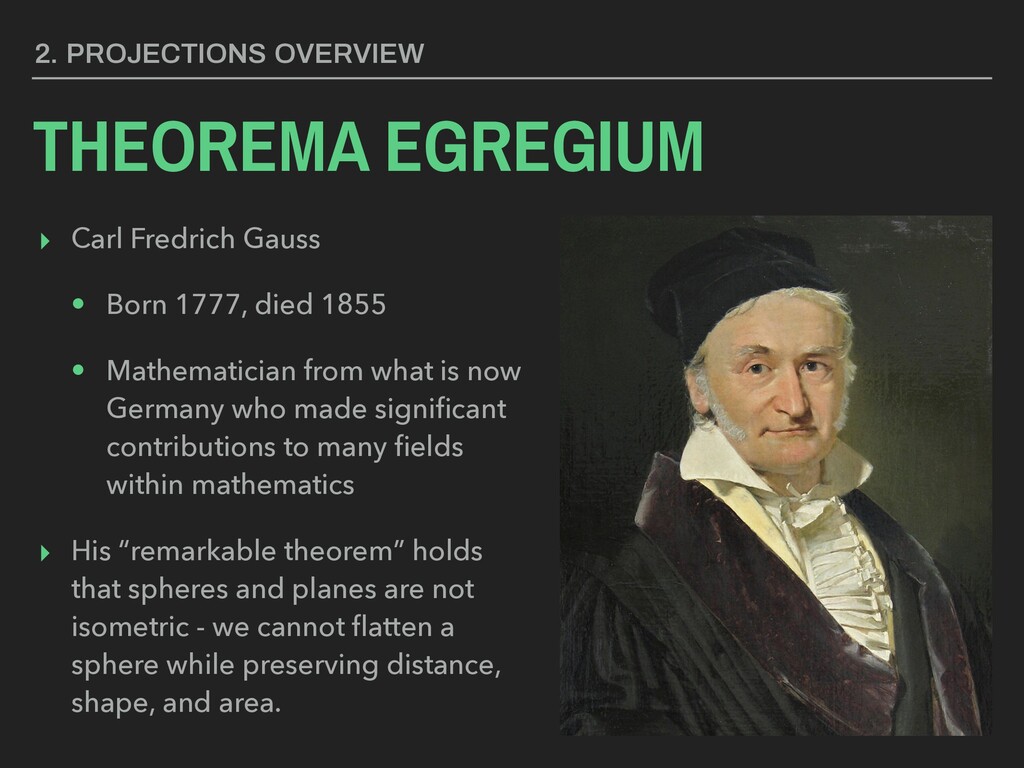
    Mathematician from what is now Germany who made significant contributions to many fields within mathematics ▸ His “remarkable theorem” holds that spheres and planes are not isometric - we cannot flatten a sphere while preserving distance, shape, and area. 2. PROJECTIONS OVERVIEW THEOREMA EGREGIUM
  10. KEY TERM A projected coordinate
 system transforms data so
 that

    they can be mapped in
 two-dimensional space. Source: Maher 2010, p. 174
  11. PROJECTED COORDINATE SYSTEMS ▸ Projections have properties that they prioritize:

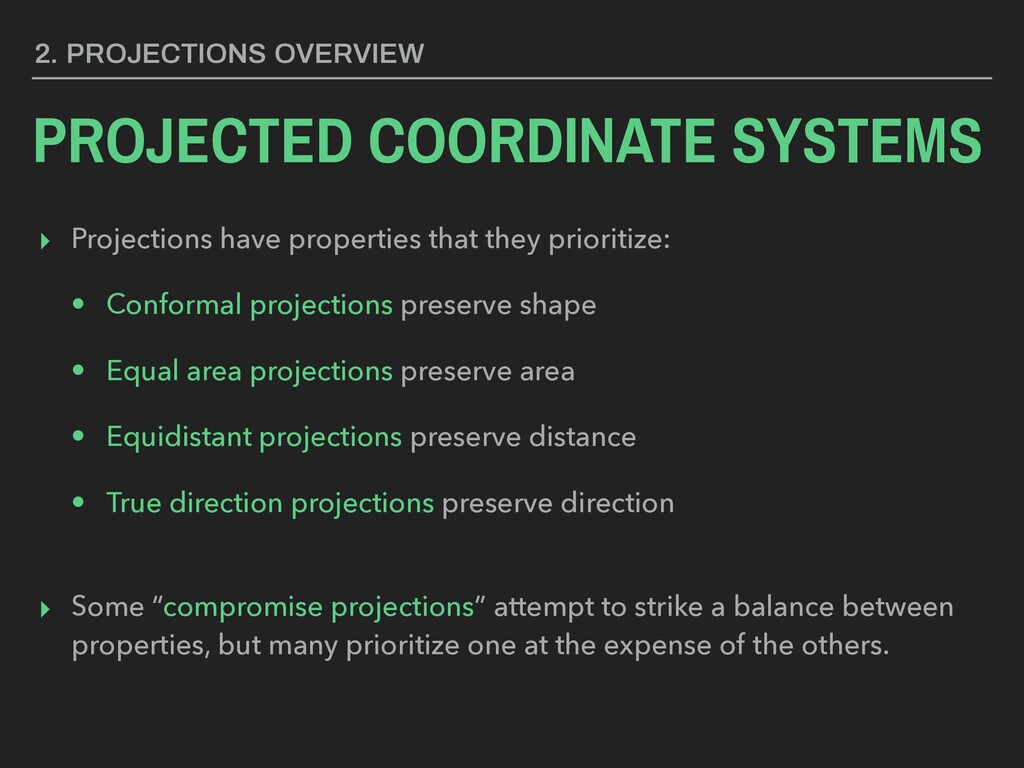
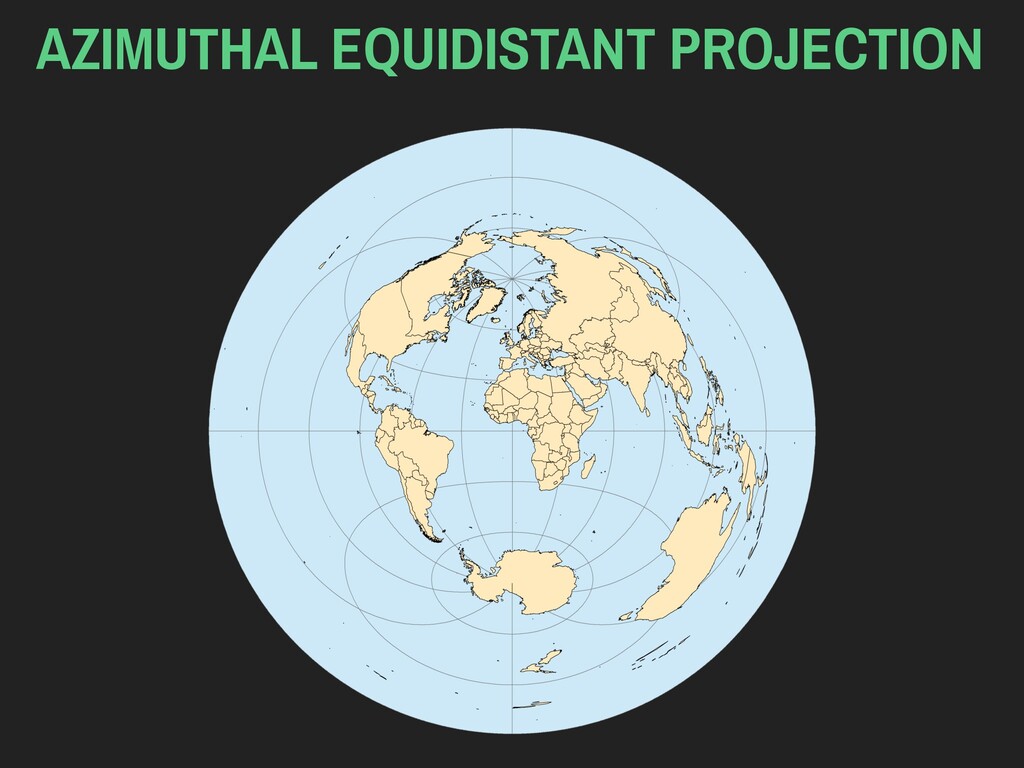
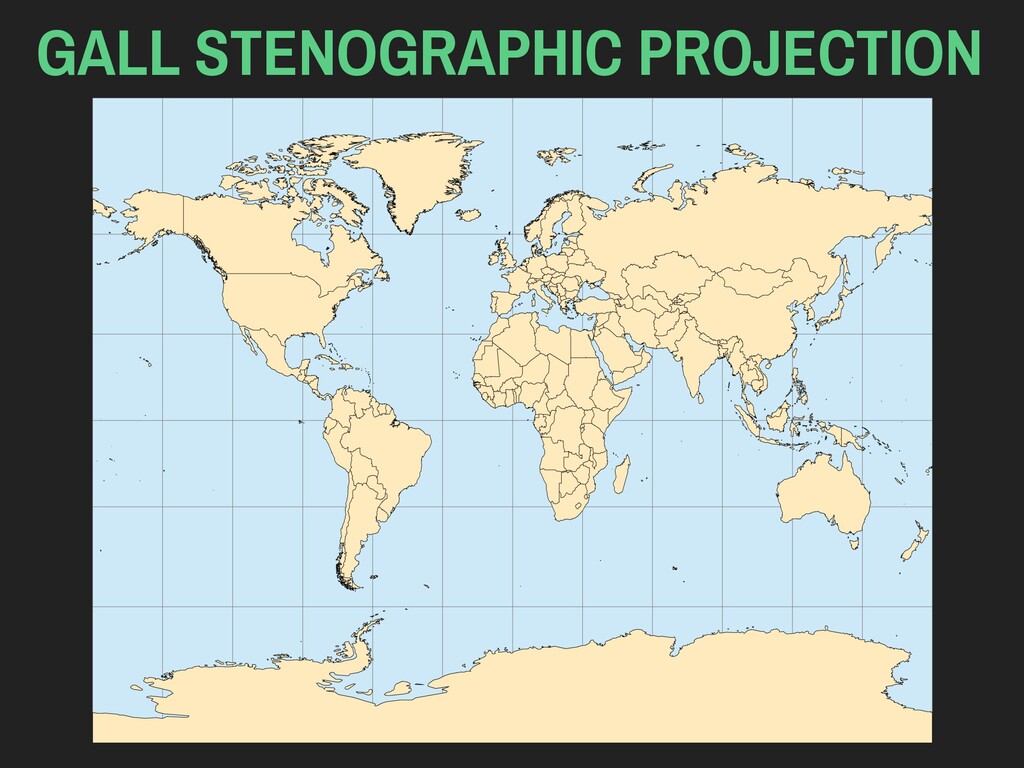
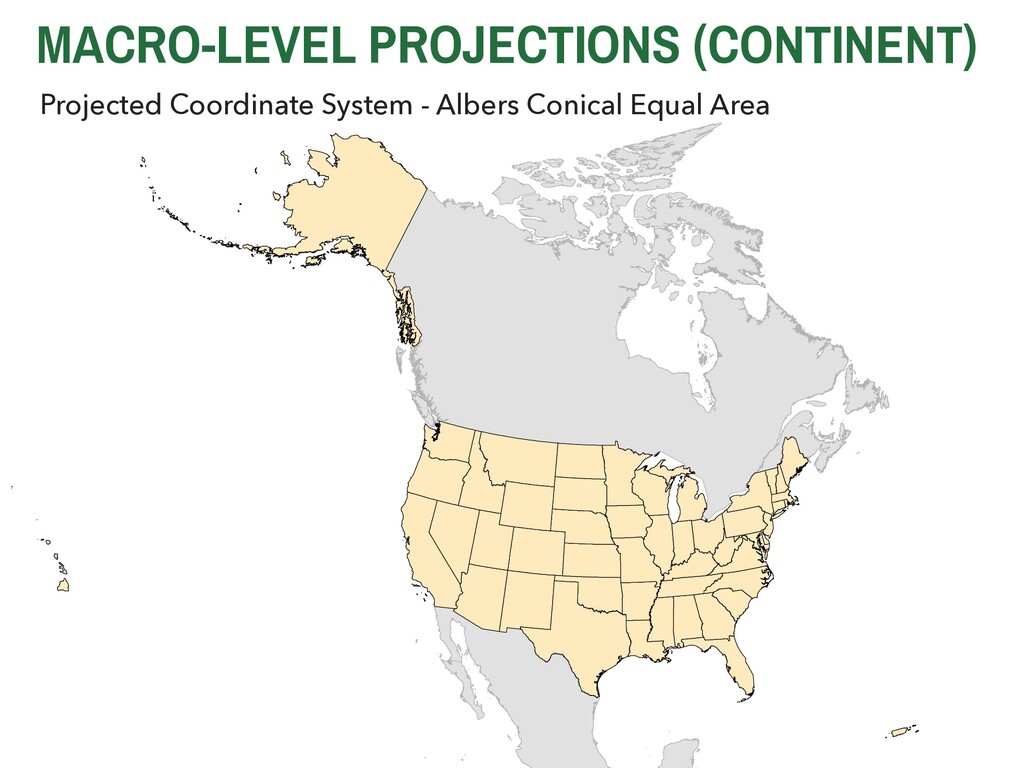
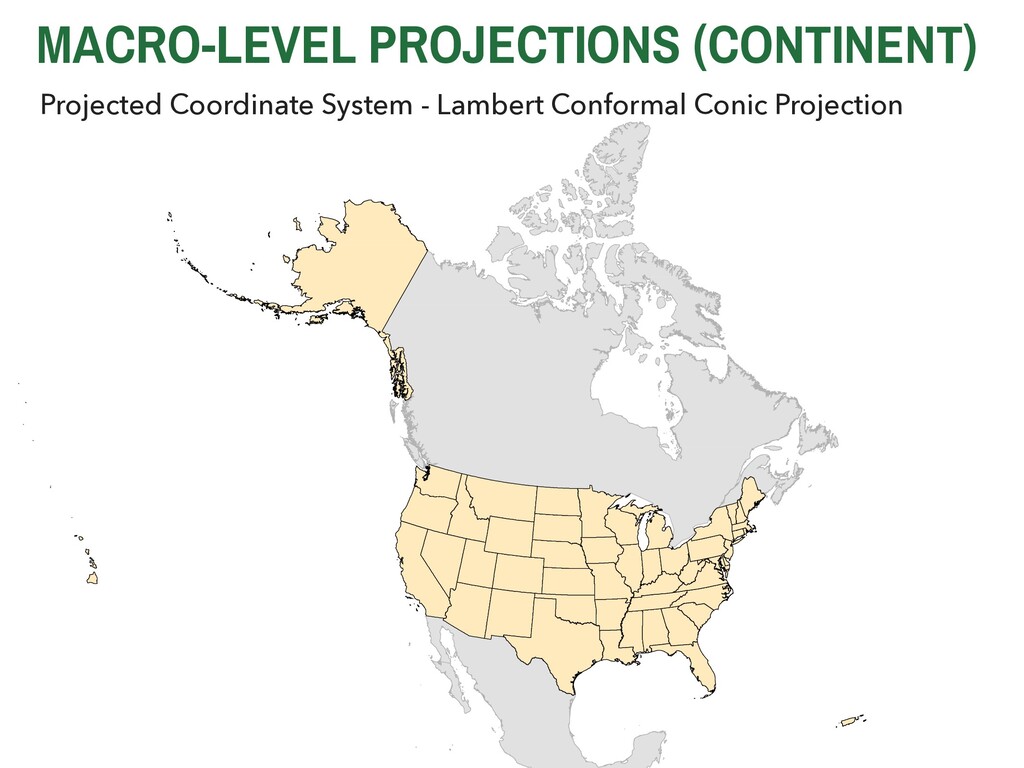
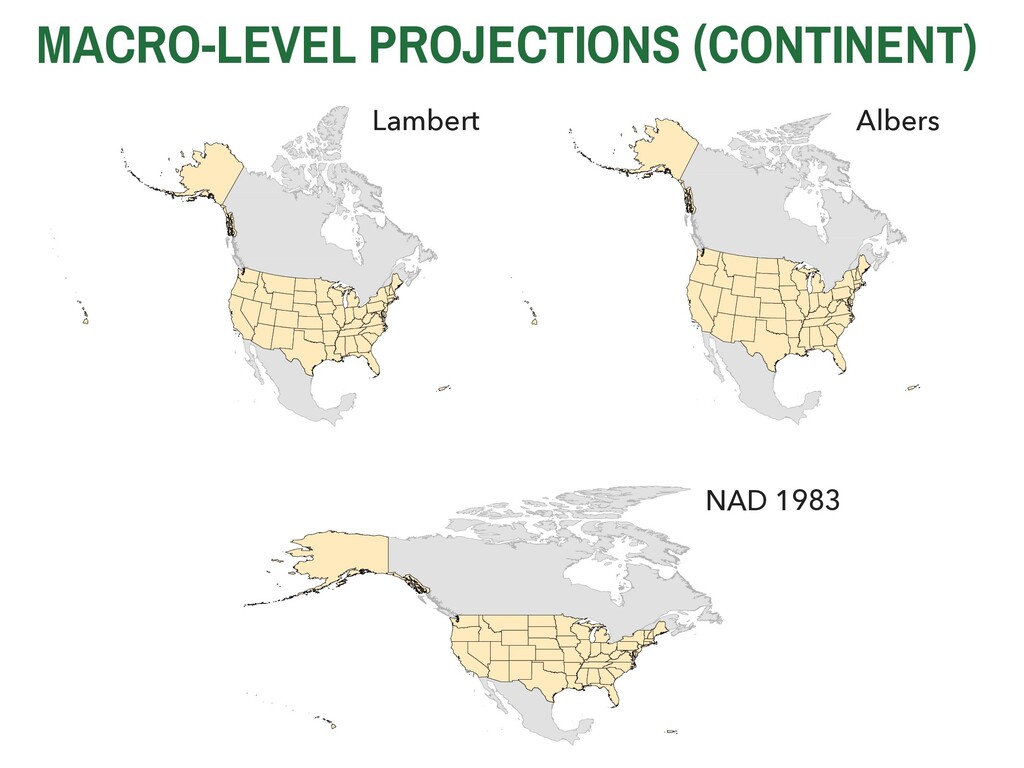
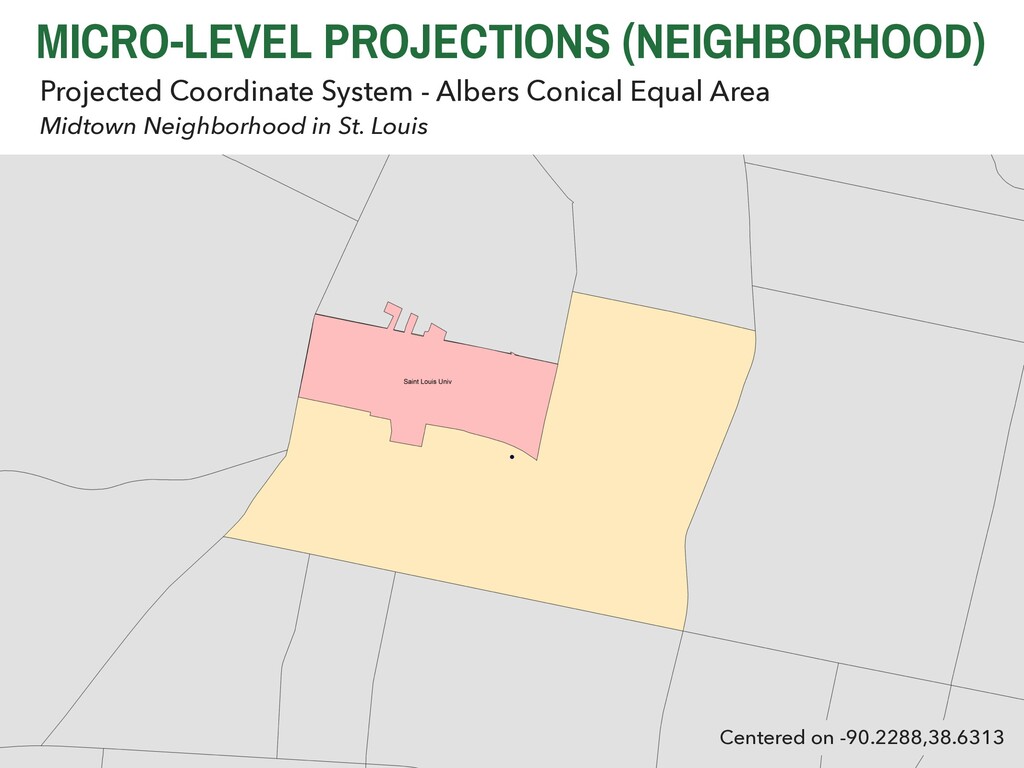
    • Conformal projections preserve shape • Equal area projections preserve area • Equidistant projections preserve distance • True direction projections preserve direction
 ▸ Some “compromise projections” attempt to strike a balance between properties, but many prioritize one at the expense of the others. 2. PROJECTIONS OVERVIEW
  12. “LEVELS” OF PROJECTION ▸ Macro - Continental or worldwide extents

    ▸ Meso - State or Several State extents ▸ Regional - Counties or City extent ▸ Micro - City or Neighborhood extent 2. PROJECTIONS OVERVIEW
  13. REGIONAL PROJECTIONS Geographic Coordinate System - NAD 1983 St. Louis

    Metropolitan Area Centered on -90.4462,38.6373
  14. REGIONAL PROJECTIONS Projected Coordinate System - Albers Conical Equal Area

    Centered on -90.4462,38.6373 St. Louis Metropolitan Area
  15. REGIONAL PROJECTIONS Projected Coordinate System - UTM 15N Centered on

    -90.4462,38.6373 St. Louis Metropolitan Area
  16. REGIONAL PROJECTIONS Projected Coordinate System - State Plane (Missouri East)

    Centered on -90.4462,38.6373 St. Louis Metropolitan Area
  17. MICRO-LEVEL PROJECTIONS (NEIGHBORHOOD) Projected Coordinate System - Albers Conical Equal

    Area Midtown Neighborhood in St. Louis Centered on -90.2288,38.6313
  18. “LEVELS” OF PROJECTION ▸ Macro - Continental or worldwide extents

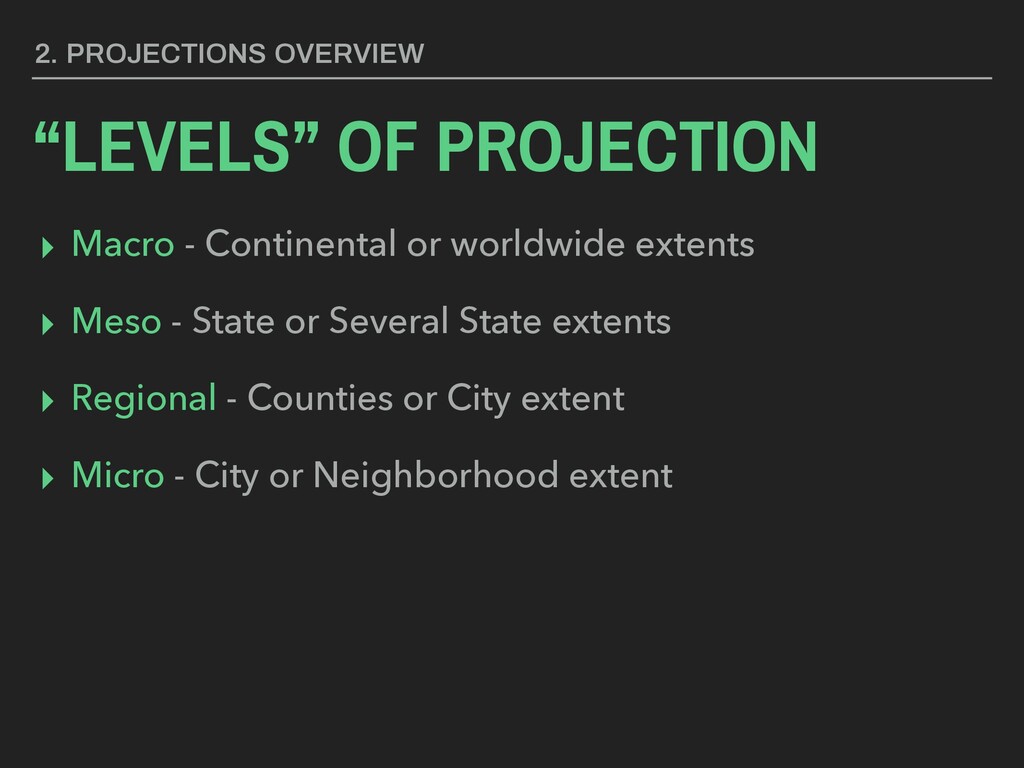
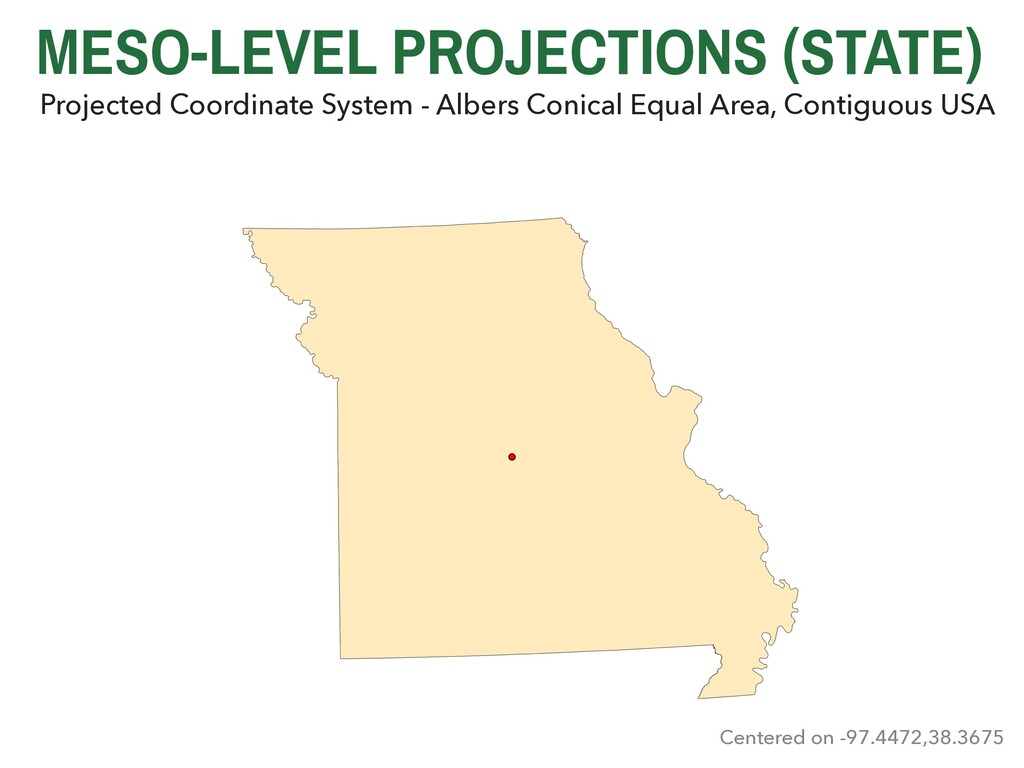
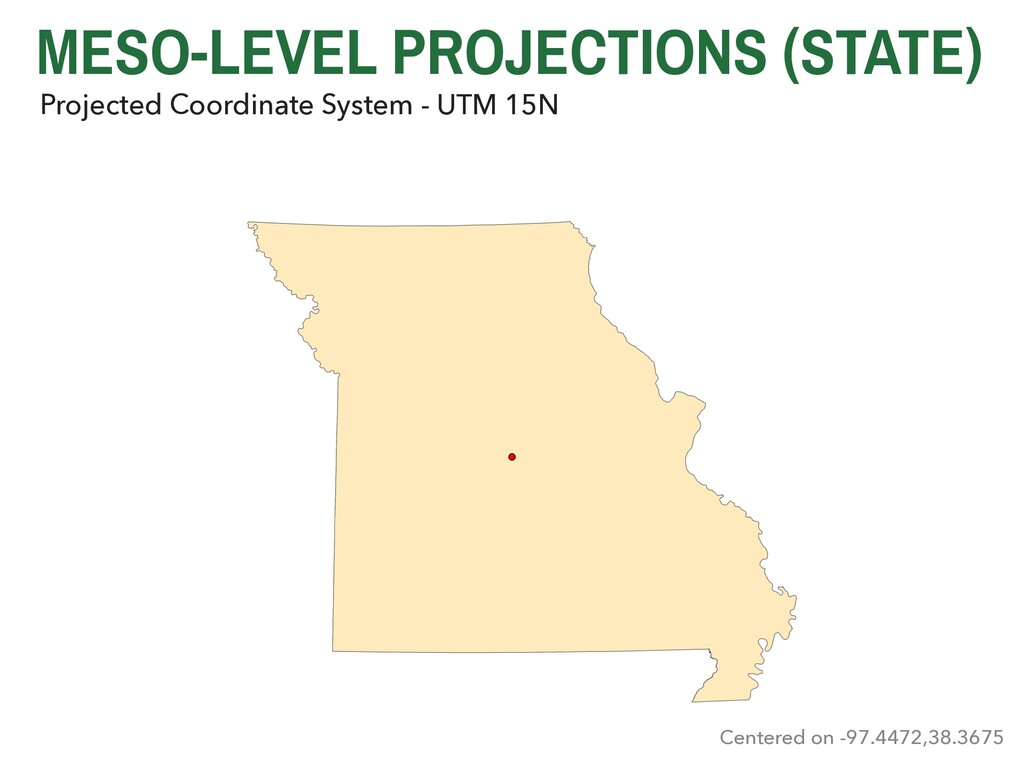
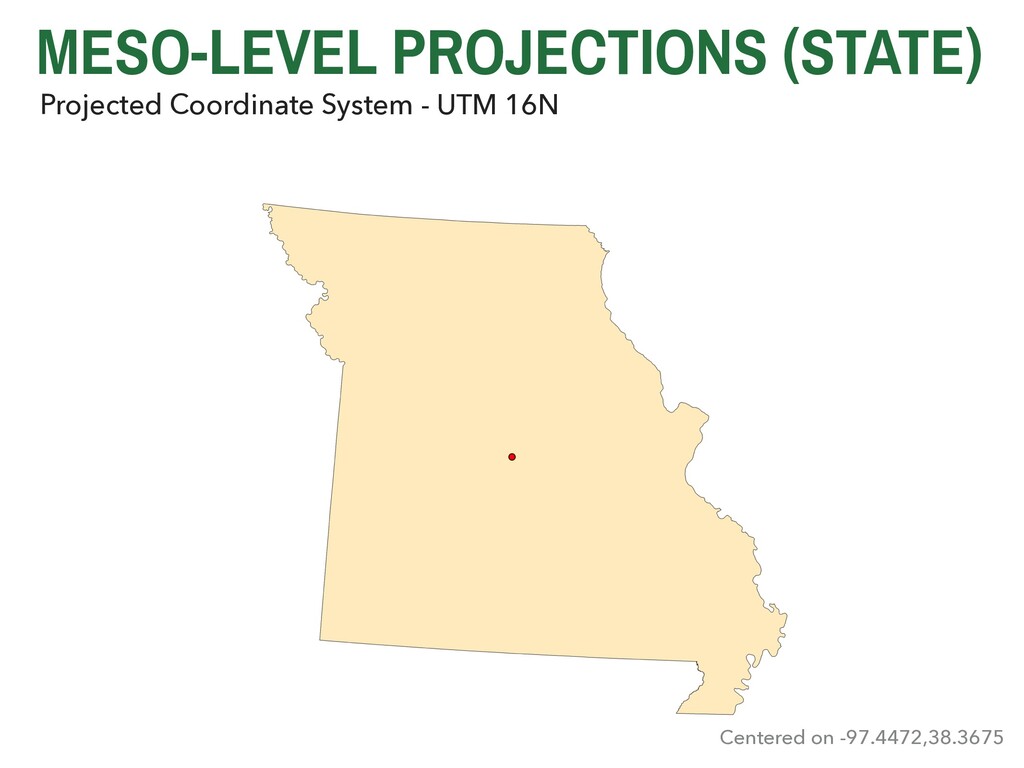
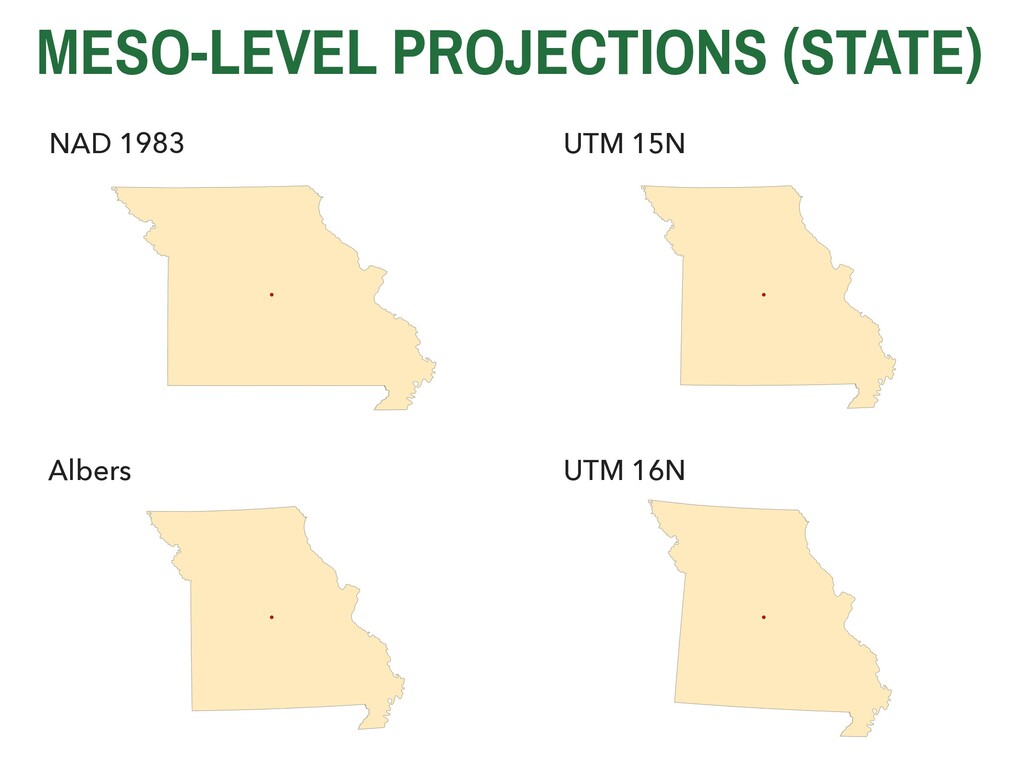
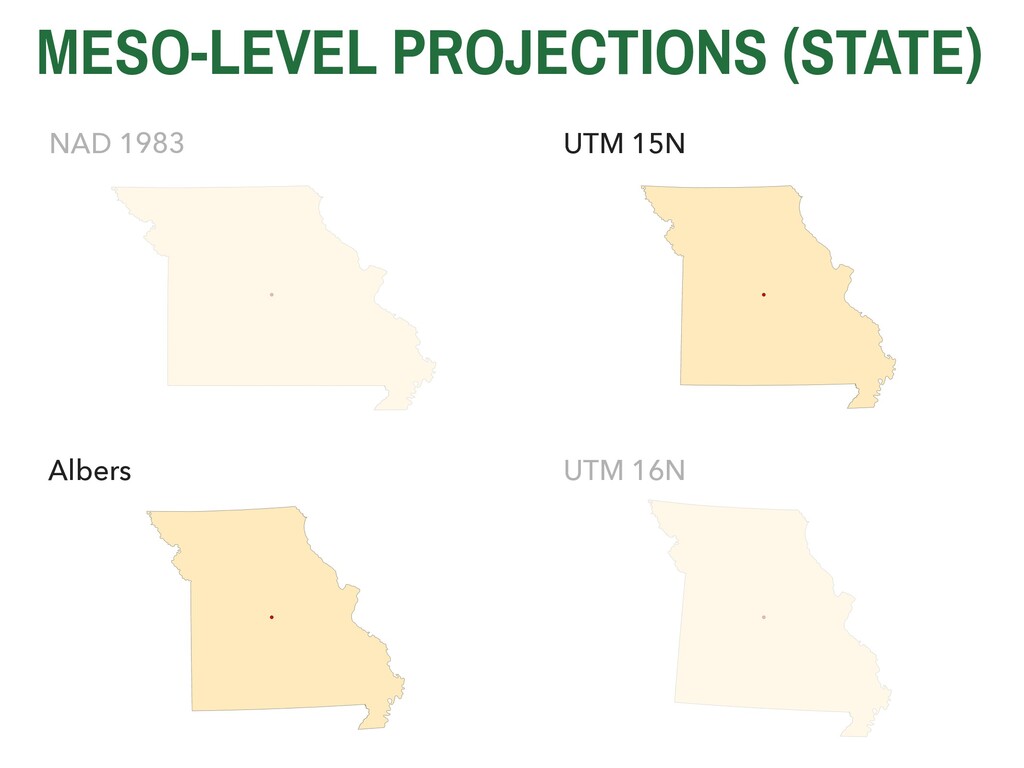
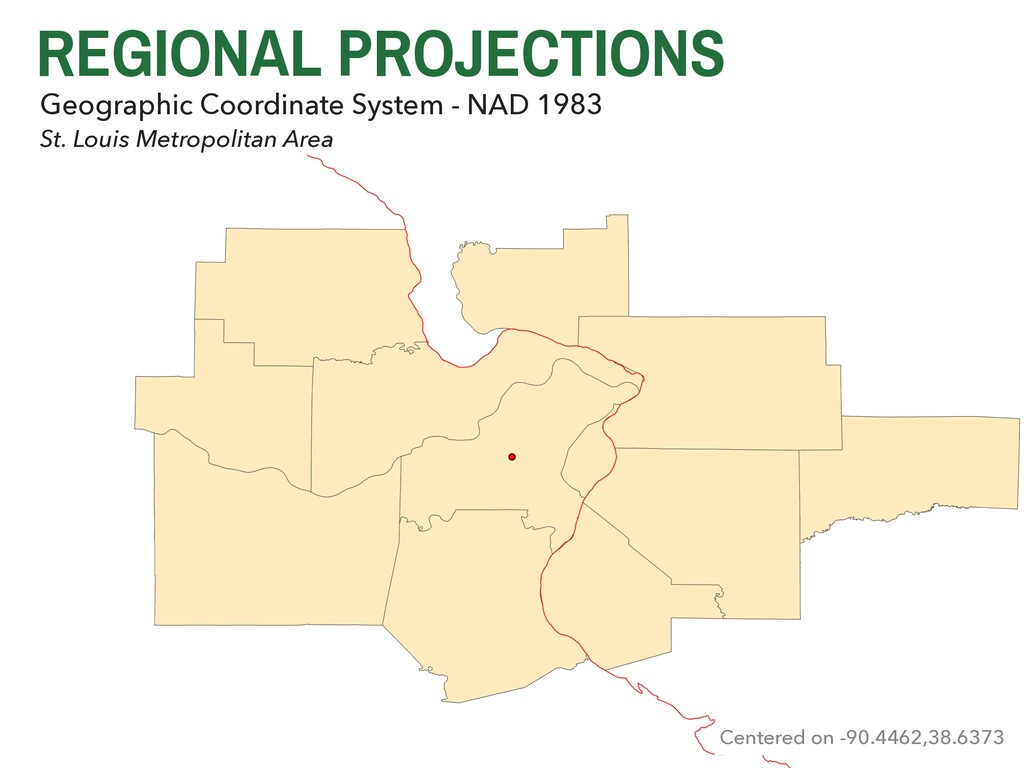
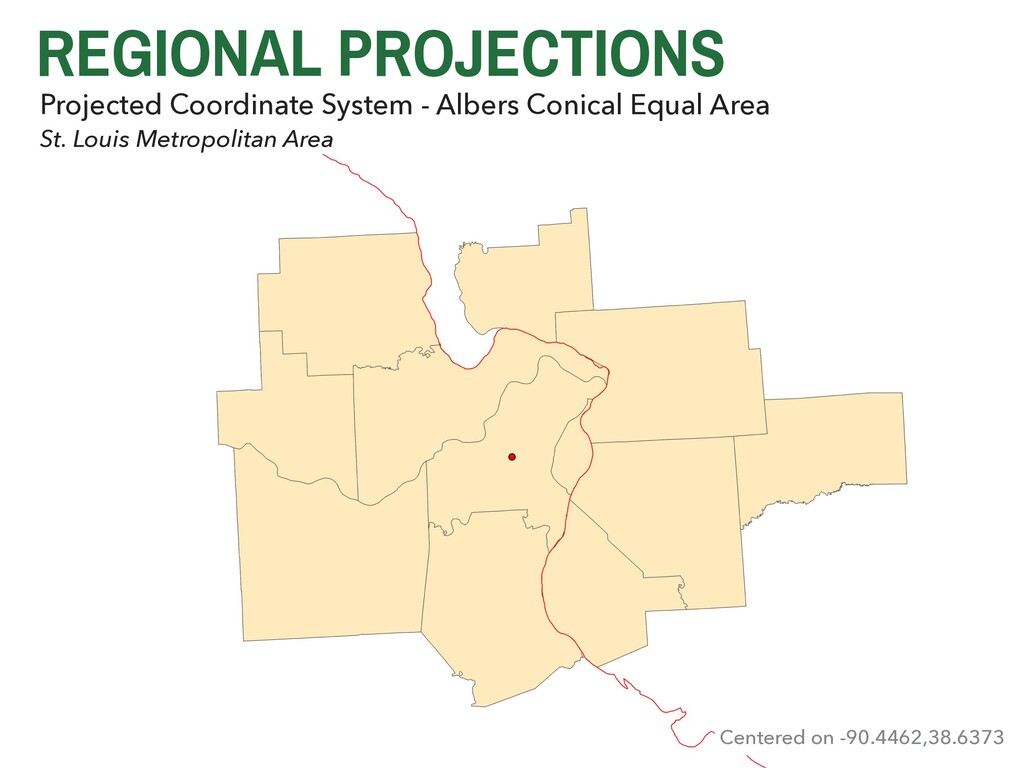
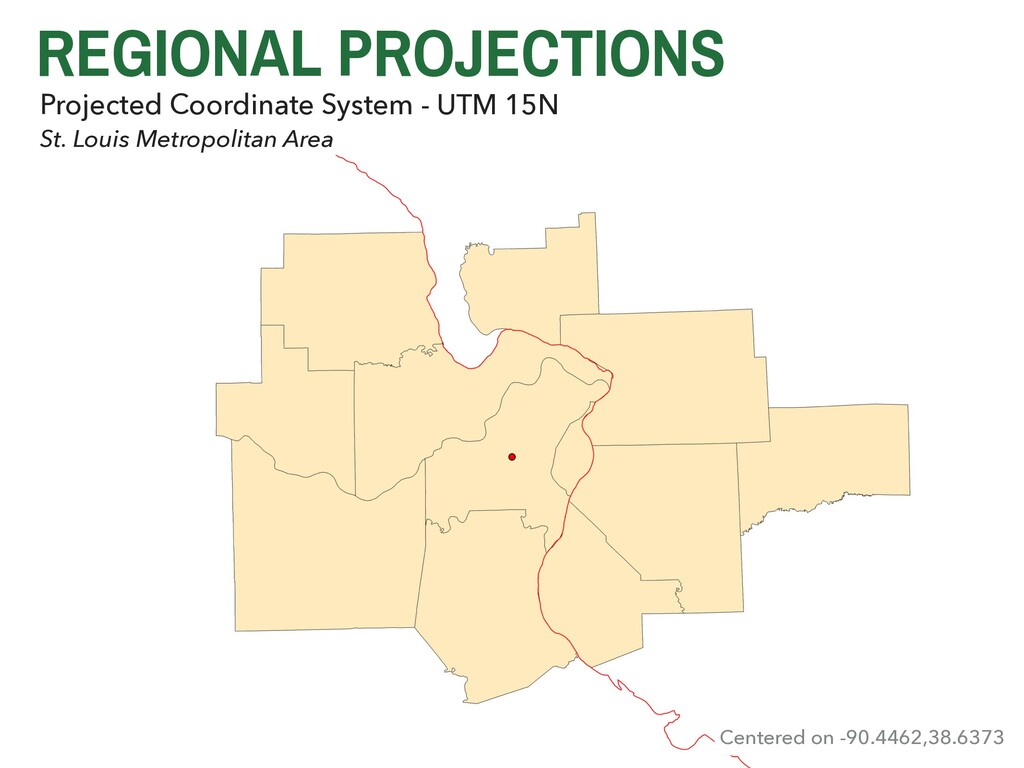
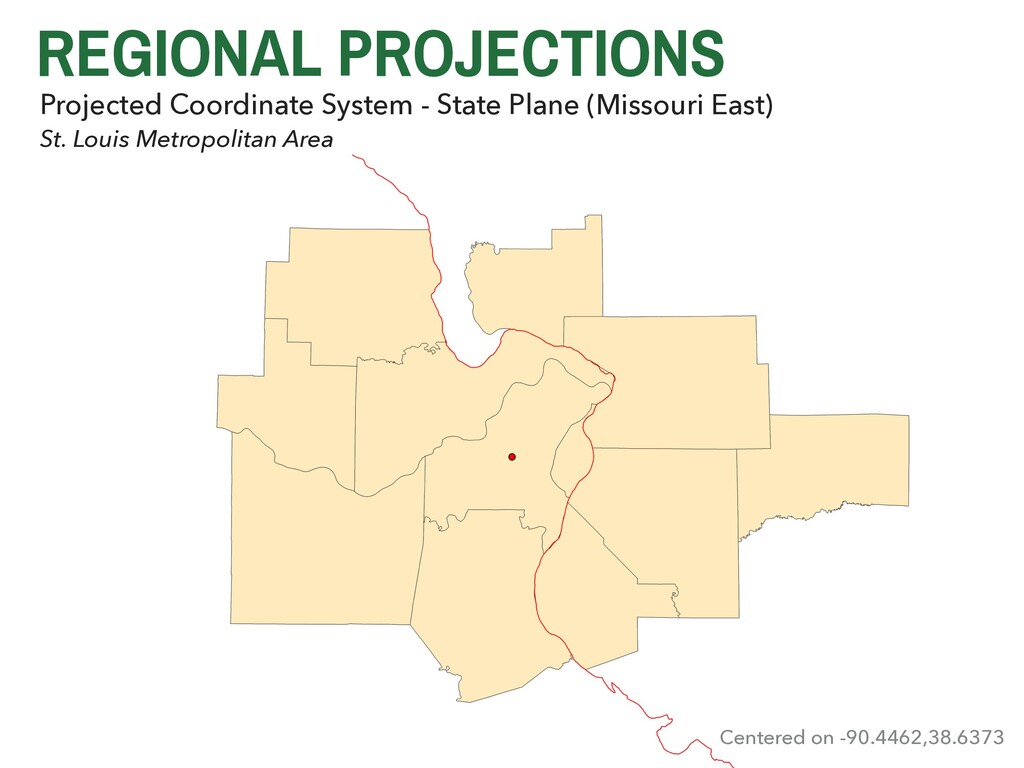
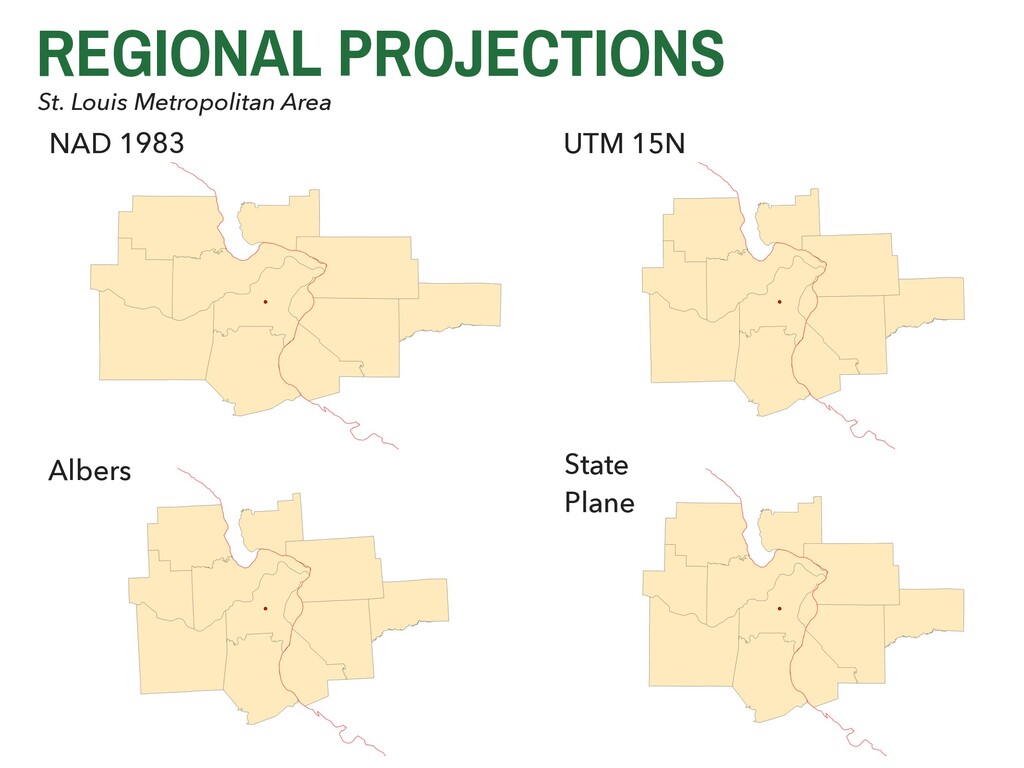
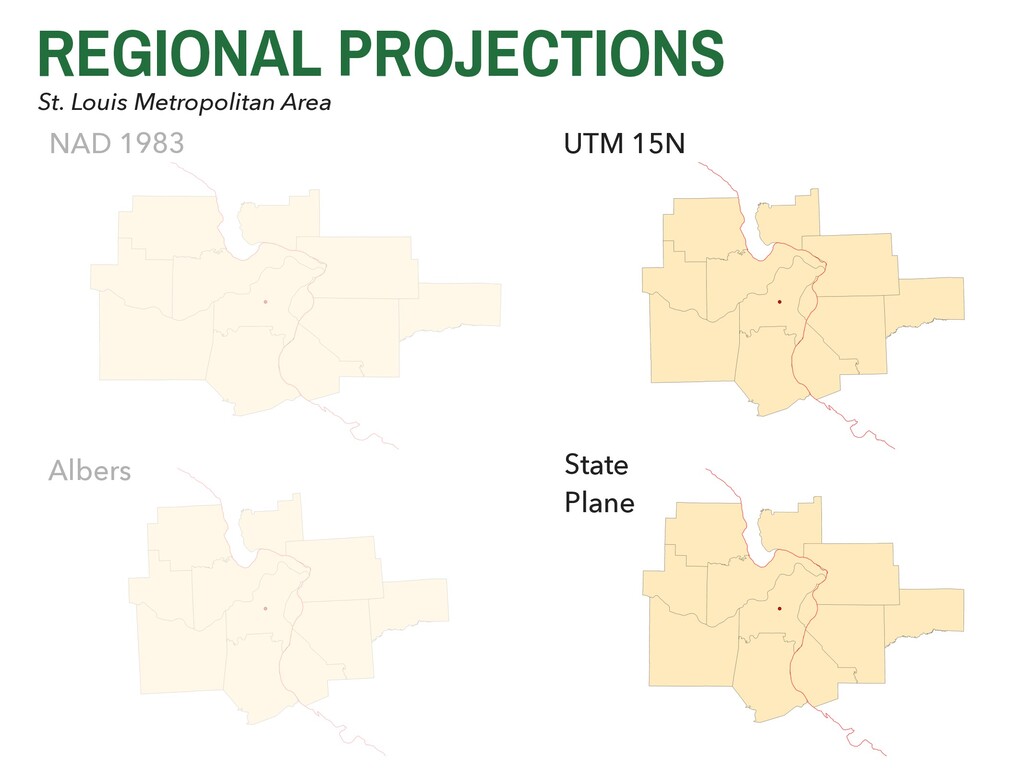
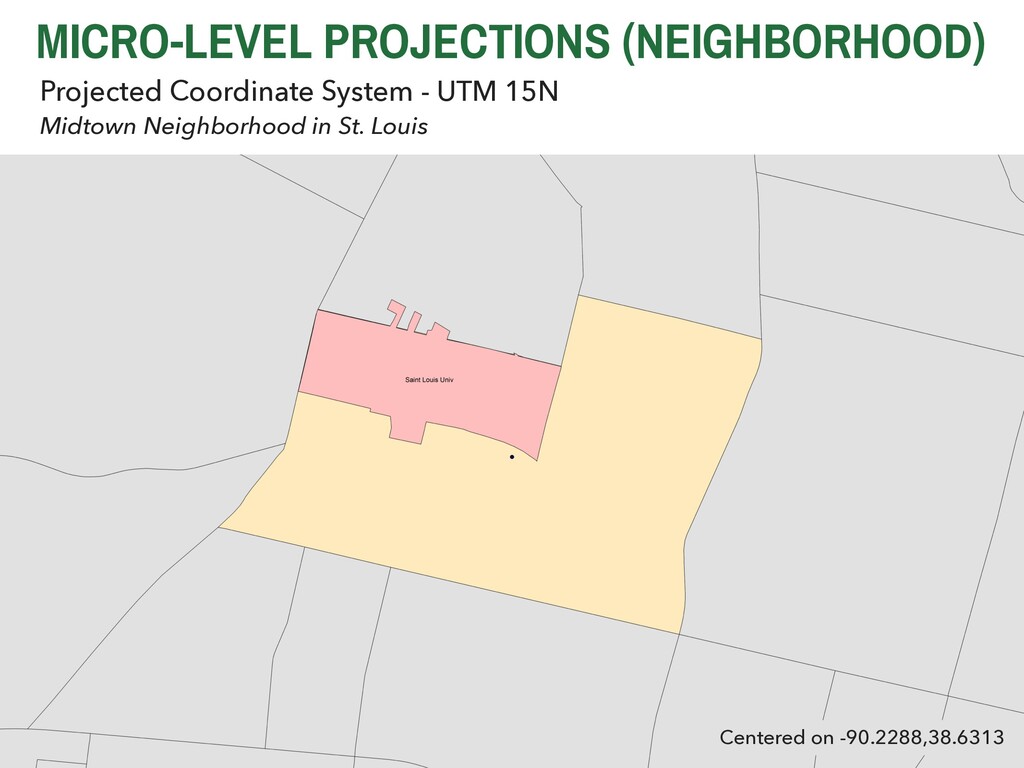
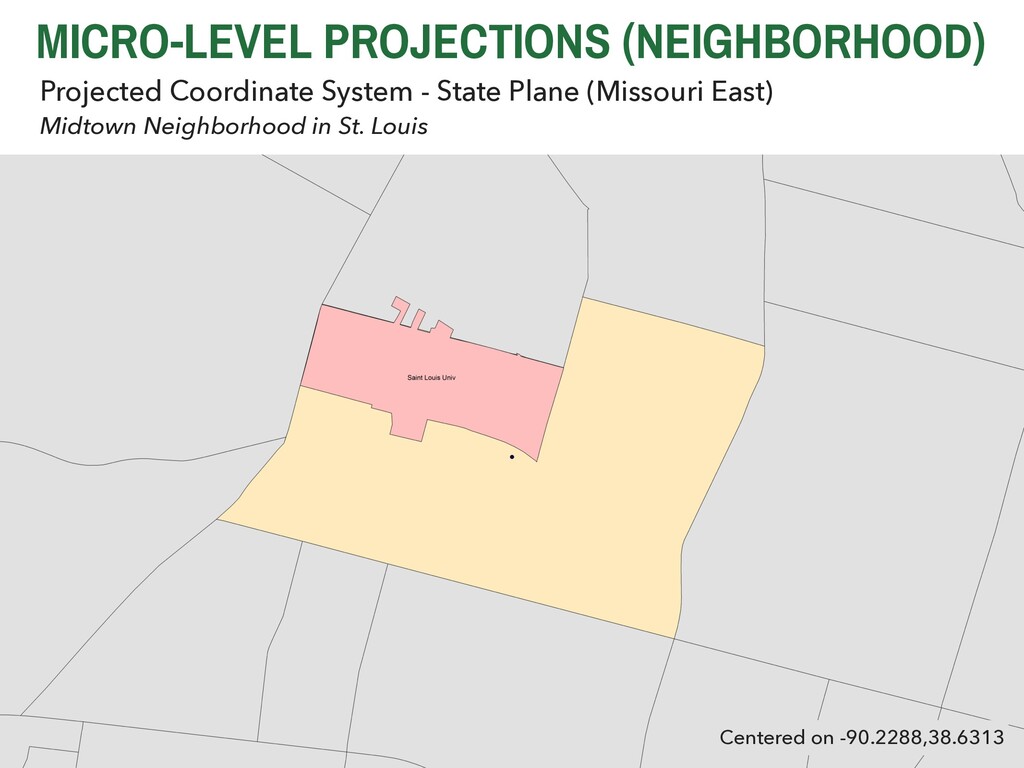
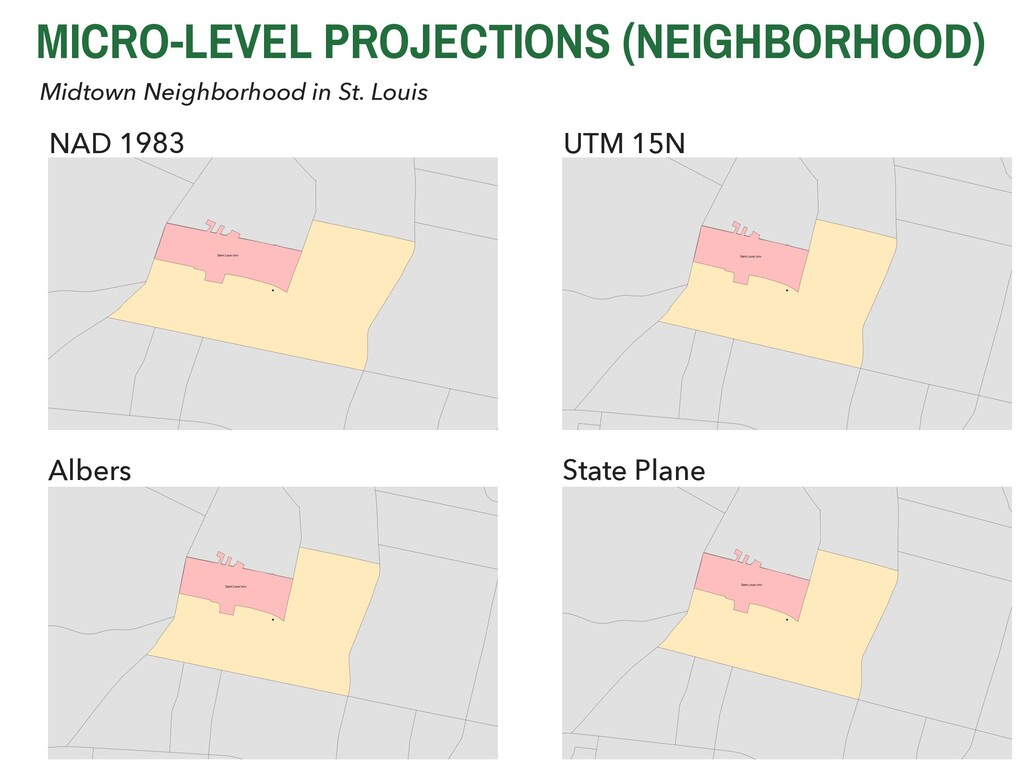
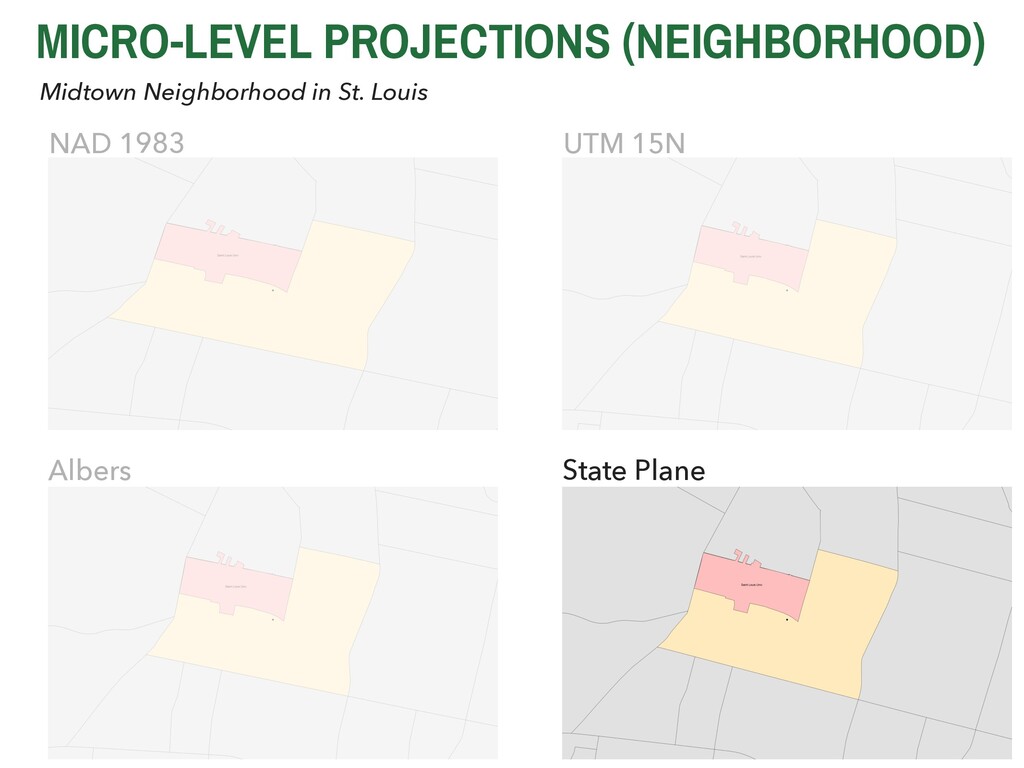
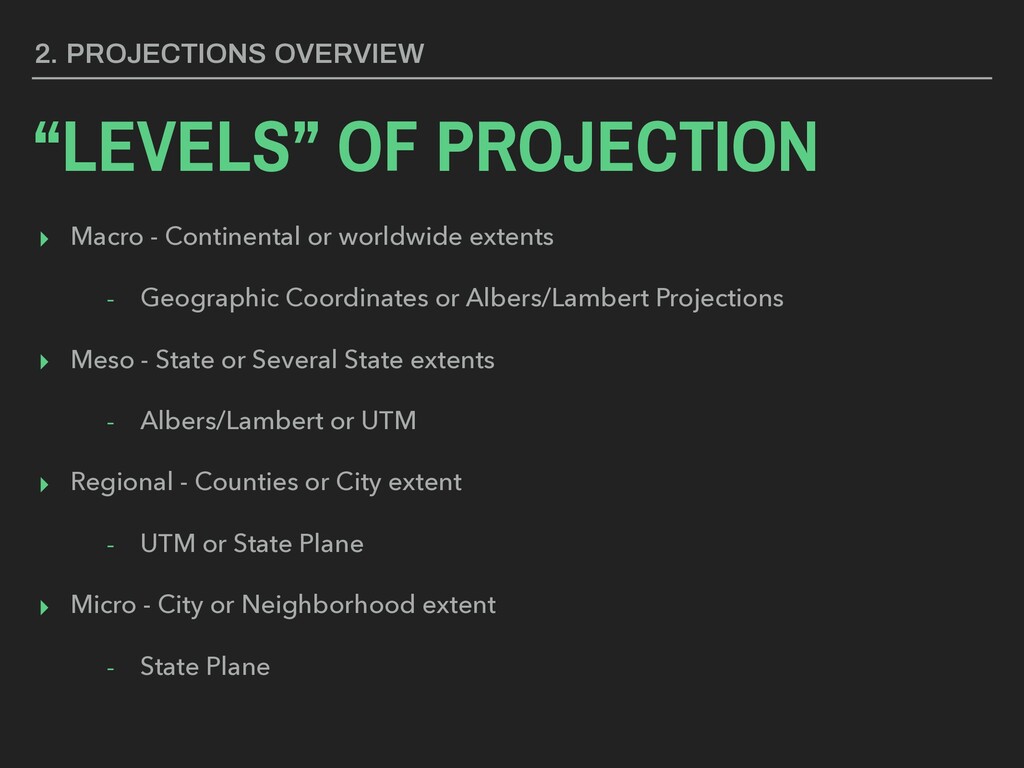
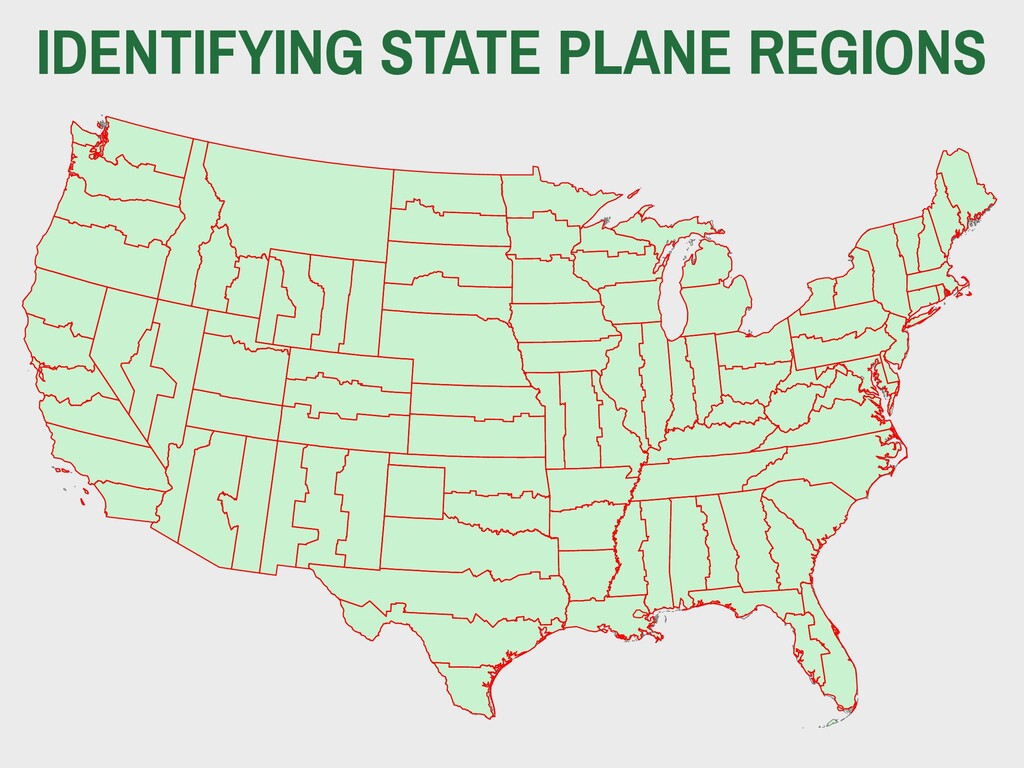
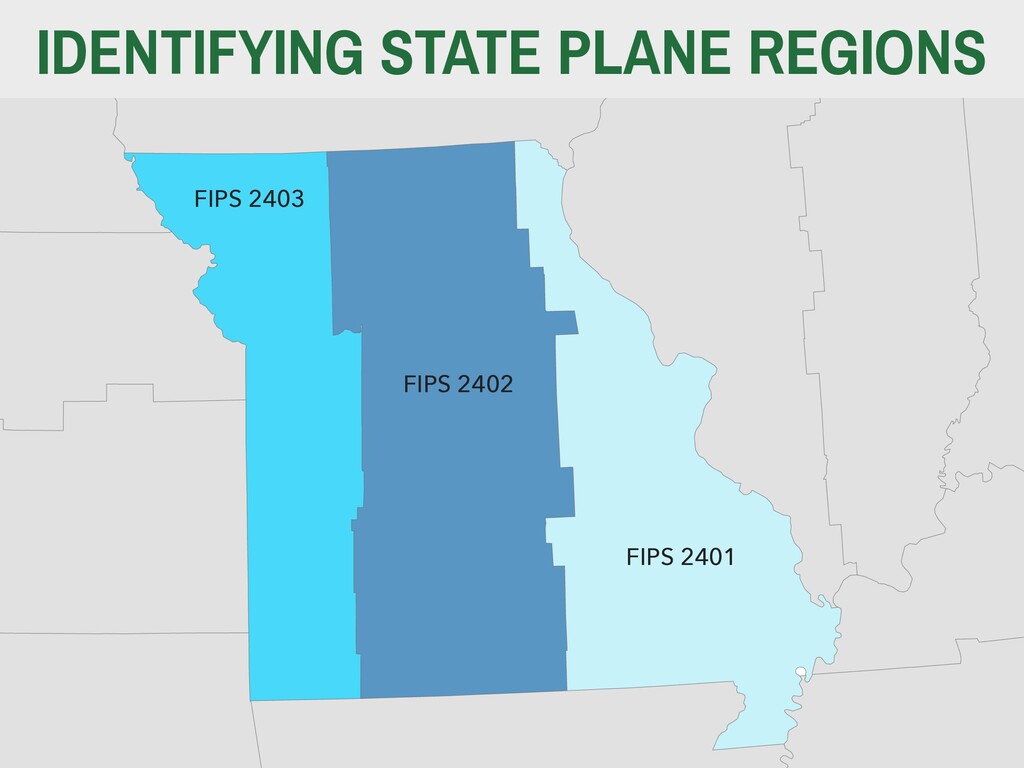
    - Geographic Coordinates or Albers/Lambert Projections ▸ Meso - State or Several State extents - Albers/Lambert or UTM ▸ Regional - Counties or City extent - UTM or State Plane ▸ Micro - City or Neighborhood extent - State Plane 2. PROJECTIONS OVERVIEW
  19. 11 11 17 17 12 12 16 16 14 14

    13 13 15 15 18 18 11 11 12 12 16 16 13 13 18 18 15 15 17 17 14 14 11 11 15 15 14 14 12 12 16 16 18 18 13 13 17 17 10 10 19 19 10 10 14 14 15 15 13 13 16 16 12 12 17 17 19 19 11 11 18 18 9 9 9 9 10 10 19 19 10 10 20 20 19 19 20 20 10 10 IDENTIFYING UTM ZONES
  20. ▸ René Descartes • Born 1596, died 1650 • French

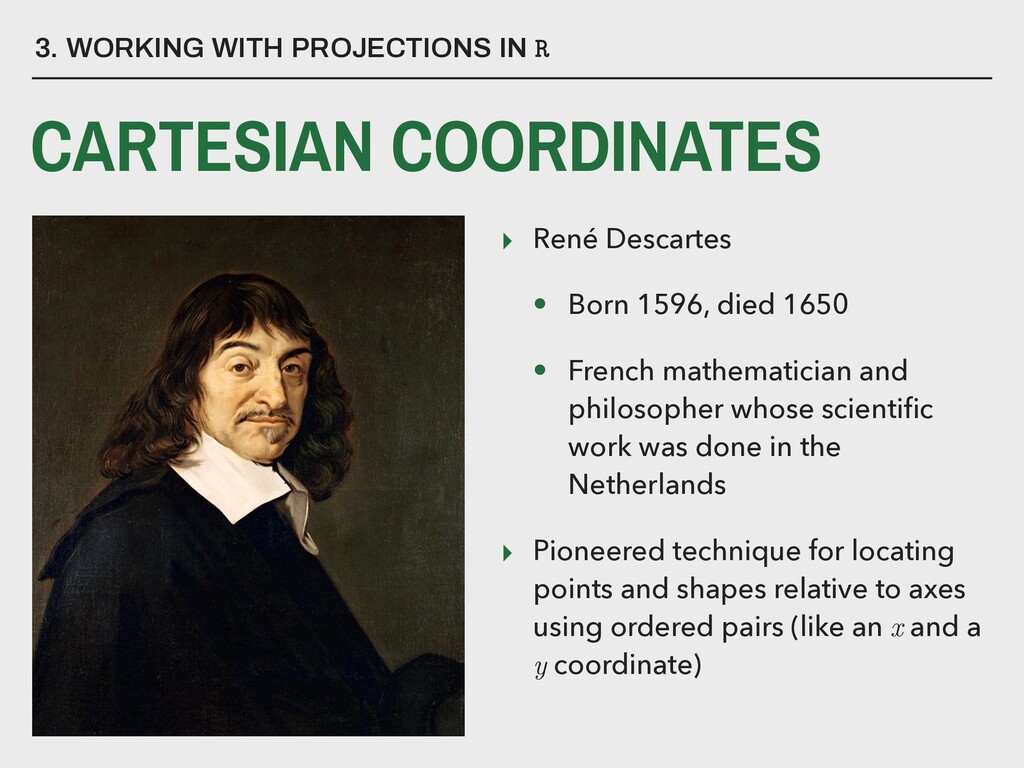
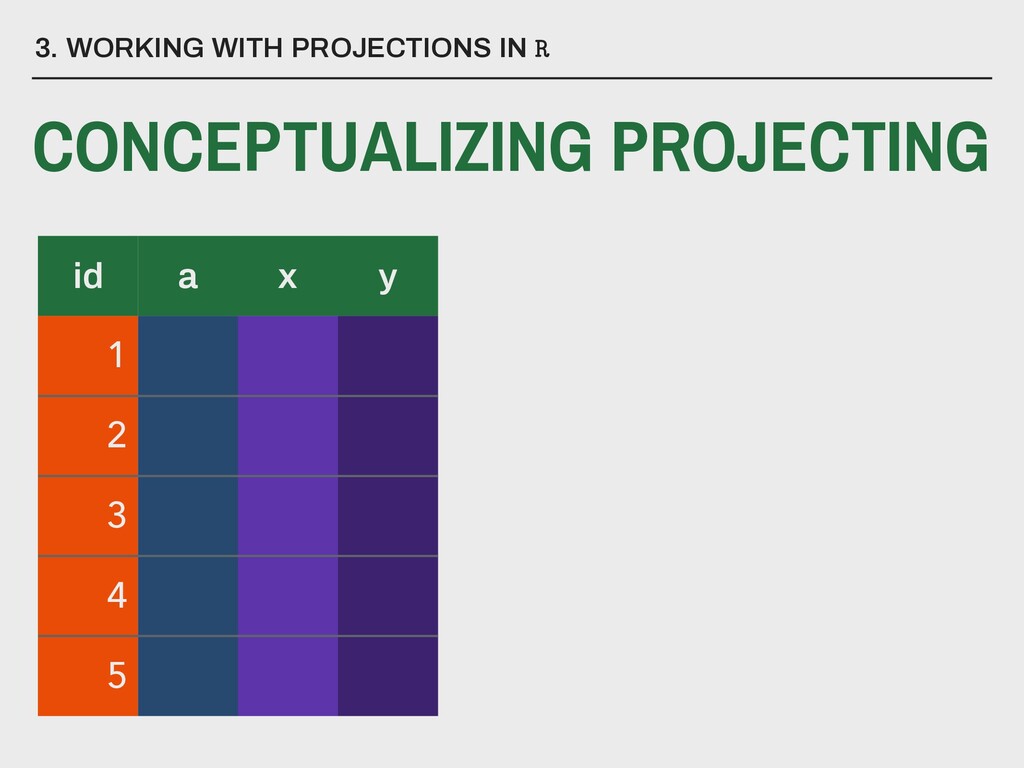
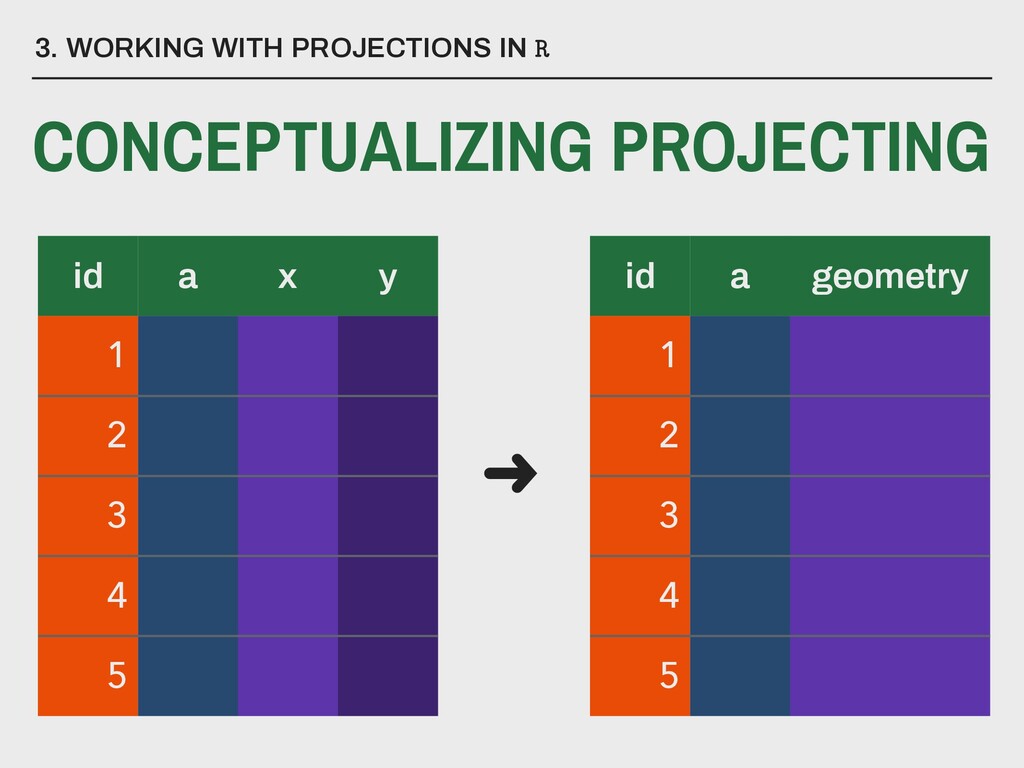
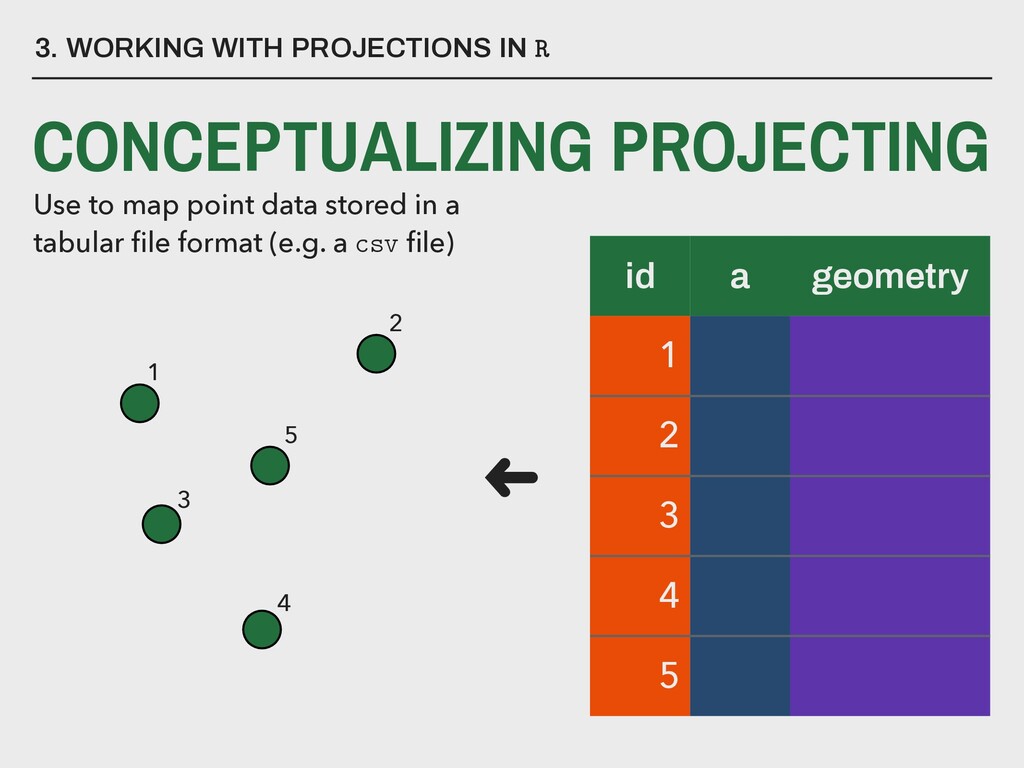
    mathematician and philosopher whose scientific work was done in the Netherlands ▸ Pioneered technique for locating points and shapes relative to axes using ordered pairs (like an x and a y coordinate) 3. WORKING WITH PROJECTIONS IN R CARTESIAN COORDINATES
  21. KEY TERM Projecting data is the
 process of taking tabular


    data containing x and y 
 coordinates and covering it to geometric data so that it may be mapped.
  22. 3. WORKING WITH PROJECTIONS IN R CONCEPTUALIZING PROJECTING id a

    x y 1 2 3 4 5 id a geometry 1 2 3 4 5 ➜
  23. 3. WORKING WITH PROJECTIONS IN R CONCEPTUALIZING PROJECTING Use to

    map point data stored in a
 tabular file format (e.g. a csv file) ➜ 1 2 5 3 4 id a geometry 1 2 3 4 5
  24. ? 3. WORKING WITH PROJECTIONS IN R PROJECTIONS IN R

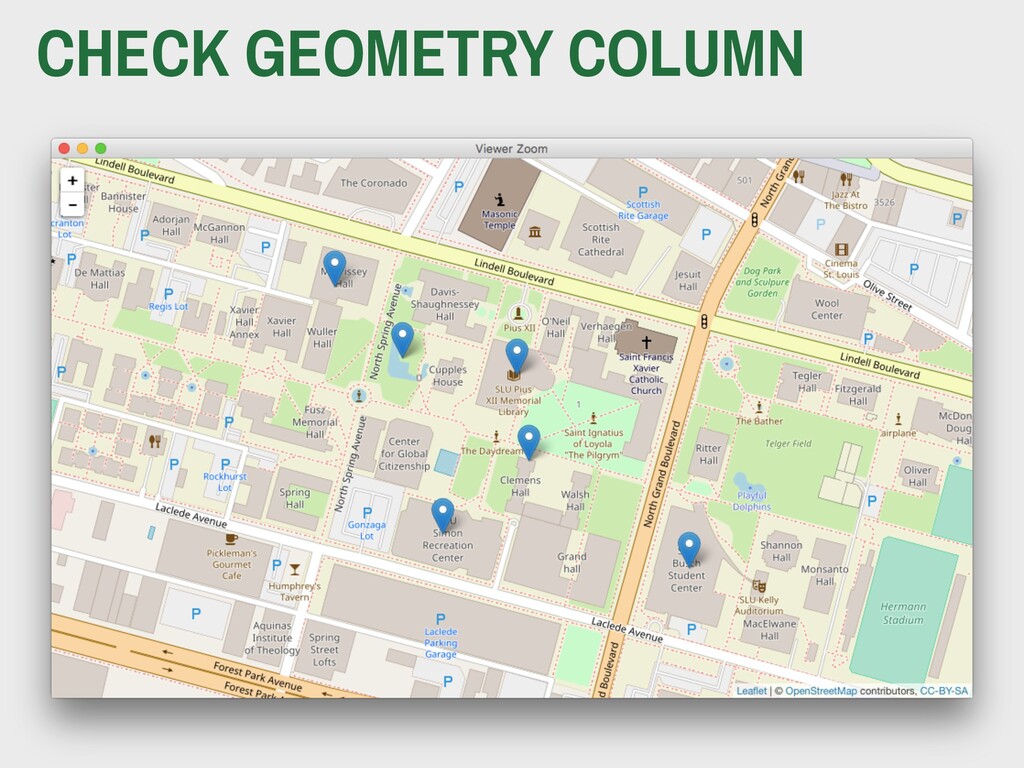
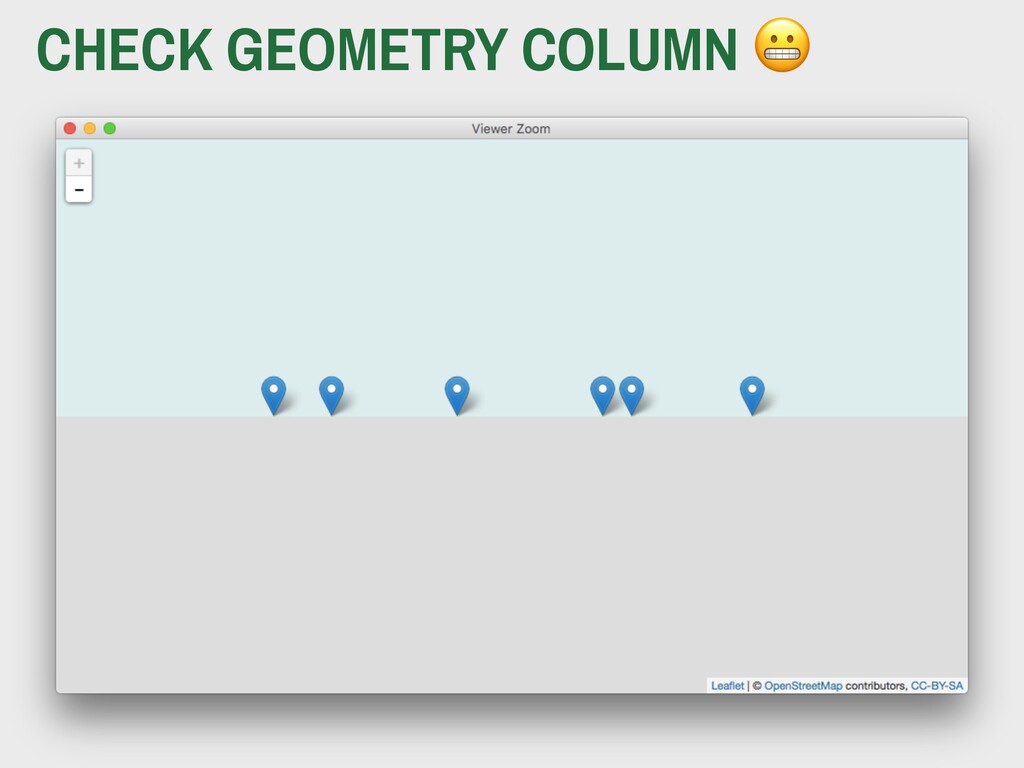
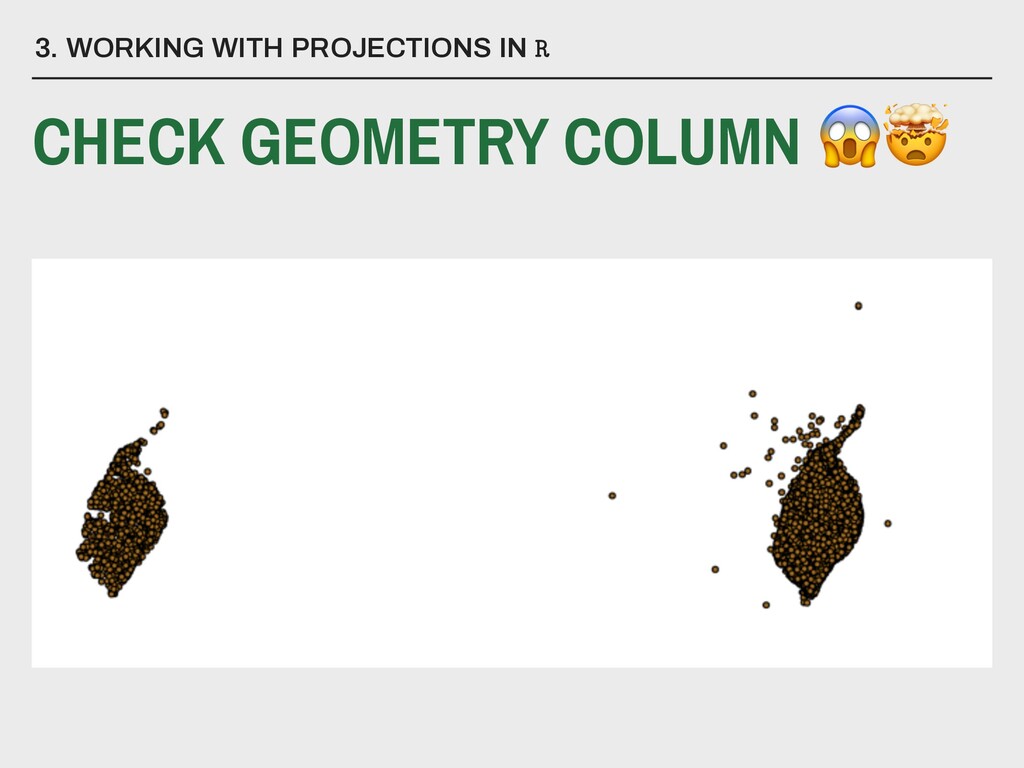
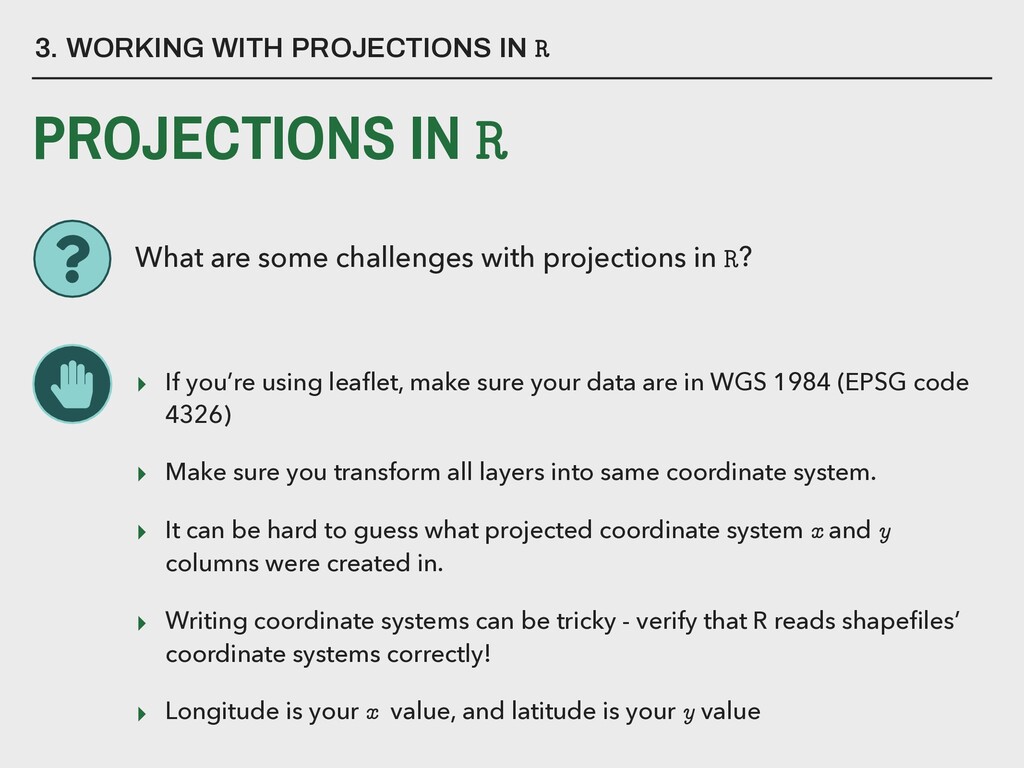
    ▸ If you’re using leaflet, make sure your data are in WGS 1984 (EPSG code 4326) ▸ Make sure you transform all layers into same coordinate system. ▸ It can be hard to guess what projected coordinate system x and y columns were created in. ▸ Writing coordinate systems can be tricky - verify that R reads shapefiles’ coordinate systems correctly! ▸ Longitude is your x value, and latitude is your y value What are some challenges with projections in R?