Upgrade to Pro — share decks privately, control downloads, hide ads and more …

CMB.TECH Q2 2026 earnings release

Avatar for CMB.TECH CMB.TECH PRO
August 27, 2026

CMB.TECH Q2 2026 earnings release

Avatar for CMB.TECH

CMB.TECH PRO

August 27, 2026

More Decks by CMB.TECH

Other Decks in Business

Transcript

  1. Decarbonise Today Navigate Tomorrow Earnings conference call Q2 2026 27

    AUGUST 2026 PRESENTER ALEXANDER SAVERYS & LUDOVIC SAVERYS
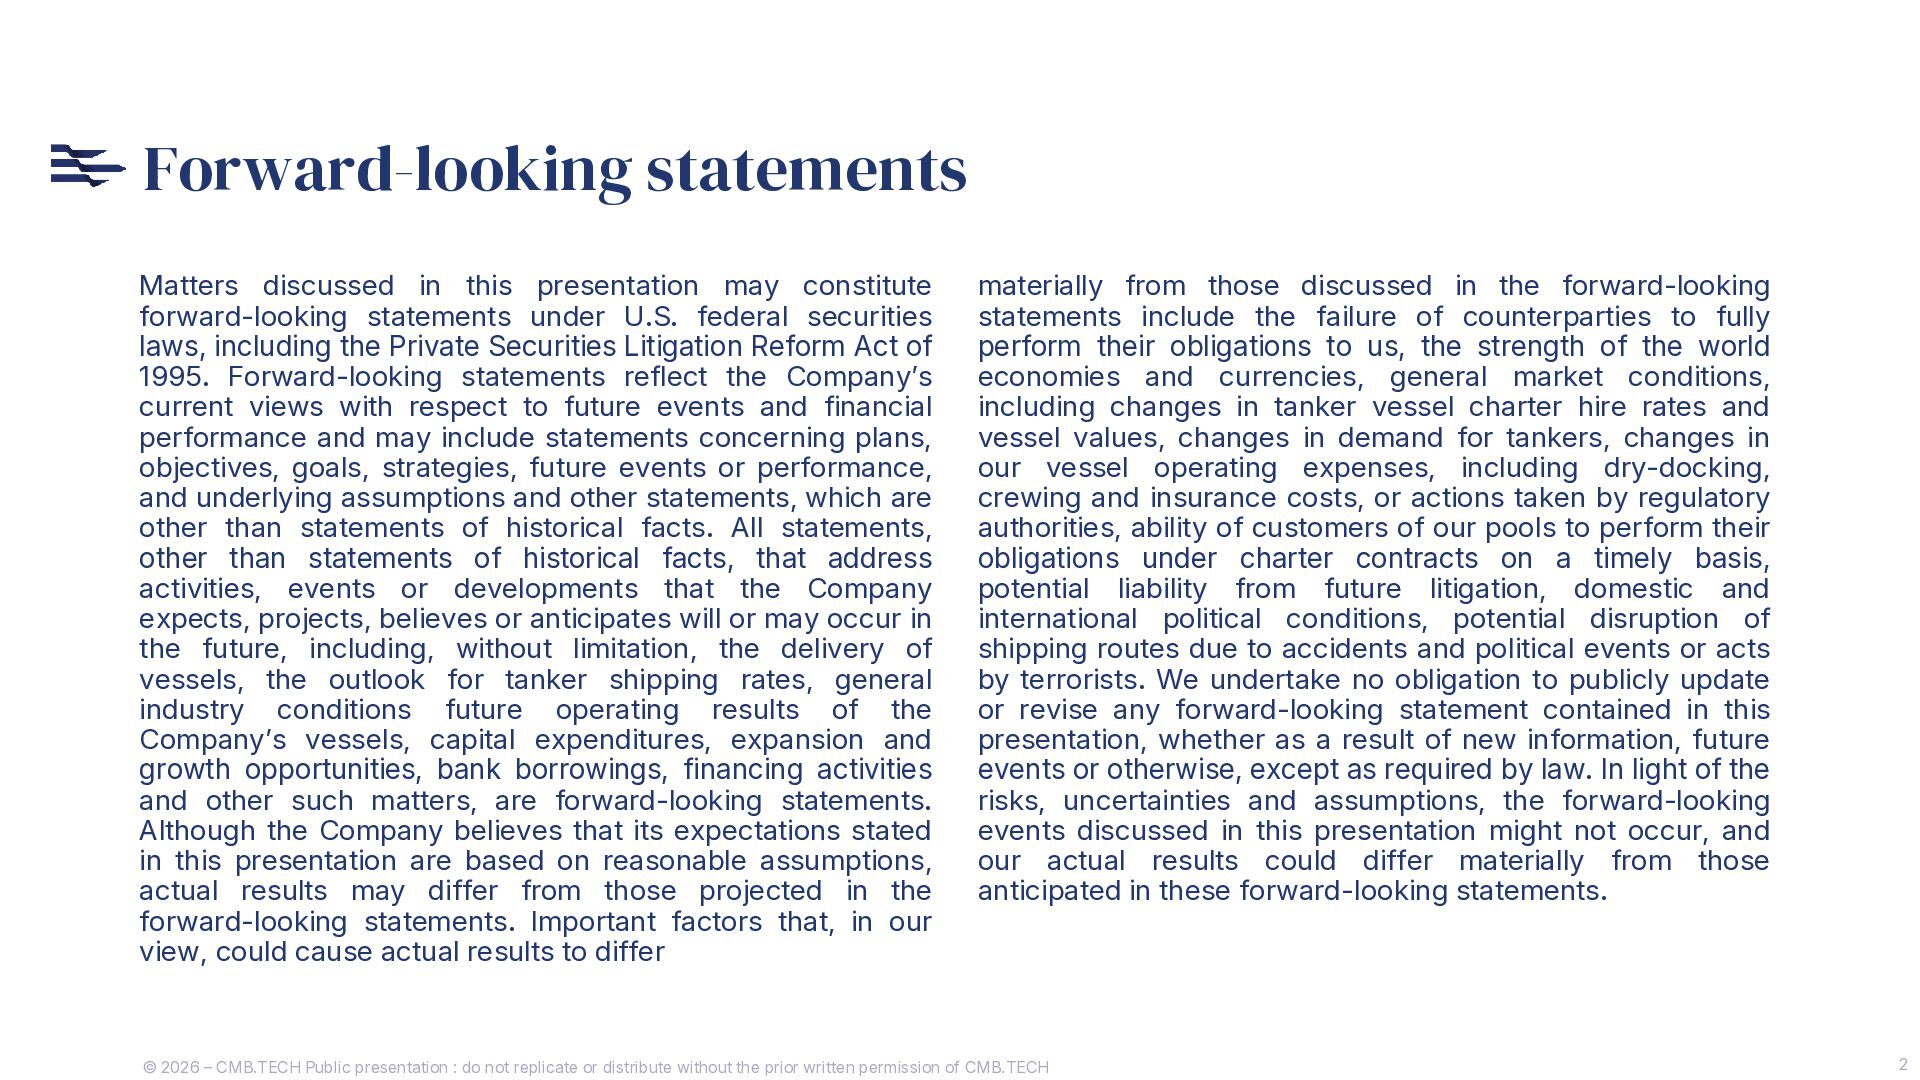
  2. Forward-looking statements Matters discussed in this presentation may constitute forward-looking

    statements under U.S. federal securities laws, including the Private Securities Litigation Reform Act of 1995. Forward-looking statements reflect the Company’s current views with respect to future events and financial performance and may include statements concerning plans, objectives, goals, strategies, future events or performance, and underlying assumptions and other statements, which are other than statements of historical facts. All statements, other than statements of historical facts, that address activities, events or developments that the Company expects, projects, believes or anticipates will or may occur in the future, including, without limitation, the delivery of vessels, the outlook for tanker shipping rates, general industry conditions future operating results of the Company’s vessels, capital expenditures, expansion and growth opportunities, bank borrowings, financing activities and other such matters, are forward-looking statements. Although the Company believes that its expectations stated in this presentation are based on reasonable assumptions, actual results may differ from those projected in the forward-looking statements. Important factors that, in our view, could cause actual results to differ materially from those discussed in the forward-looking statements include the failure of counterparties to fully perform their obligations to us, the strength of the world economies and currencies, general market conditions, including changes in tanker vessel charter hire rates and vessel values, changes in demand for tankers, changes in our vessel operating expenses, including dry-docking, crewing and insurance costs, or actions taken by regulatory authorities, ability of customers of our pools to perform their obligations under charter contracts on a timely basis, potential liability from future litigation, domestic and international political conditions, potential disruption of shipping routes due to accidents and political events or acts by terrorists. We undertake no obligation to publicly update or revise any forward-looking statement contained in this presentation, whether as a result of new information, future events or otherwise, except as required by law. In light of the risks, uncertainties and assumptions, the forward-looking events discussed in this presentation might not occur, and our actual results could differ materially from those anticipated in these forward-looking statements. © 2026 – CMB.TECH Public presentation : do not replicate or distribute without the prior written permission of CMB.TECH 2
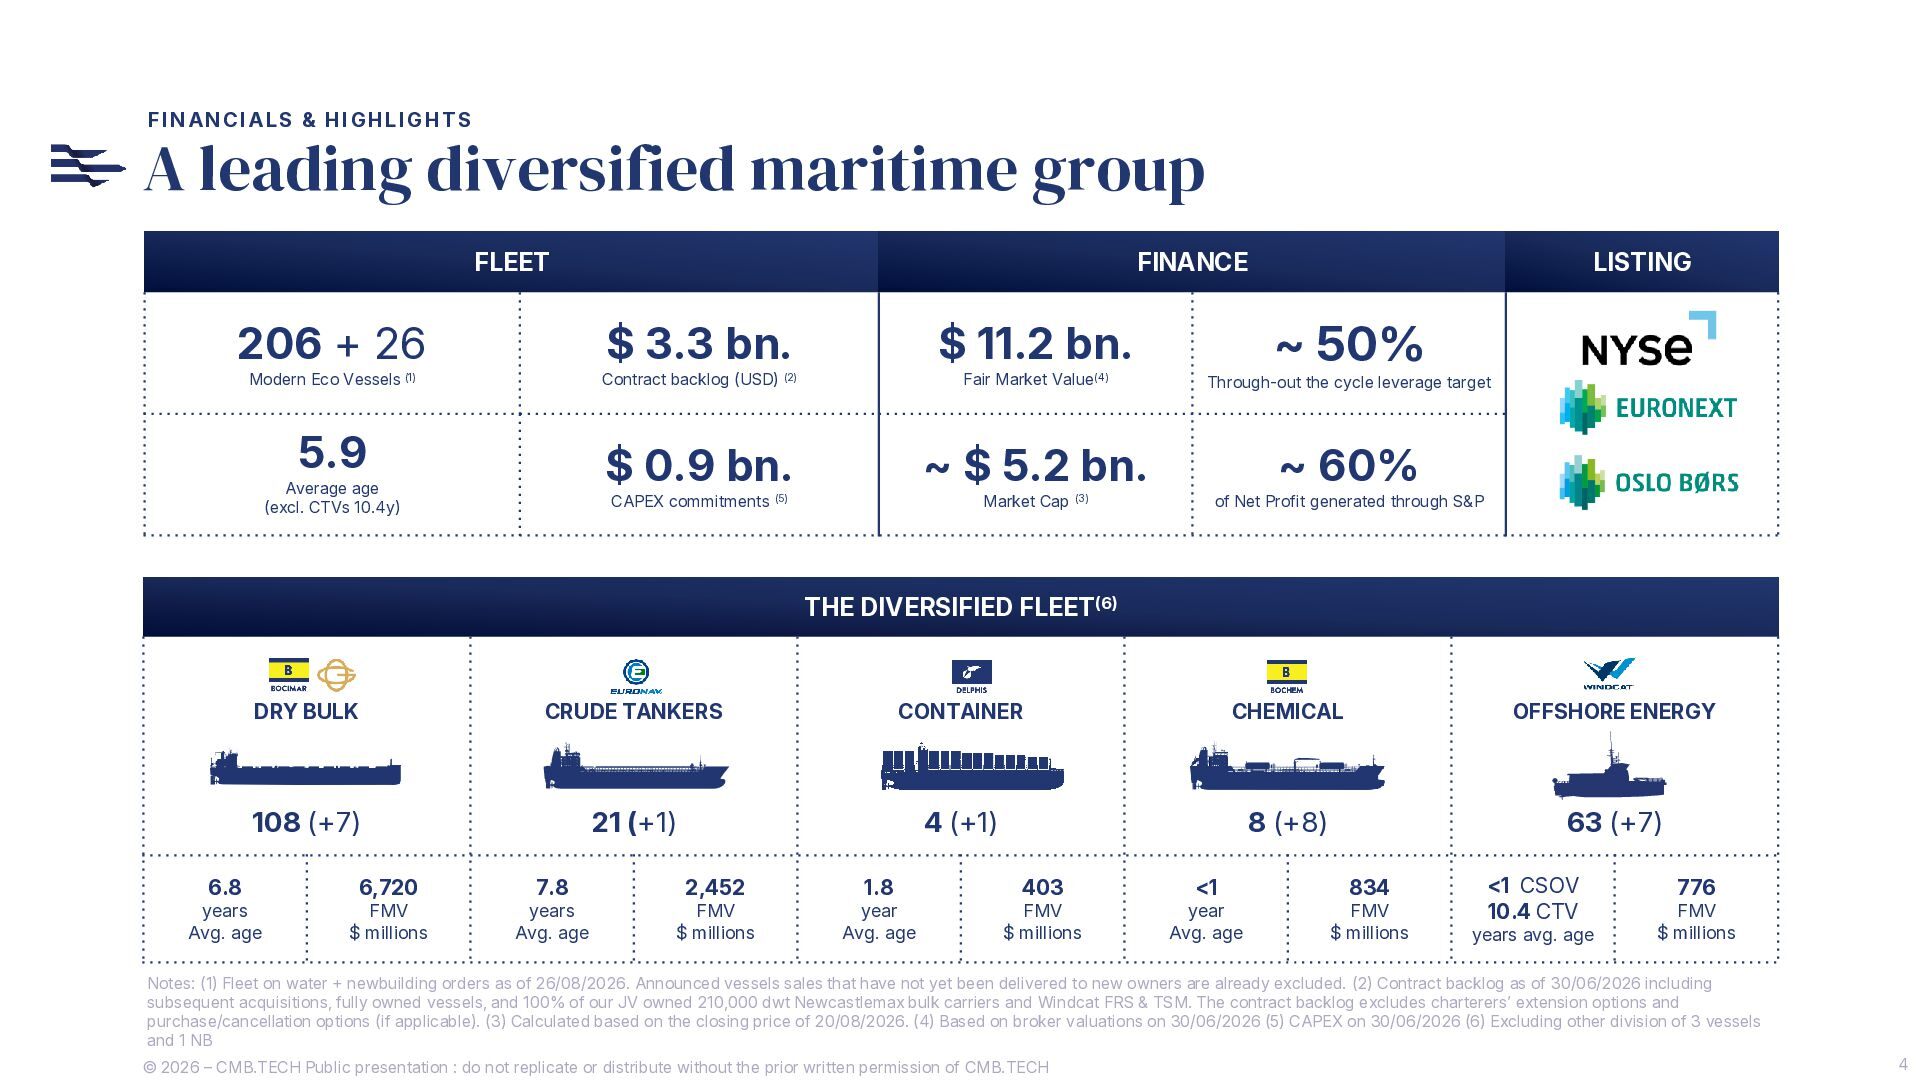
  3. FINANCIALS & HIGHLIGHTS A leading diversified maritime group FLEET 206

    + 26 FINANCE $ 3.3 bn. Modern Eco Vessels (1) 5.9 Fair Market Value(4) $ 0.9 bn. Average age (excl. CTVs 10.4y) ~ 50% $ 11.2 bn. Contract backlog (USD) (2) ~ $ 5.2 bn. CAPEX commitments (5) Market Cap (3) LISTING Through-out the cycle leverage target ~ 60% of Net Profit generated through S&P THE DIVERSIFIED FLEET(6) 6.8 DRY BULK CRUDE TANKERS CONTAINER CHEMICAL OFFSHORE ENERGY 108 (+7) 21 (+1) 4 (+1) 8 (+8) 63 (+7) years Avg. age 6,720 FMV $ millions 7.8 years Avg. age 2,452 FMV $ millions 1.8 year Avg. age 403 FMV $ millions <1 year Avg. age 834 FMV $ millions <1 CSOV 10.4 CTV years avg. age 776 FMV $ millions Notes: (1) Fleet on water + newbuilding orders as of 26/08/2026. Announced vessels sales that have not yet been delivered to new owners are already excluded. (2) Contract backlog as of 30/06/2026 including subsequent acquisitions, fully owned vessels, and 100% of our JV owned 210,000 dwt Newcastlemax bulk carriers and Windcat FRS & TSM. The contract backlog excludes charterers’ extension options and purchase/cancellation options (if applicable). (3) Calculated based on the closing price of 20/08/2026. (4) Based on broker valuations on 30/06/2026 (5) CAPEX on 30/06/2026 (6) Excluding other division of 3 vessels and 1 NB © 2026 – CMB.TECH Public presentation : do not replicate or distribute without the prior written permission of CMB.TECH 4
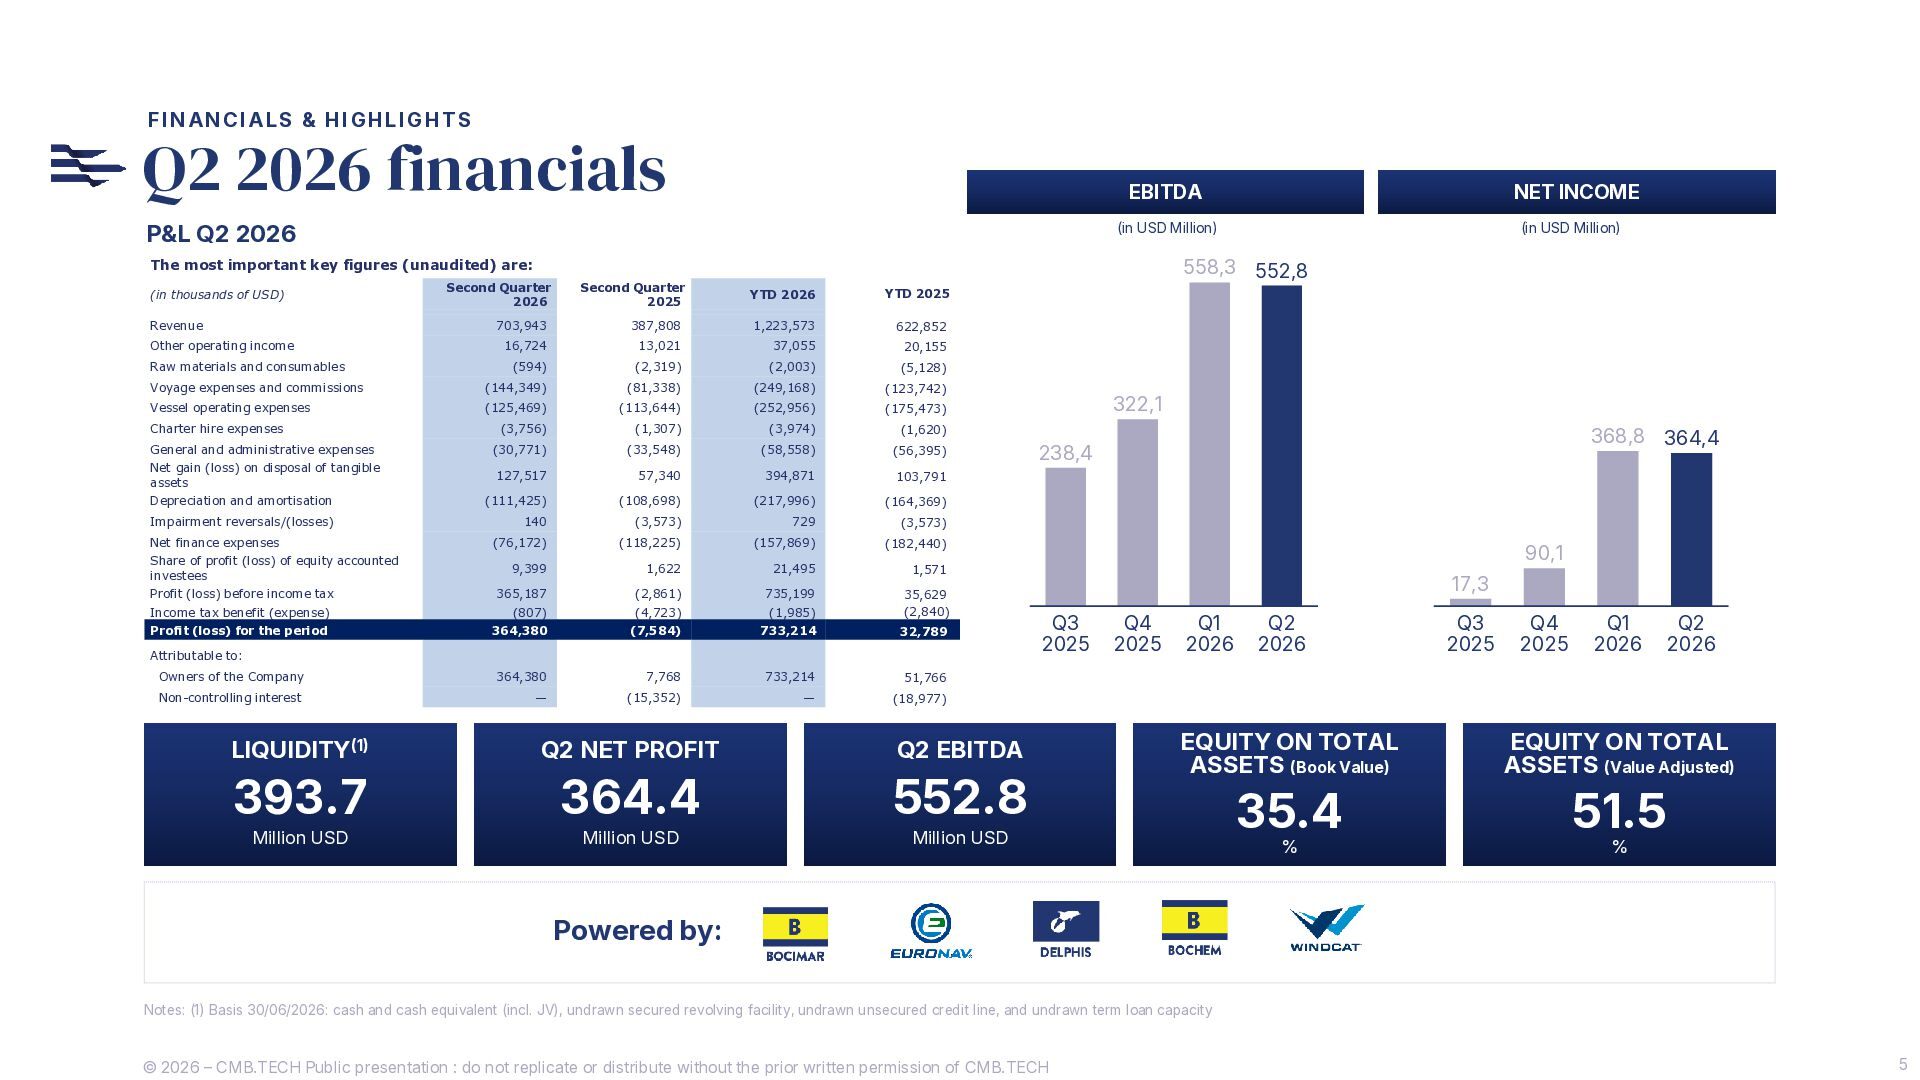
  4. FINANCIALS & HIGHLIGHTS Q2 2026 financials P&L Q2 2026 EBITDA

    NET INCOME (in USD Million) (in USD Million) 558,3 552,8 The most important key figures (unaudited) are: Second Quarter 2026 Second Quarter 2025 YTD 2026 YTD 2025 Revenue 703,943 387,808 1,223,573 622,852 Other operating income 16,724 13,021 37,055 20,155 (594) (2,319) (2,003) (5,128) (in thousands of USD) Raw materials and consumables Voyage expenses and commissions (144,349) (81,338) (249,168) (123,742) Vessel operating expenses (125,469) (113,644) (252,956) (175,473) Charter hire expenses (3,756) (1,307) (3,974) (1,620) General and administrative expenses (30,771) (33,548) (58,558) (56,395) Net gain (loss) on disposal of tangible assets 127,517 57,340 394,871 103,791 (111,425) (108,698) (217,996) (164,369) Depreciation and amortisation Impairment reversals/(losses) 140 (3,573) 729 (3,573) (76,172) (118,225) (157,869) (182,440) 9,399 1,622 21,495 1,571 Profit (loss) before income tax 365,187 (2,861) 735,199 Income tax benefit (expense) (807) (4,723) (1,985) 35,629 (2,840) Profit (loss) for the period 364,380 (7,584) 733,214 32,789 Net finance expenses Share of profit (loss) of equity accounted investees Attributable to: Owners of the Company 364,380 7,768 733,214 51,766 Non-controlling interest — (15,352) — (18,977) LIQUIDITY(1) Q2 NET PROFIT Q2 EBITDA 393.7 364.4 552.8 Million USD Million USD Million USD 322,1 368,8 364,4 238,4 90,1 17,3 Q3 2025 Q4 2025 Q1 2026 Q2 2026 Q3 2025 Q4 2025 Q1 2026 Q2 2026 EQUITY ON TOTAL ASSETS (Book Value) EQUITY ON TOTAL ASSETS (Value Adjusted) 35.4 51.5 % % Powered by: Notes: (1) Basis 30/06/2026: cash and cash equivalent (incl. JV), undrawn secured revolving facility, undrawn unsecured credit line, and undrawn term loan capacity © 2026 – CMB.TECH Public presentation : do not replicate or distribute without the prior written permission of CMB.TECH 5
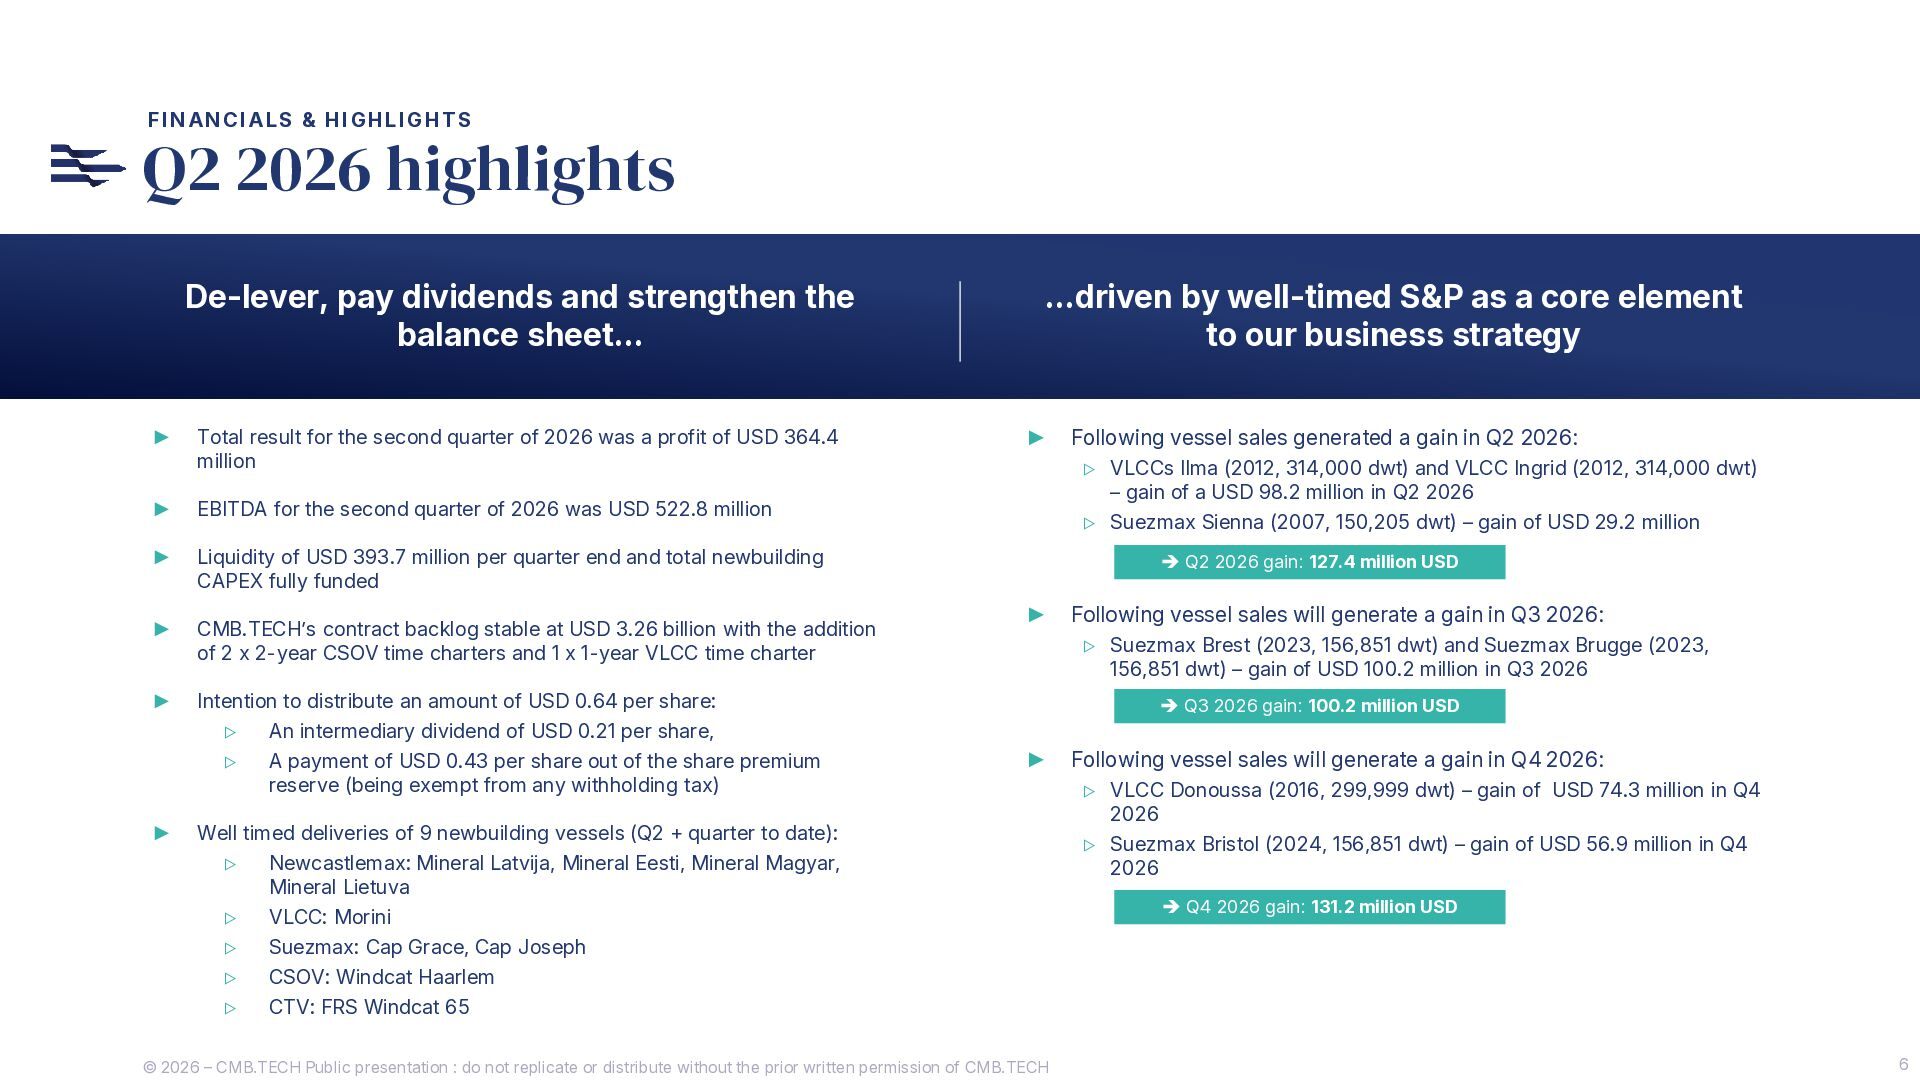
  5. FINANCIALS & HIGHLIGHTS Q2 2026 highlights De-lever, pay dividends and

    strengthen the balance sheet… ► Total result for the second quarter of 2026 was a profit of USD 364.4 million ► EBITDA for the second quarter of 2026 was USD 522.8 million ► Liquidity of USD 393.7 million per quarter end and total newbuilding CAPEX fully funded ► CMB.TECH’s contract backlog stable at USD 3.26 billion with the addition of 2 x 2-year CSOV time charters and 1 x 1-year VLCC time charter ► Intention to distribute an amount of USD 0.64 per share: ► ▷ An intermediary dividend of USD 0.21 per share, ▷ A payment of USD 0.43 per share out of the share premium reserve (being exempt from any withholding tax) …driven by well-timed S&P as a core element to our business strategy ► Newcastlemax: Mineral Latvija, Mineral Eesti, Mineral Magyar, Mineral Lietuva ▷ VLCC: Morini ▷ Suezmax: Cap Grace, Cap Joseph ▷ CSOV: Windcat Haarlem ▷ CTV: FRS Windcat 65 ▷ VLCCs Ilma (2012, 314,000 dwt) and VLCC Ingrid (2012, 314,000 dwt) – gain of a USD 98.2 million in Q2 2026 ▷ Suezmax Sienna (2007, 150,205 dwt) – gain of USD 29.2 million ➔ Q2 2026 gain: 127.4 million USD ► Following vessel sales will generate a gain in Q3 2026: ▷ Suezmax Brest (2023, 156,851 dwt) and Suezmax Brugge (2023, 156,851 dwt) – gain of USD 100.2 million in Q3 2026 ➔ Q3 2026 gain: 100.2 million USD ► Well timed deliveries of 9 newbuilding vessels (Q2 + quarter to date): ▷ Following vessel sales generated a gain in Q2 2026: © 2026 – CMB.TECH Public presentation : do not replicate or distribute without the prior written permission of CMB.TECH Following vessel sales will generate a gain in Q4 2026: ▷ VLCC Donoussa (2016, 299,999 dwt) – gain of USD 74.3 million in Q4 2026 ▷ Suezmax Bristol (2024, 156,851 dwt) – gain of USD 56.9 million in Q4 2026 ➔ Q4 2026 gain: 131.2 million USD 6
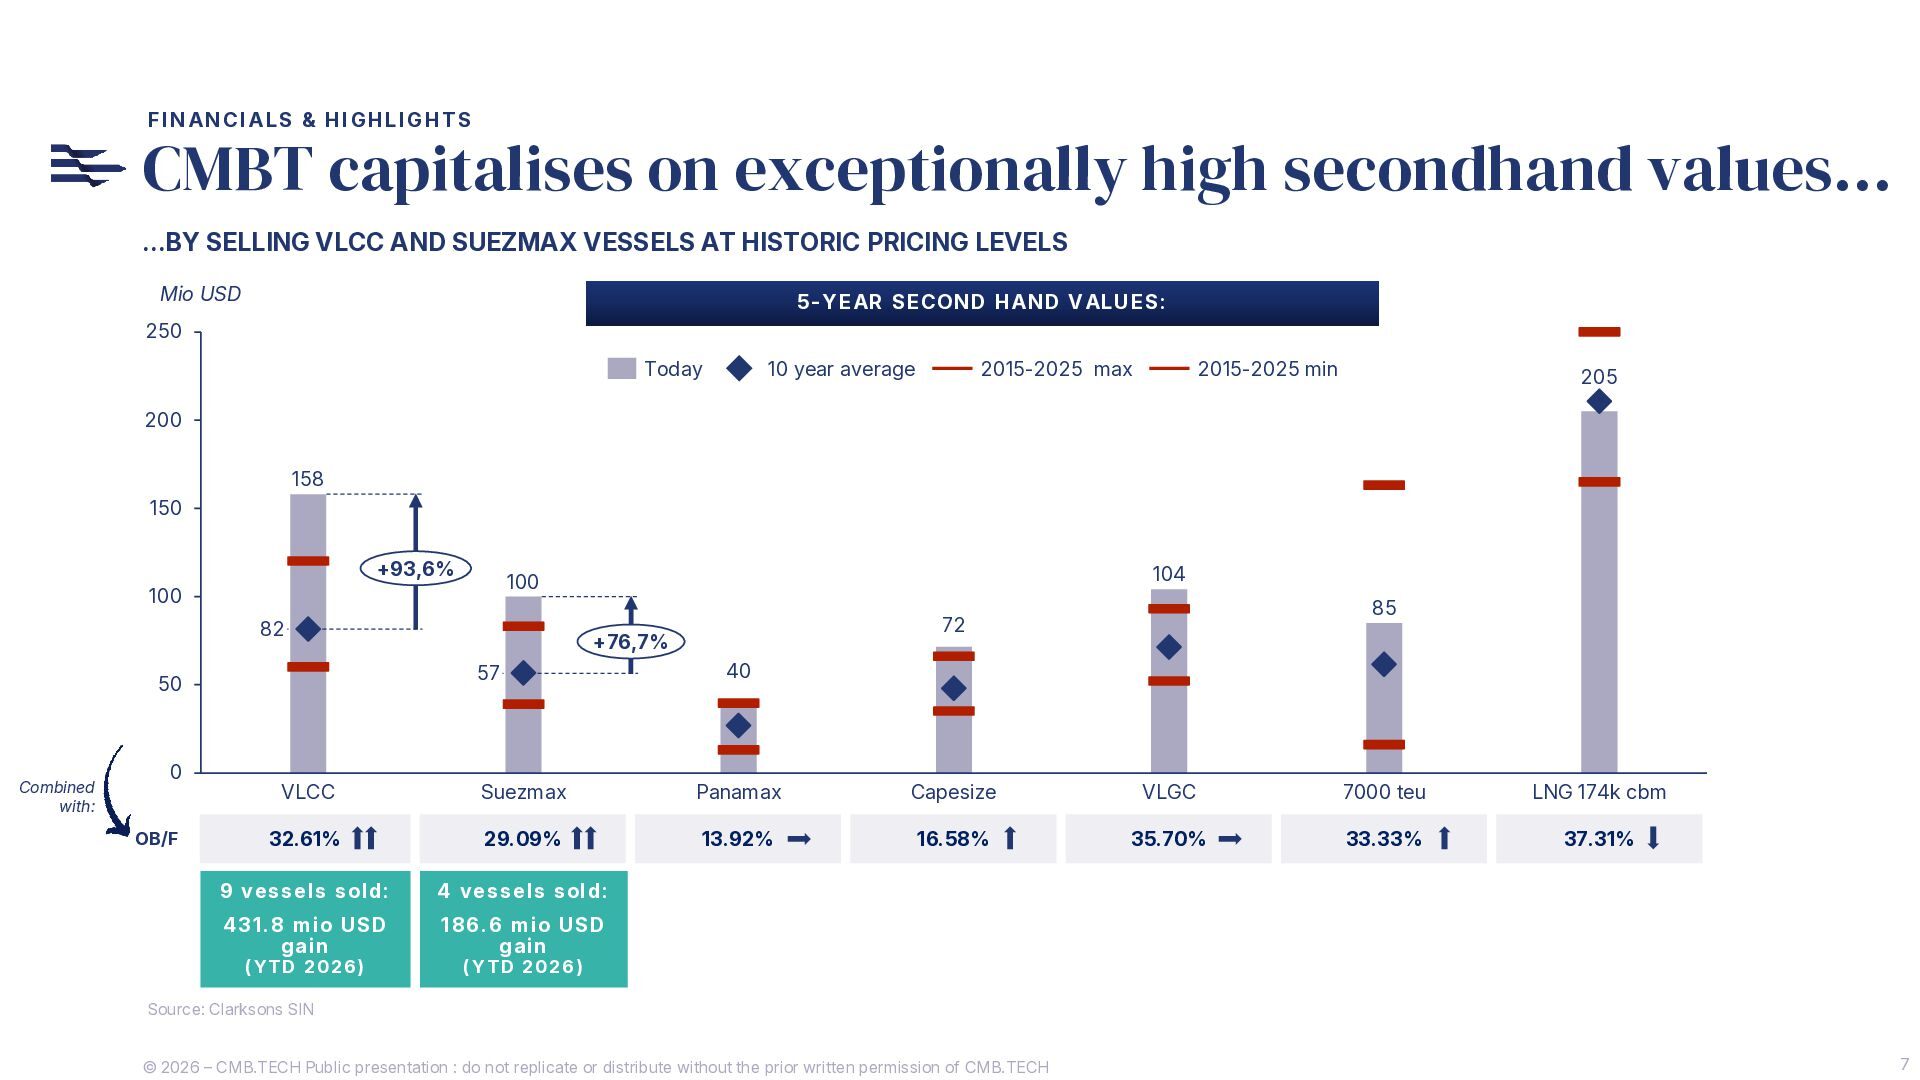
  6. FINANCIALS & HIGHLIGHTS CMBT capitalises on exceptionally high secondhand values…

    …BY SELLING VLCC AND SUEZMAX VESSELS AT HISTORIC PRICING LEVELS Mio USD 5-YEAR SECO ND HAND VALUES: 250 Today 10 year average 2015-2025 max 2015-2025 min 205 200 158 150 +93,6% 82 0 OB/F 85 72 +76,7% 57 50 Combined with: 104 100 100 40 VLCC Suezmax Panamax Capesize VLGC 7000 teu LNG 174k cbm 32.61% 29.09% 13.92% 16.58% 35.70% 33.33% 37.31% 9 vessels sold: 4 vessels sold: 431.8 mio USD ga in 186.6 mio USD gain (YTD 2026) (YTD 2026) Source: Clarksons SIN © 2026 – CMB.TECH Public presentation : do not replicate or distribute without the prior written permission of CMB.TECH 7
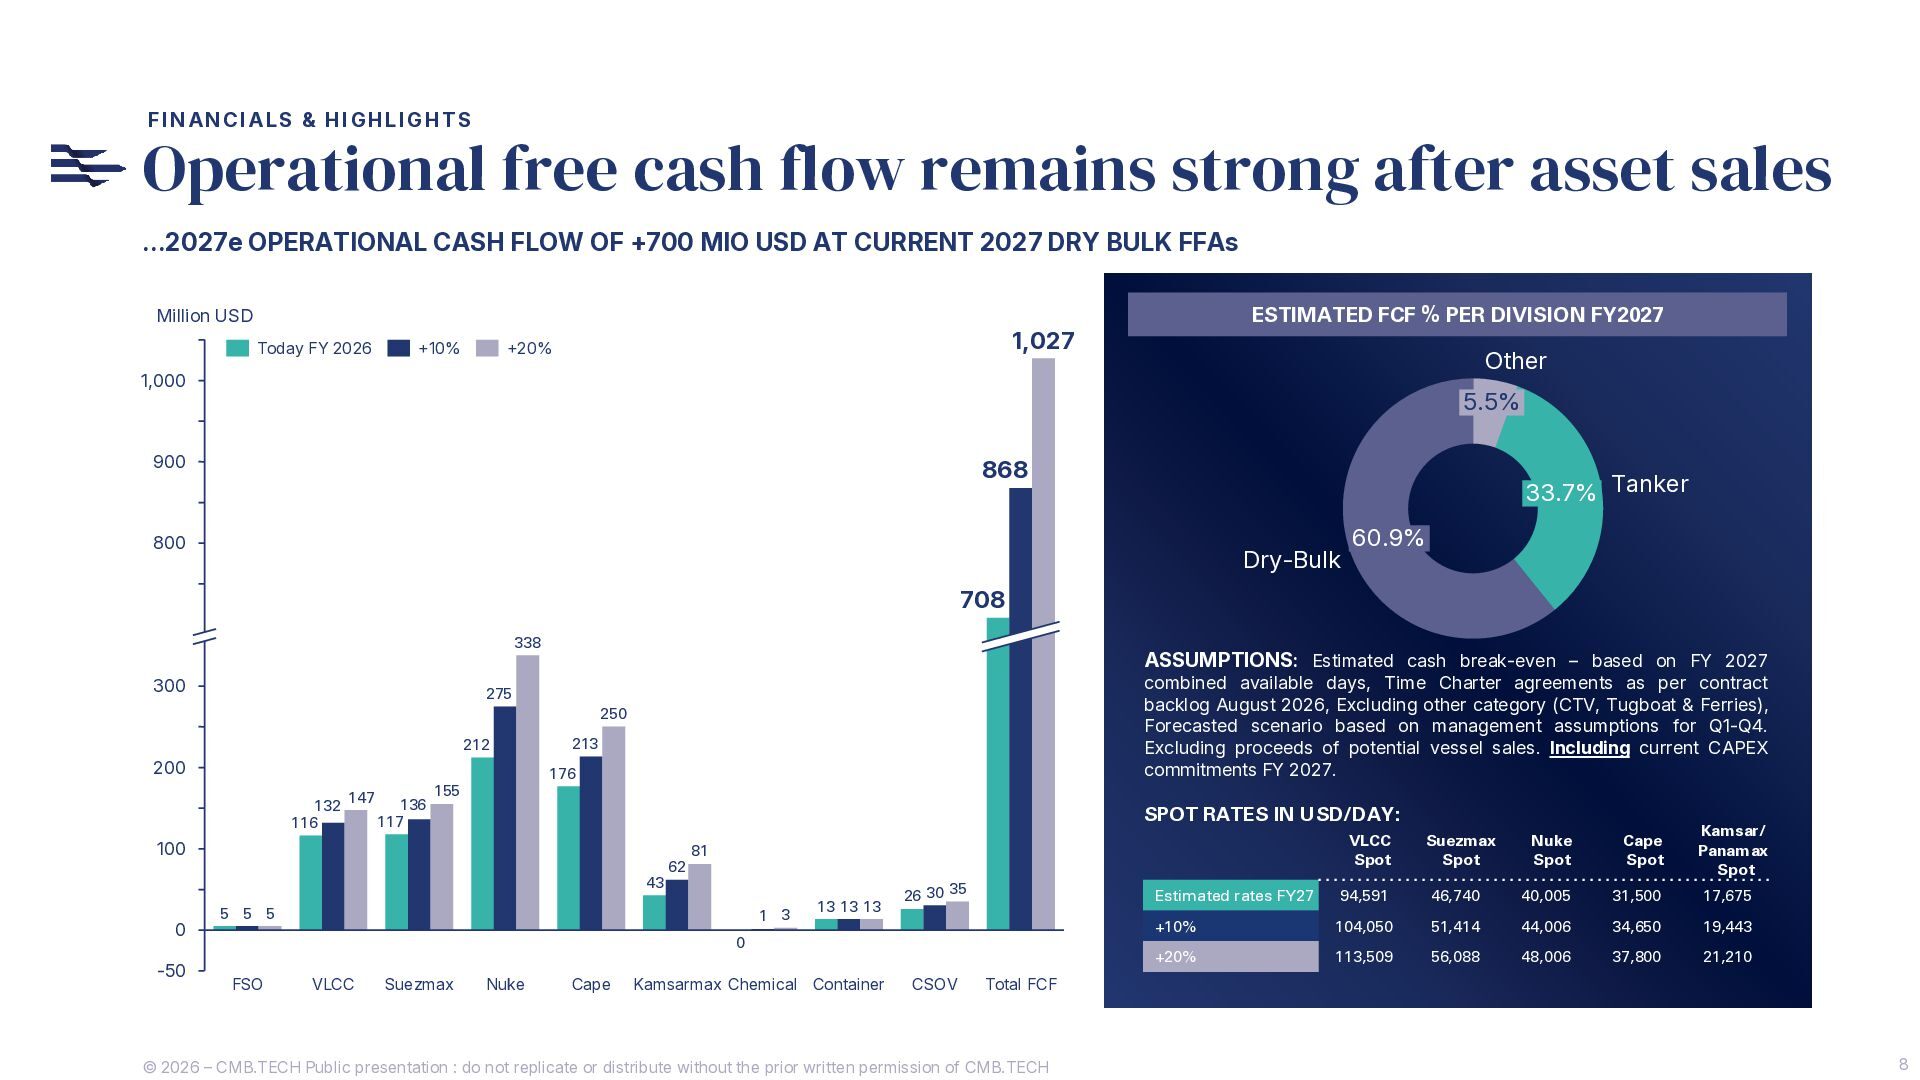
  7. FINANCIALS & HIGHLIGHTS Operational free cash flow remains strong after

    asset sales …2027e OPERATIONAL CASH FLOW OF +700 MIO USD AT CURRENT 2027 DRY BULK FFAs Million USD Today FY 2026 +10% ESTIMATED FCF % PER DIVISION FY2027 1,027 +20% Other 1,000 5.5% 900 868 33.7% Tanker 800 Dry-Bulk 60.9% 708 338 300 ASSUMPTIONS: Estimated cash break-even – based on FY 2027 combined available days, Time Charter agreements as per contract backlog August 2026, Excluding other category (CTV, Tugboat & Ferries), Forecasted scenario based on management assumptions for Q1-Q4. Excluding proceeds of potential vessel sales. Including current CAPEX commitments FY 2027. 275 250 212 200 132 116 147 136 117 213 176 155 SPOT RATES IN USD/DAY: 100 43 0 -50 62 5 5 5 1 3 13 13 13 26 30 35 0 FSO VLCC Suezmax Nuke Cape VLCC Spot Suezmax Spot Nuke Spot Cape Spot Kamsar/ Panamax Spot Estimated rates FY27 94,591 46,740 40,005 31,500 17,675 +10% 104,050 51,414 44,006 34,650 19,443 +20% 113,509 56,088 48,006 37,800 21,210 81 Kamsarmax Chemical Container CSOV Total FCF © 2026 – CMB.TECH Public presentation : do not replicate or distribute without the prior written permission of CMB.TECH 8
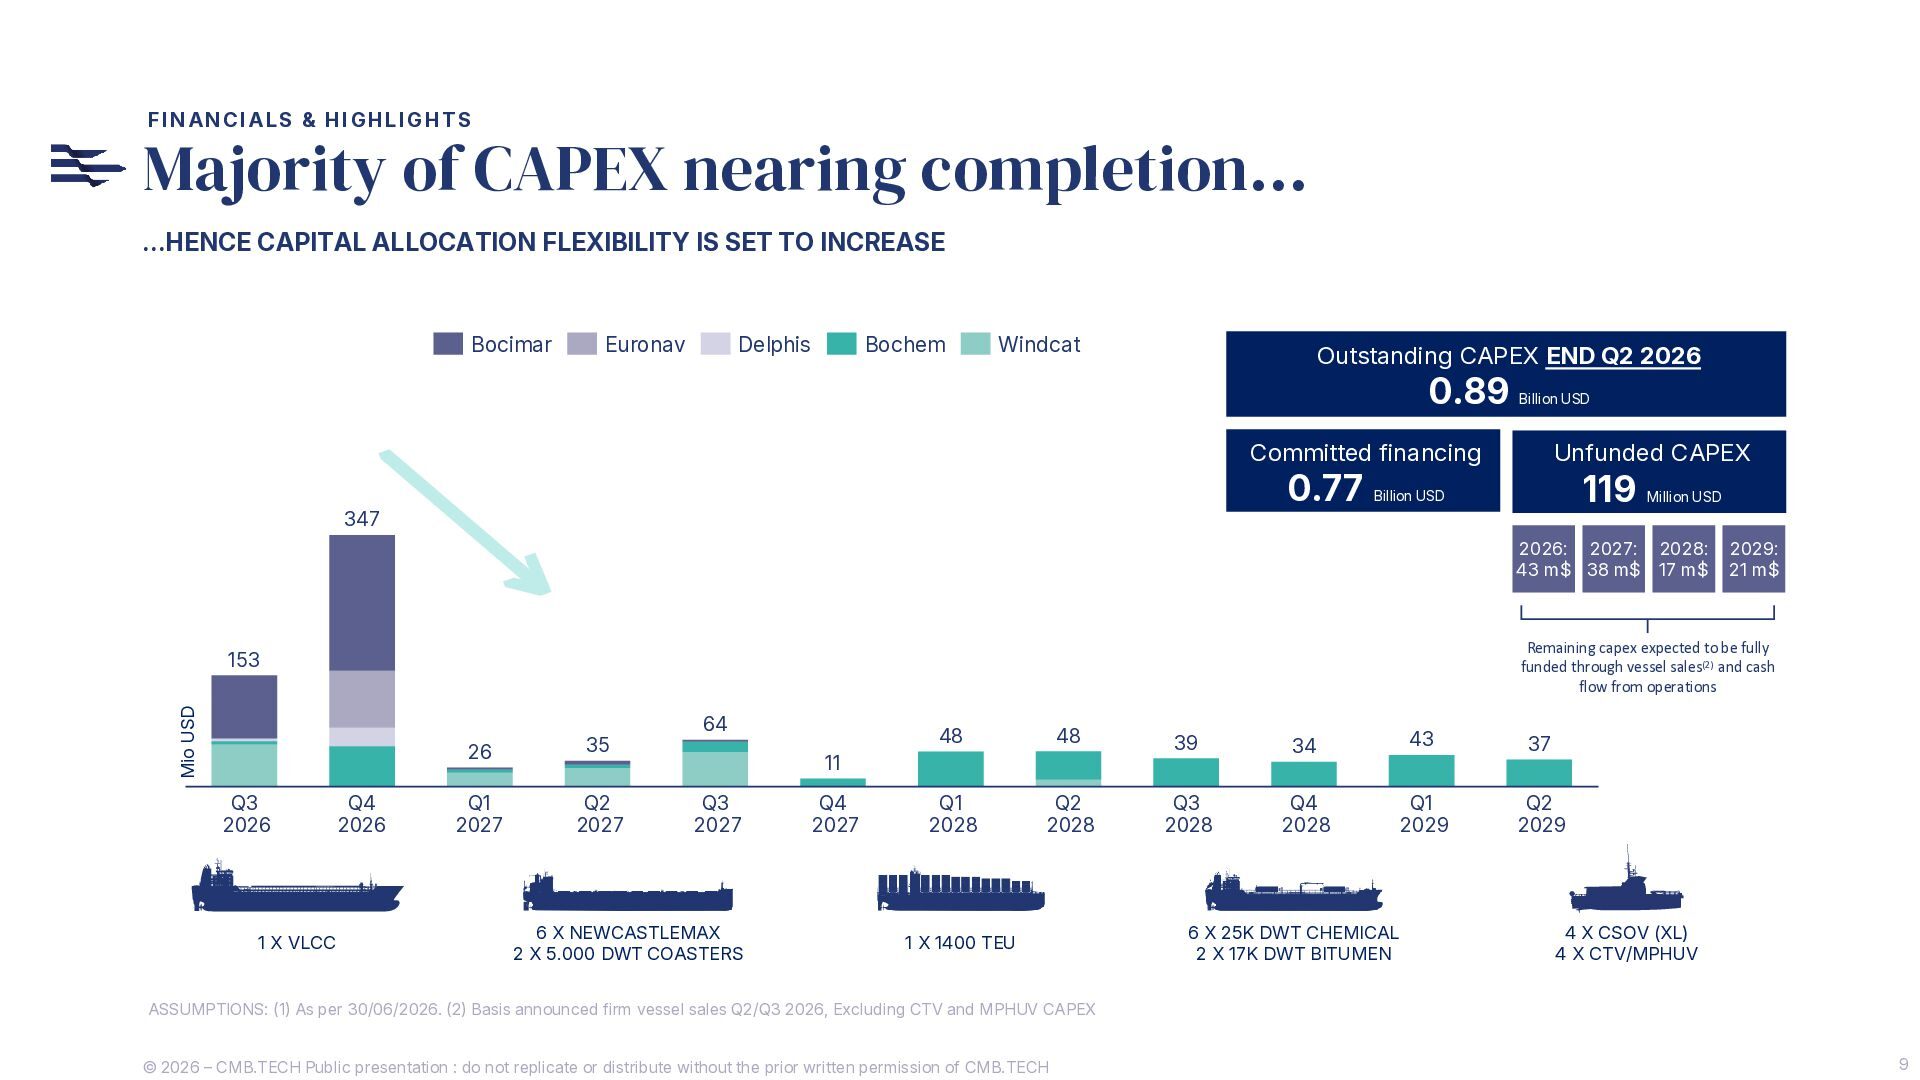
  8. FINANCIALS & HIGHLIGHTS Majority of CAPEX nearing completion… …HENCE CAPITAL

    ALLOCATION FLEXIBILITY IS SET TO INCREASE Bocimar Euronav Delphis Bochem Windcat Outstanding CAPEX END Q2 2026 0.89 Billion USD Committed financing 0.77 347 Unfunded CAPEX 119 Billion USD 2026: 2027: 43 m$ 38 m$ Mio USD 1 X VLCC 2028: 17 m$ 2029: 21 m$ Remaining capex expected to be fully funded through vessel sales(2) and cash flow from operations 153 Q3 2026 Million USD Q4 2026 26 35 Q1 2027 Q2 2027 64 48 48 39 34 43 37 Q1 2028 Q2 2028 Q3 2028 Q4 2028 Q1 2029 Q2 2029 11 Q3 2027 6 X NEWCASTLEMAX 2 X 5.000 DWT COASTERS Q4 2027 1 X 1400 TEU 6 X 25K DWT CHEMICAL 2 X 17K DWT BITUMEN 4 X CSOV (XL) 4 X CTV/MPHUV ASSUMPTIONS: (1) As per 30/06/2026. (2) Basis announced firm vessel sales Q2/Q3 2026, Excluding CTV and MPHUV CAPEX © 2026 – CMB.TECH Public presentation : do not replicate or distribute without the prior written permission of CMB.TECH 9
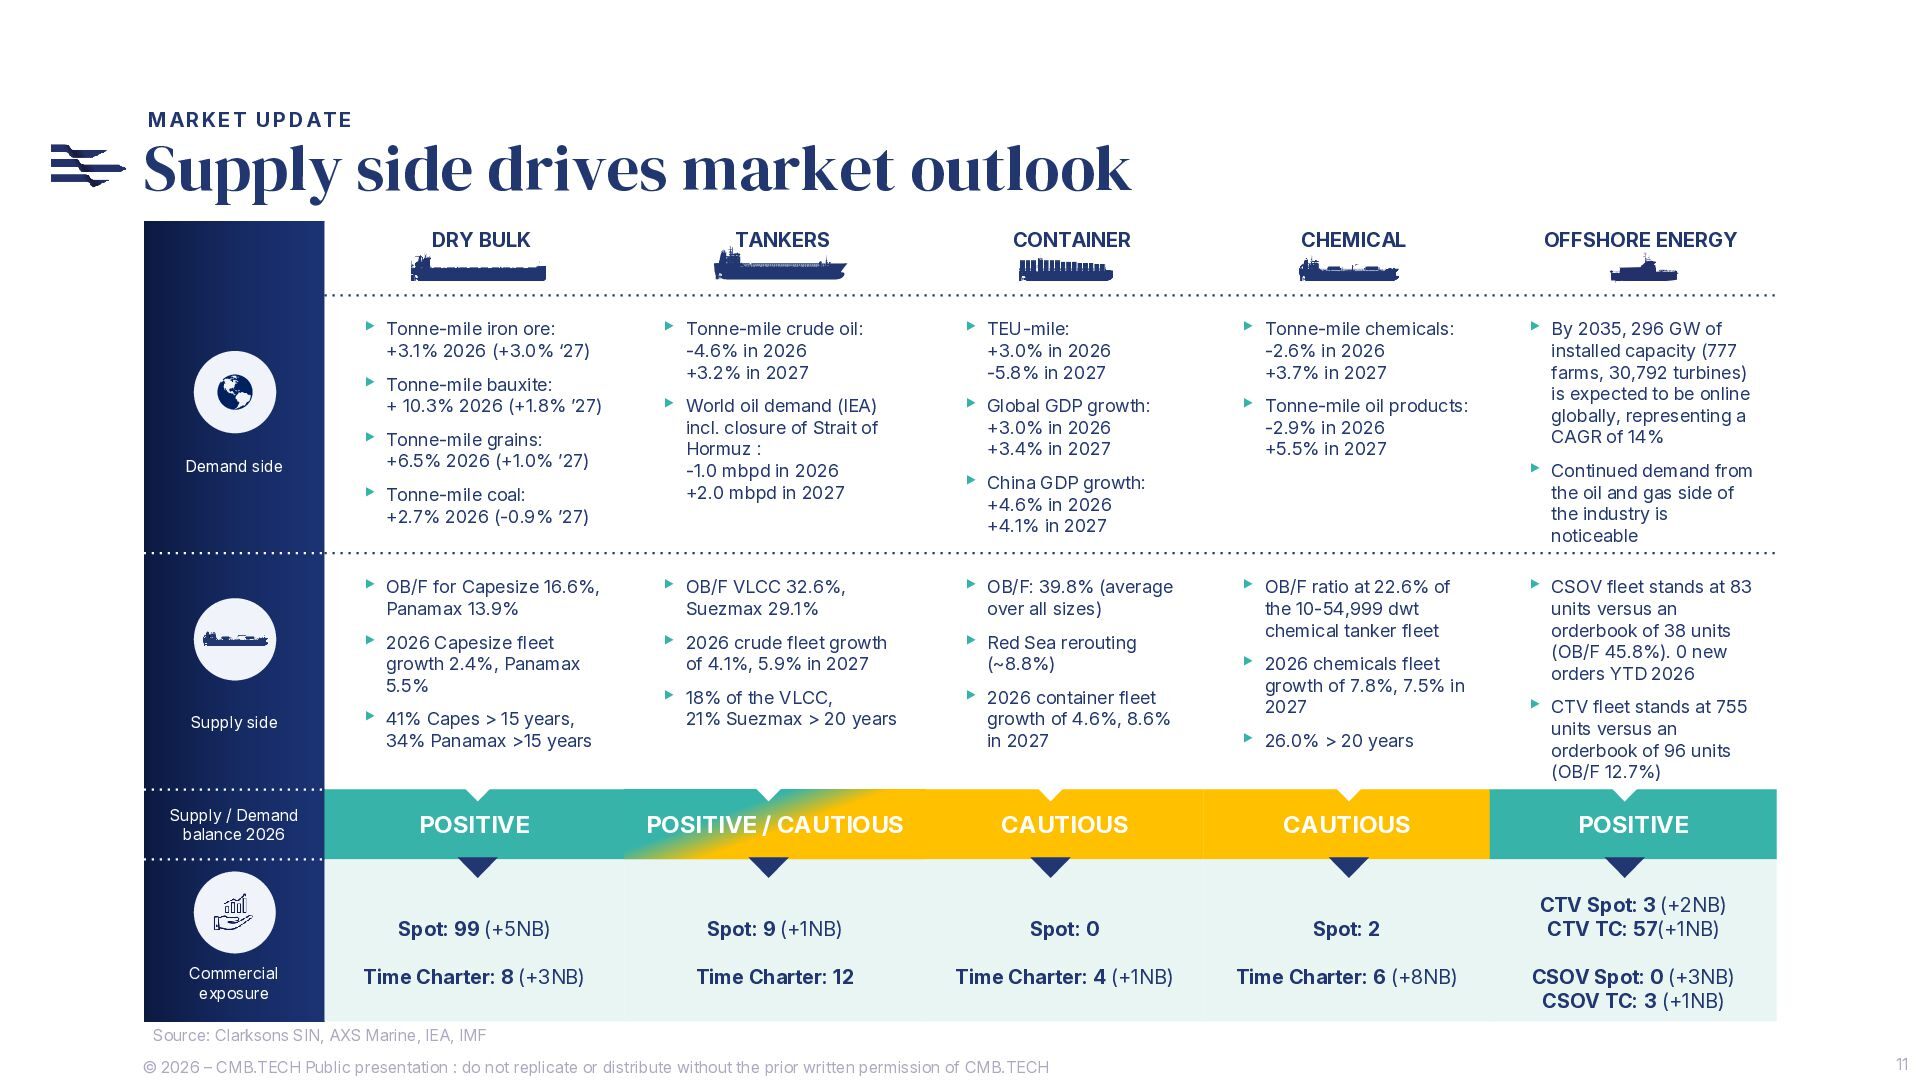
  9. MARKET UPDATE Supply side drives market outlook DRY BULK ▸

    Tonne-mile iron ore: +3.1% 2026 (+3.0% ‘27) ▸ Tonne-mile bauxite: + 10.3% 2026 (+1.8% ’27) ▸ Tonne-mile grains: Demand side +6.5% 2026 (+1.0% ’27) ▸ Tonne-mile coal: TANKERS CONTAINER ▸ Tonne-mile crude oil: ▸ TEU-mile: ▸ Tonne-mile chemicals: ▸ World oil demand (IEA) ▸ Global GDP growth: ▸ Tonne-mile oil products: -4.6% in 2026 +3.2% in 2027 incl. closure of Strait of Hormuz : -1.0 mbpd in 2026 +2.0 mbpd in 2027 +2.7% 2026 (-0.9% ’27) +3.0% in 2026 -5.8% in 2027 +3.0% in 2026 +3.4% in 2027 ▸ OB/F: 39.8% (average ▸ 2026 Capesize fleet ▸ 2026 crude fleet growth ▸ Red Sea rerouting ▸ 18% of the VLCC, ▸ 2026 container fleet growth 2.4%, Panamax 5.5% of 4.1%, 5.9% in 2027 -2.9% in 2026 +5.5% in 2027 over all sizes) (~8.8%) OFFSHORE ENERGY ▸ By 2035, 296 GW of installed capacity (777 farms, 30,792 turbines) is expected to be online globally, representing a CAGR of 14% ▸ Continued demand from the oil and gas side of the industry is noticeable +4.6% in 2026 +4.1% in 2027 ▸ OB/F VLCC 32.6%, Suezmax 29.1% -2.6% in 2026 +3.7% in 2027 ▸ China GDP growth: ▸ OB/F for Capesize 16.6%, Panamax 13.9% CHEMICAL ▸ OB/F ratio at 22.6% of the 10-54,999 dwt chemical tanker fleet ▸ 2026 chemicals fleet growth of 7.8%, 7.5% in 2027 ▸ CSOV fleet stands at 83 units versus an orderbook of 38 units (OB/F 45.8%). 0 new orders YTD 2026 ▸ CTV fleet stands at 755 Supply side ▸ 41% Capes > 15 years, Supply / Demand balance 2026 POSITIVE POSITIVE / CAUTIOUS CAUTIOUS CAUTIOUS POSITIVE Spot: 99 (+5NB) Spot: 9 (+1NB) Spot: 0 Spot: 2 CTV Spot: 3 (+2NB) CTV TC: 57(+1NB) Time Charter: 8 (+3NB) Time Charter: 12 Time Charter: 4 (+1NB) Time Charter: 6 (+8NB) Commercial exposure 34% Panamax >15 years 21% Suezmax > 20 years growth of 4.6%, 8.6% in 2027 ▸ 26.0% > 20 years units versus an orderbook of 96 units (OB/F 12.7%) CSOV Spot: 0 (+3NB) CSOV TC: 3 (+1NB) Source: Clarksons SIN, AXS Marine, IEA, IMF © 2026 – CMB.TECH Public presentation : do not replicate or distribute without the prior written permission of CMB.TECH 11
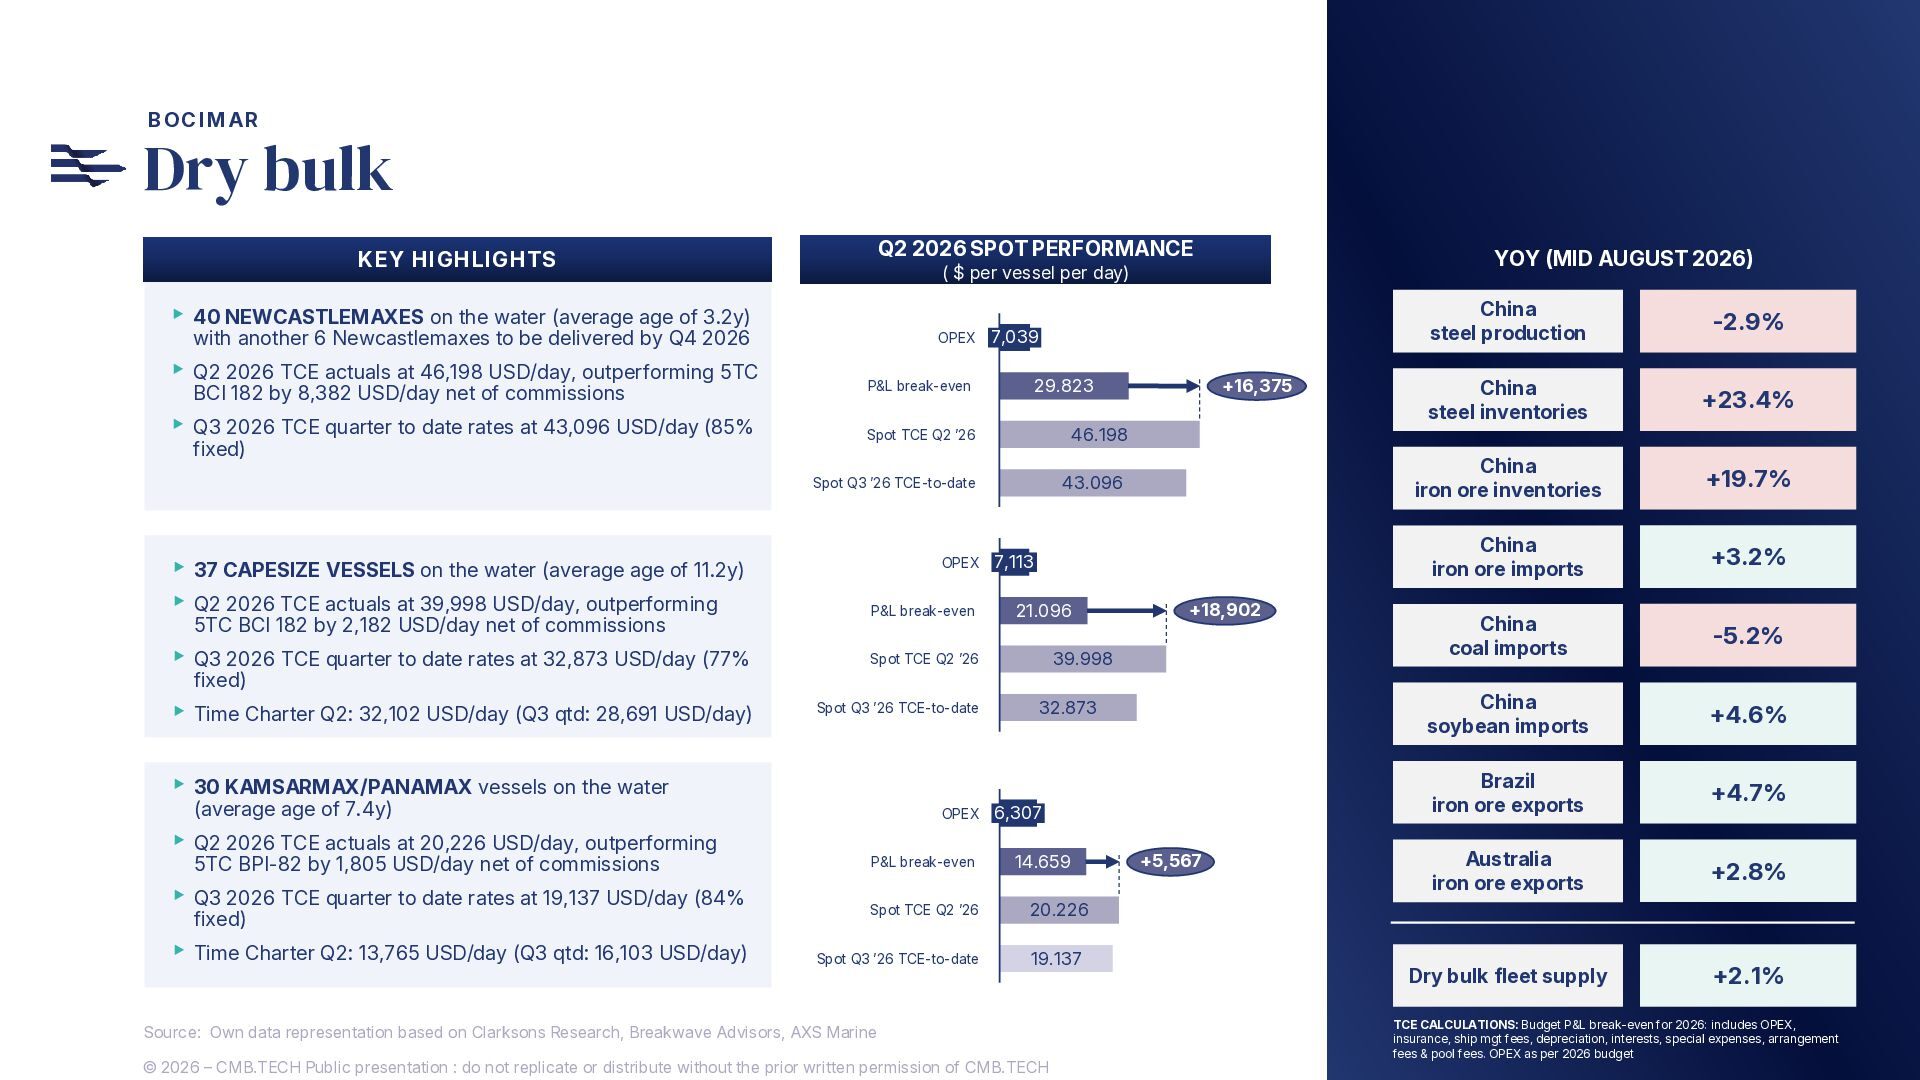
  10. BOCIMAR Dry bulk Q2 2026 SPOT PERFORMANCE KEY HIGHLIGHTS ▸

    40 NEWCASTLEMAXES on the water (average age of 3.2y) with another 6 Newcastlemaxes to be delivered by Q4 2026 ▸ Q2 2026 TCE actuals at 46,198 USD/day, outperforming 5TC BCI 182 by 8,382 USD/day net of commissions ▸ Q3 2026 TCE quarter to date rates at 43,096 USD/day (85% fixed) OPEX P&L break-even 7,039 46.198 Spot Q3 ’26 TCE-to-date 43.096 P&L break-even ▸ Q3 2026 TCE quarter to date rates at 32,873 USD/day (77% Spot TCE Q2 ’26 ▸ Time Charter Q2: 32,102 USD/day (Q3 qtd: 28,691 USD/day) Spot Q3 ’26 TCE-to-date OPEX +16,375 29.823 Spot TCE Q2 ’26 ▸ 37 CAPESIZE VESSELS on the water (average age of 11.2y) ▸ Q2 2026 TCE actuals at 39,998 USD/day, outperforming 5TC BCI 182 by 2,182 USD/day net of commissions 7,113 21.096 +18,902 39.998 fixed) 32.873 ▸ 30 KAMSARMAX/PANAMAX vessels on the water (average age of 7.4y) ▸ Q2 2026 TCE actuals at 20,226 USD/day, outperforming 5TC BPI-82 by 1,805 USD/day net of commissions ▸ Q3 2026 TCE quarter to date rates at 19,137 USD/day (84% fixed) ▸ Time Charter Q2: 13,765 USD/day (Q3 qtd: 16,103 USD/day) YOY (MID AUGUST 2026) ( $ per vessel per day) OPEX P&L break-even 6,307 14.659 Spot TCE Q2 ’26 20.226 Spot Q3 ’26 TCE-to-date 19.137 Source: Own data representation based on Clarksons Research, Breakwave Advisors, AXS Marine © 2026 – CMB.TECH Public presentation : do not replicate or distribute without the prior written permission of CMB.TECH +5,567 China steel production -2.9% China steel inventories +23.4% China iron ore inventories +19.7% China iron ore imports +3.2% China coal imports -5.2% China soybean imports +4.6% Brazil iron ore exports +4.7% Australia iron ore exports +2.8% Dry bulk fleet supply +2.1% TCE CALCULATIONS: Budget P&L break-even for 2026: includes OPEX, insurance, ship mgt fees, depreciation, interests, special expenses, arrangement fees & pool fees. OPEX as per 2026 budget 1313
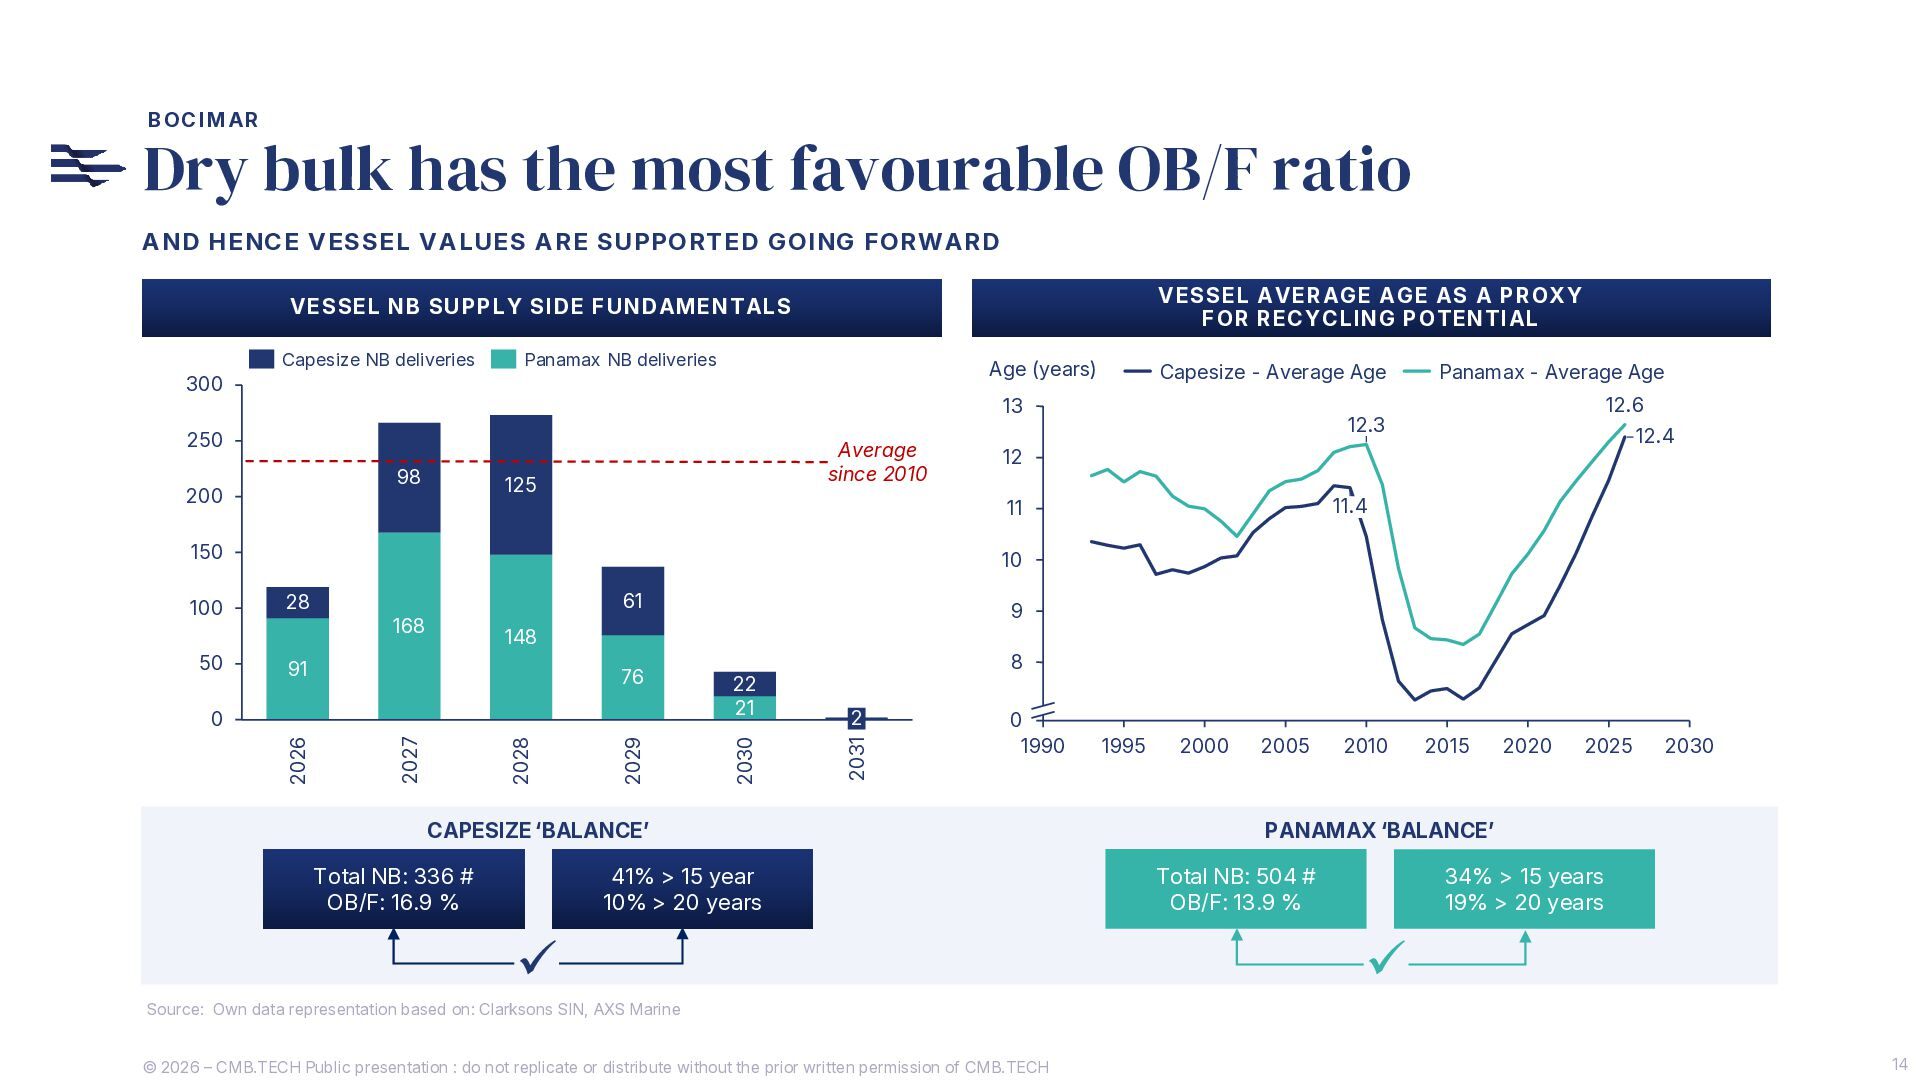
  11. BOCIMAR Dry bulk has the most favourable OB/F ratio AND

    HENCE VESSEL VALUES ARE SUPPORTED GOING FORWARD VESSEL AVERAGE AGE AS A PROXY FOR RECYCLING POTENTIAL VESSEL NB SUPPLY SIDE FUNDAMENTALS Capesize NB deliveries Panamax NB deliveries Age (years) 300 13 250 98 200 Average since 2010 125 12.6 12.4 12 11.4 10 61 168 91 76 2029 2028 2027 0 2026 9 148 22 21 8 2 2031 28 2030 50 Panamax - Average Age 12.3 11 150 100 Capesize - Average Age 0 1990 CAPESIZE ‘BALANCE’ Total NB: 336 # OB/F: 16.9 % 41% > 15 year 10% > 20 years ✓ 1995 2000 2005 2010 2015 2020 2025 2030 PANAMAX ‘BALANCE’ Total NB: 504 # OB/F: 13.9 % 34% > 15 years 19% > 20 years ✓ Source: Own data representation based on: Clarksons SIN, AXS Marine © 2026 – CMB.TECH Public presentation : do not replicate or distribute without the prior written permission of CMB.TECH 14
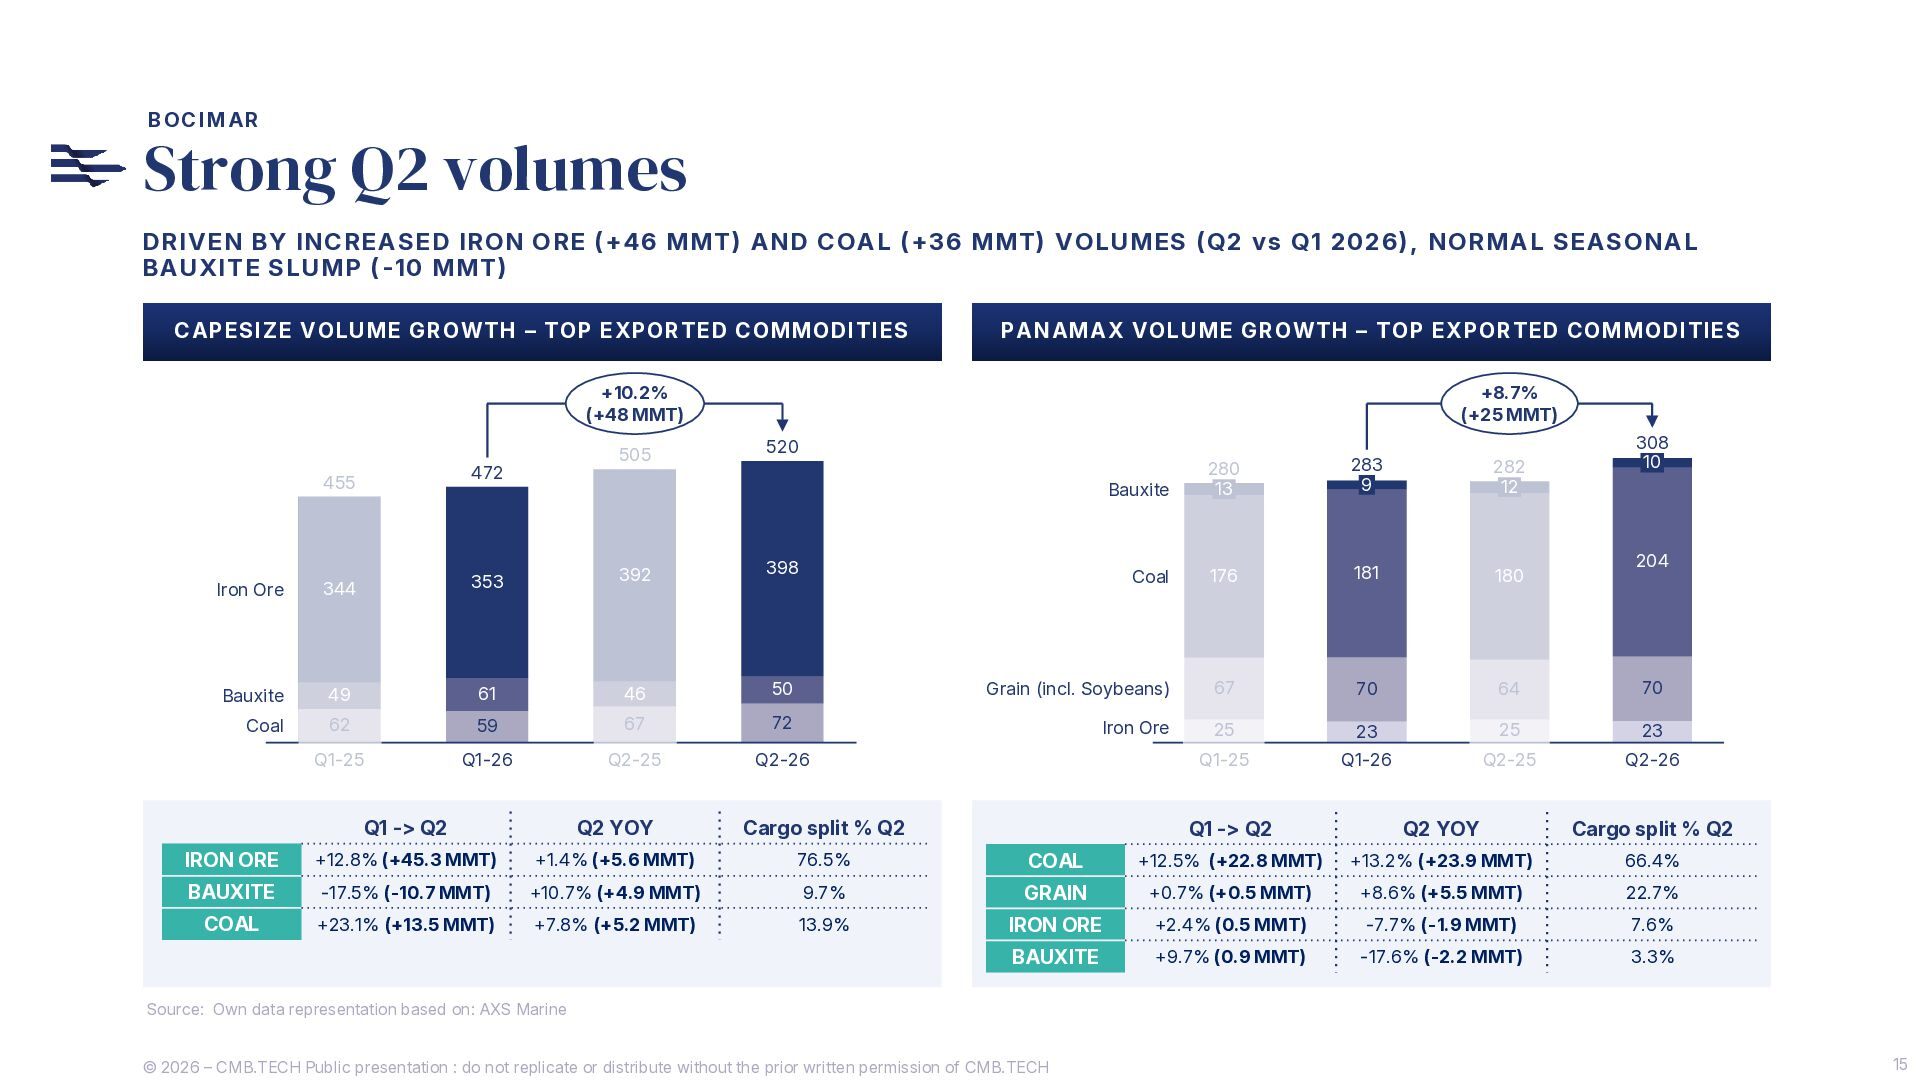
  12. BOCIMAR Strong Q2 volumes DRIVEN BY INCREASED IRON ORE (+46

    MMT) AND COAL (+36 MMT) VOLUMES (Q2 vs Q1 2026), NORMAL SEASONAL BAUXITE SLUMP (-10 MMT) CAPESIZE VOLUME GROWTH – TOP EXPORTED COMMODITIES PANAMAX VOLUME GROWTH – TOP EXPORTED COMMODITIES +10.2% (+48 MMT) 505 472 455 +8.7% (+25 MMT) 520 Bauxite 280 13 283 9 282 12 392 398 Coal 176 181 180 67 70 64 308 10 204 Iron Ore 344 353 Bauxite 49 61 46 50 Grain (incl. Soybeans) Coal 62 59 67 72 Iron Ore 25 23 25 23 Q1-25 Q1-26 Q2-25 Q2-26 Q1-25 Q1-26 Q2-25 Q2-26 Q1 -> Q2 Q2 YOY Cargo split % Q2 70 Q1 -> Q2 Q2 YOY Cargo split % Q2 IRON ORE +12.8% (+45.3 MMT) +1.4% (+5.6 MMT) 76.5% COAL +12.5% (+22.8 MMT) +13.2% (+23.9 MMT) 66.4% BAUXITE -17.5% (-10.7 MMT) +10.7% (+4.9 MMT) 9.7% GRAIN +0.7% (+0.5 MMT) +8.6% (+5.5 MMT) 22.7% COAL +23.1% (+13.5 MMT) +7.8% (+5.2 MMT) 13.9% IRON ORE +2.4% (0.5 MMT) -7.7% (-1.9 MMT) 7.6% BAUXITE +9.7% (0.9 MMT) -17.6% (-2.2 MMT) 3.3% Source: Own data representation based on: AXS Marine © 2026 – CMB.TECH Public presentation : do not replicate or distribute without the prior written permission of CMB.TECH 15
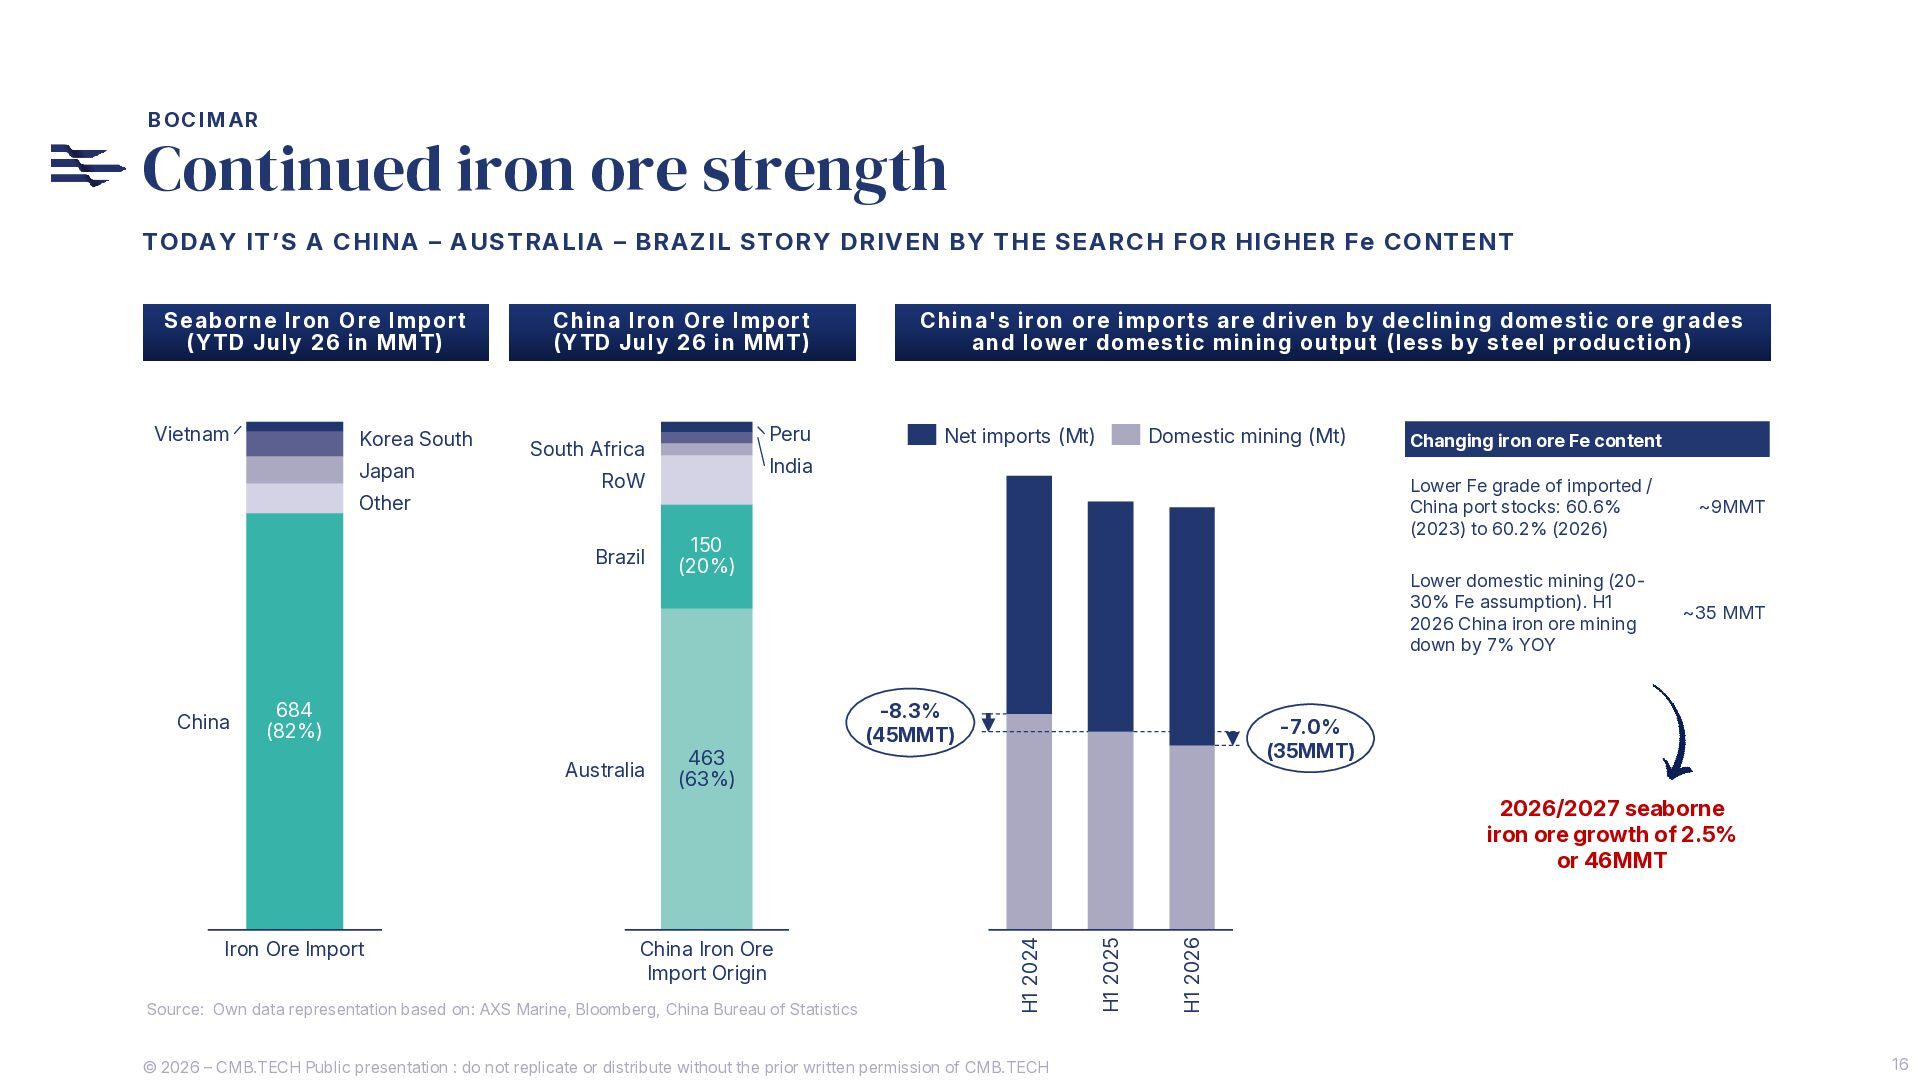
  13. BOCIMAR Continued iron ore strength TODAY IT’S A CHINA –

    AUSTRALIA – BRAZIL STORY DRIVEN BY THE SEARCH FOR HIGHER Fe CONTENT Seaborne Iron Ore Import (YTD July 26 in MMT) Vietnam Korea South Japan Other China Iron Ore Import (YTD July 26 in MMT) Domestic mining (Mt) 150 (20%) 684 (82%) Australia Net imports (Mt) India RoW Brazil China Peru South Africa China's iron ore imports are driven by declining domestic ore grades and lower domestic mining output (less by steel production) 463 (63%) -8.3% (45MMT) Changing iron ore Fe content Lower Fe grade of imported / China port stocks: 60.6% (2023) to 60.2% (2026) ~9MMT Lower domestic mining (2030% Fe assumption). H1 2026 China iron ore mining down by 7% YOY ~35 MMT -7.0% (35MMT) Source: Own data representation based on: AXS Marine, Bloomberg, China Bureau of Statistics © 2026 – CMB.TECH Public presentation : do not replicate or distribute without the prior written permission of CMB.TECH H1 2026 China Iron Ore Import Origin H1 2025 Iron Ore Import H1 2024 2026/2027 seaborne iron ore growth of 2.5% or 46MMT 16
  14. BOCIMAR Continued iron ore strength TODAY IT’S A CHINA –

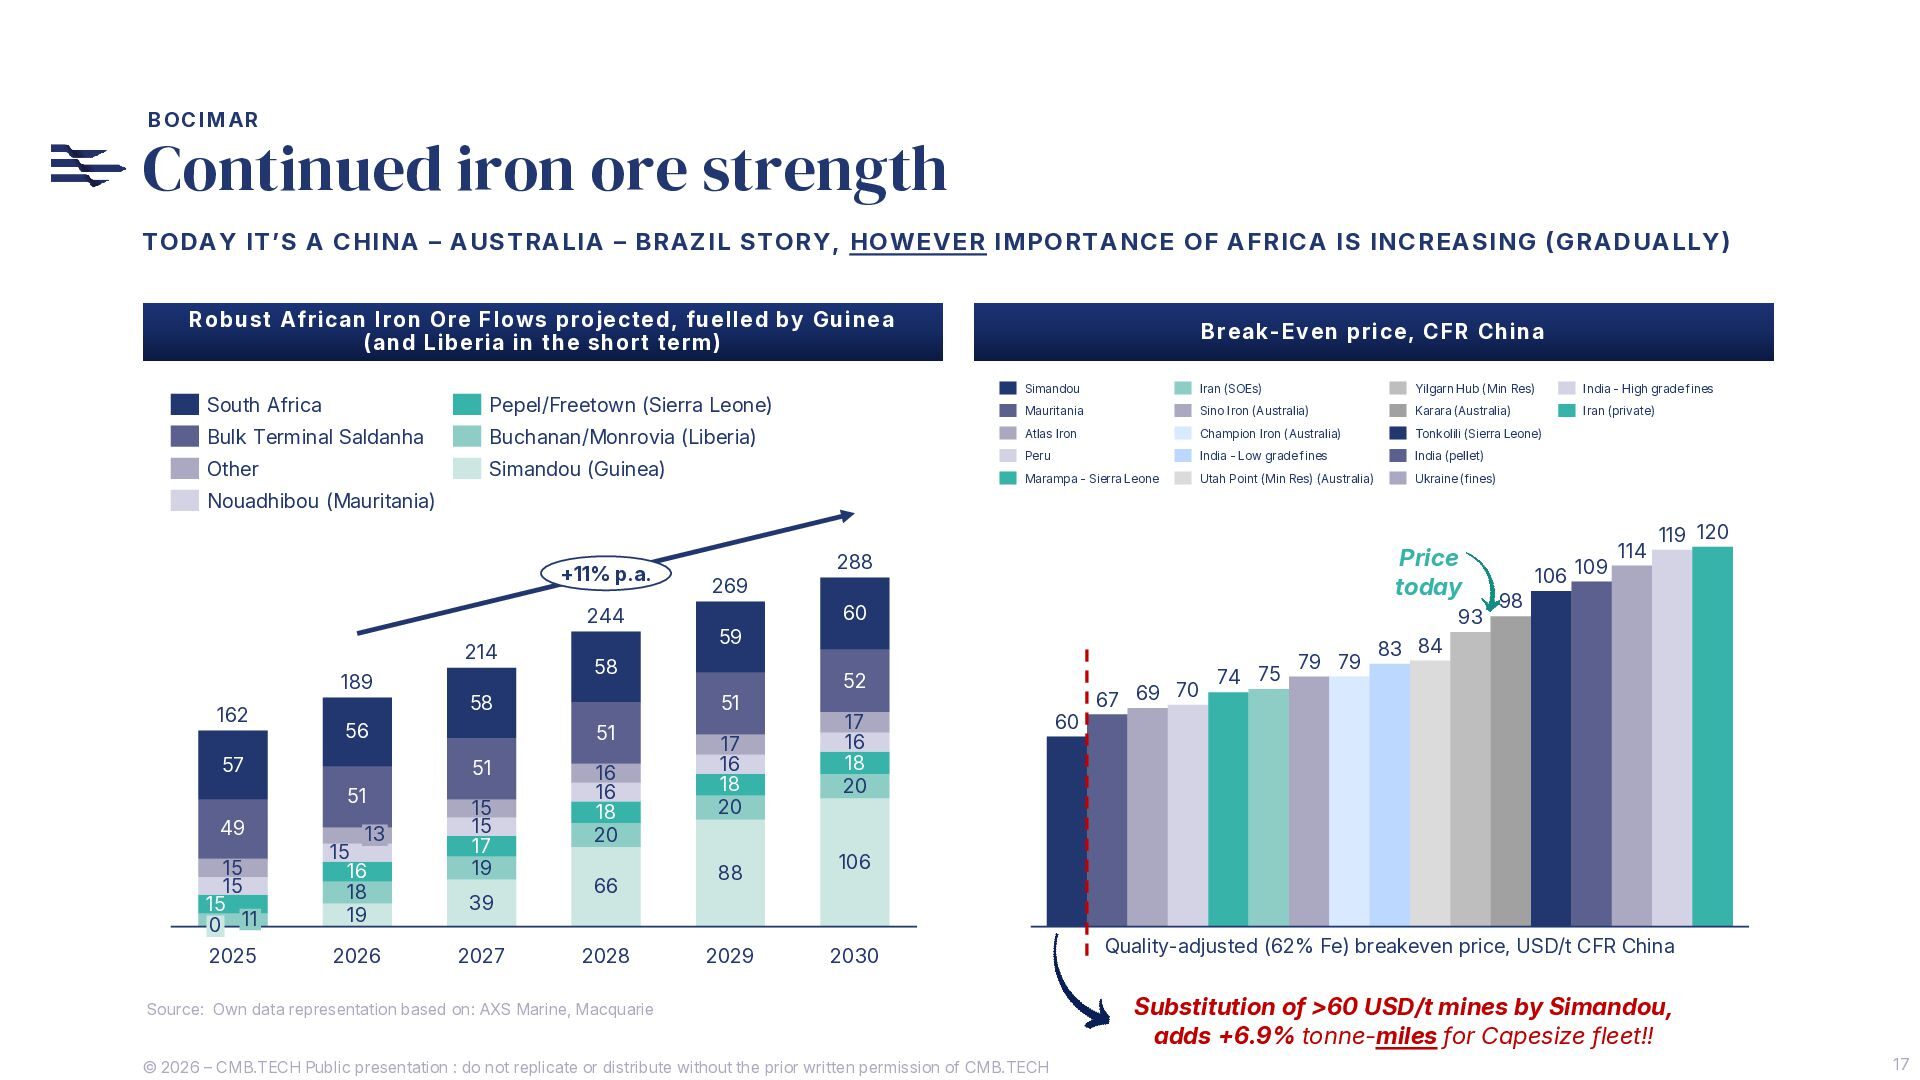
    AUSTRALIA – BRAZIL STORY, HOWEVER IMPORTANCE OF AFRICA IS INCREASING (GRADUALLY) Robust African Iron Ore Flows projected, fuelled by Guinea (and Liberia in the short term) South Africa Pepel/Freetown (Sierra Leone) Bulk Terminal Saldanha Buchanan/Monrovia (Liberia) Other Simandou (Guinea) Break-Even price, CFR China Simandou Iran (SOEs) Yilgarn Hub (Min Res) India - High grade fines Mauritania Sino Iron (Australia) Karara (Australia) Iran (private) Atlas Iron Champion Iron (Australia) Tonkolili (Sierra Leone) Peru India - Low grade fines India (pellet) Marampa - Sierra Leone Utah Point (Min Res) (Australia) Ukraine (fines) Nouadhibou (Mauritania) +11% p.a. 244 214 189 162 57 51 49 15 15 15 0 11 2025 13 15 16 18 19 2026 51 51 51 15 15 17 19 39 2027 59 58 58 56 269 16 16 18 20 66 2028 17 16 18 20 88 2029 Price today 288 60 93 52 17 16 18 20 60 67 69 70 74 75 79 79 106 109 114 119 120 98 83 84 106 2030 Source: Own data representation based on: AXS Marine, Macquarie © 2026 – CMB.TECH Public presentation : do not replicate or distribute without the prior written permission of CMB.TECH Quality-adjusted (62% Fe) breakeven price, USD/t CFR China Substitution of >60 USD/t mines by Simandou, adds +6.9% tonne-miles for Capesize fleet!! 17
  15. BOCIMAR Potential El Niño as sweetener for Panamax fleet GENERAL

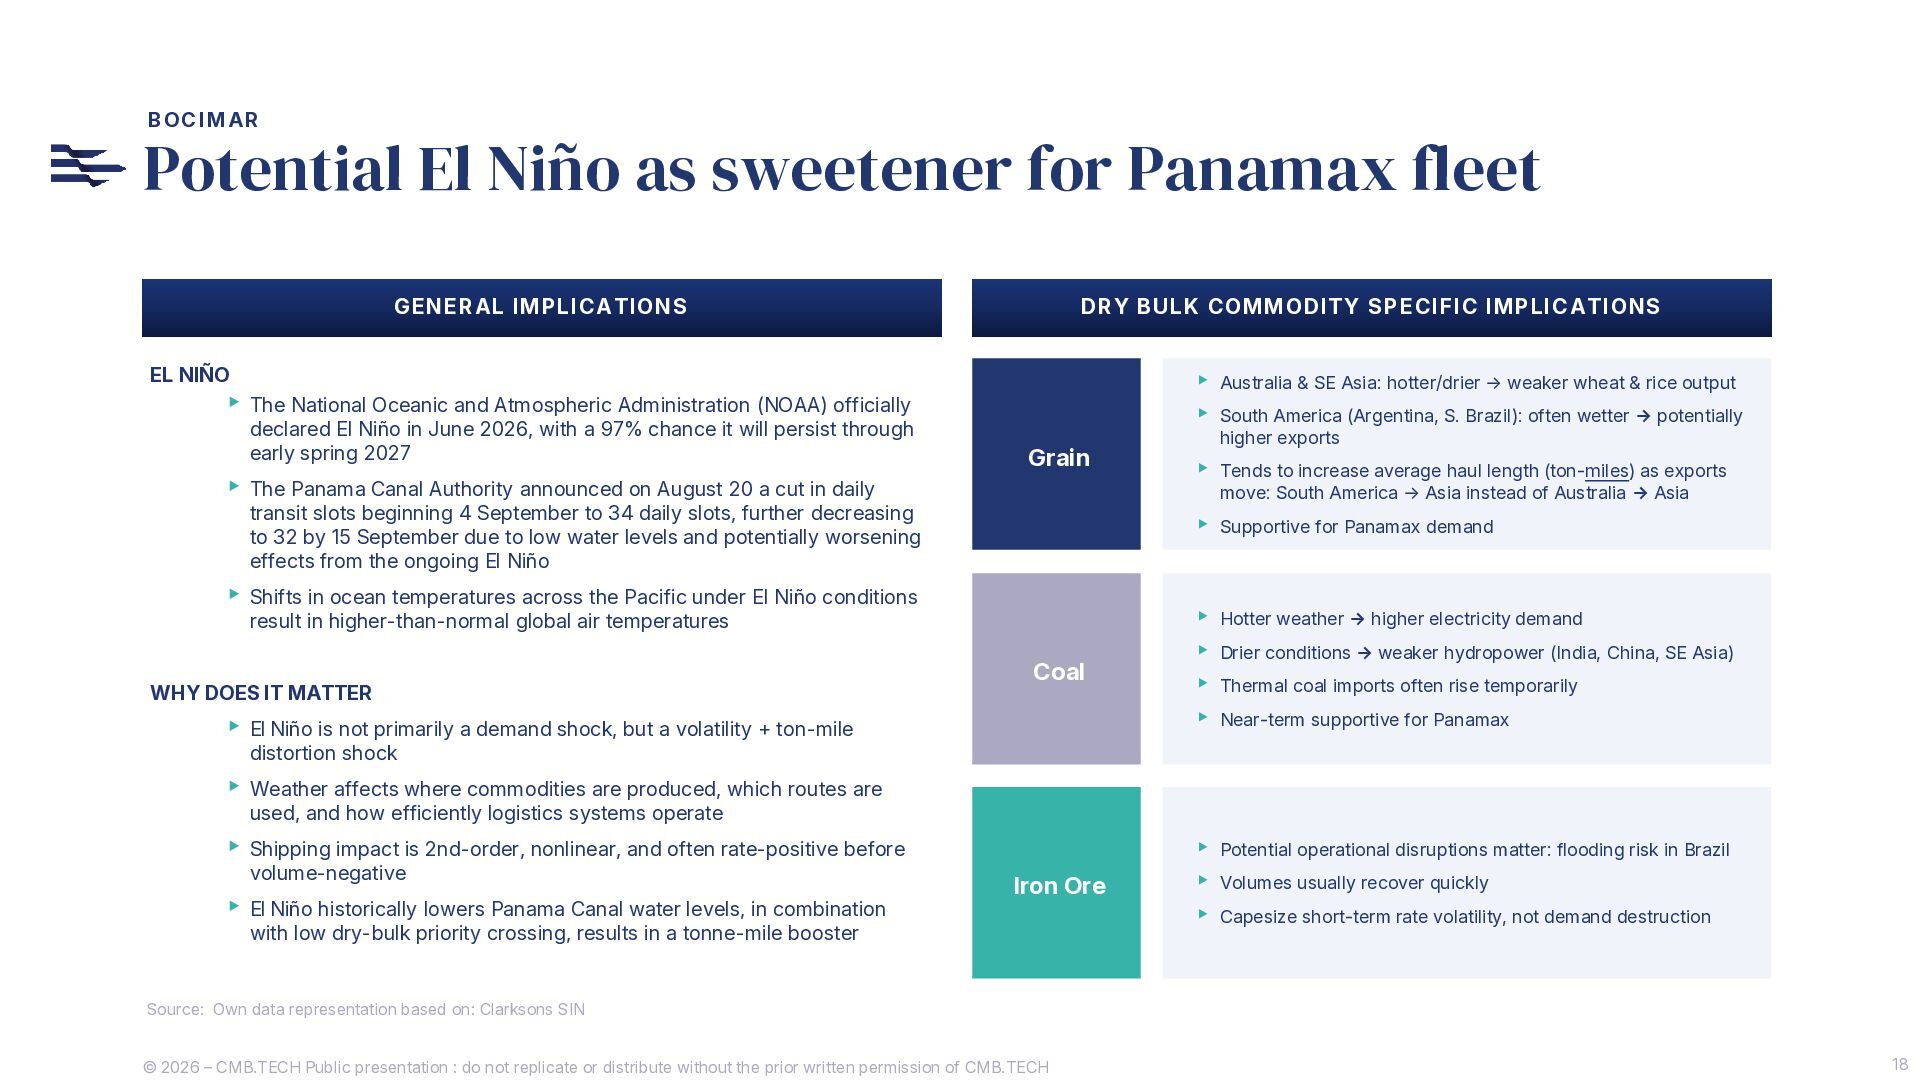
    IMPLICATIONS DRY BULK COMMODITY SPECIFIC IMPLICATIONS EL NIÑO ▸ Australia & SE Asia: hotter/drier → weaker wheat & rice output ▸ South America (Argentina, S. Brazil): often wetter → potentially ▸ The National Oceanic and Atmospheric Administration (NOAA) officially declared El Niño in June 2026, with a 97% chance it will persist through early spring 2027 Grain ▸ The Panama Canal Authority announced on August 20 a cut in daily ▸ Tends to increase average haul length (ton-miles) as exports move: South America → Asia instead of Australia → Asia transit slots beginning 4 September to 34 daily slots, further decreasing to 32 by 15 September due to low water levels and potentially worsening effects from the ongoing El Niño ▸ Supportive for Panamax demand ▸ Shifts in ocean temperatures across the Pacific under El Niño conditions Coal ▸ Hotter weather → higher electricity demand ▸ Drier conditions → weaker hydropower (India, China, SE Asia) ▸ Thermal coal imports often rise temporarily ▸ Near-term supportive for Panamax Iron Ore ▸ Potential operational disruptions matter: flooding risk in Brazil ▸ Volumes usually recover quickly ▸ Capesize short-term rate volatility, not demand destruction result in higher-than-normal global air temperatures WHY DOES IT MATTER higher exports ▸ El Niño is not primarily a demand shock, but a volatility + ton-mile distortion shock ▸ Weather affects where commodities are produced, which routes are used, and how efficiently logistics systems operate ▸ Shipping impact is 2nd-order, nonlinear, and often rate-positive before volume-negative ▸ El Niño historically lowers Panama Canal water levels, in combination with low dry-bulk priority crossing, results in a tonne-mile booster Source: Own data representation based on: Clarksons SIN © 2026 – CMB.TECH Public presentation : do not replicate or distribute without the prior written permission of CMB.TECH 18
  16. BOCIMAR El Niño (2023/2024) Panamax earnings (USD/day) USD/day Total Bulkcarrier

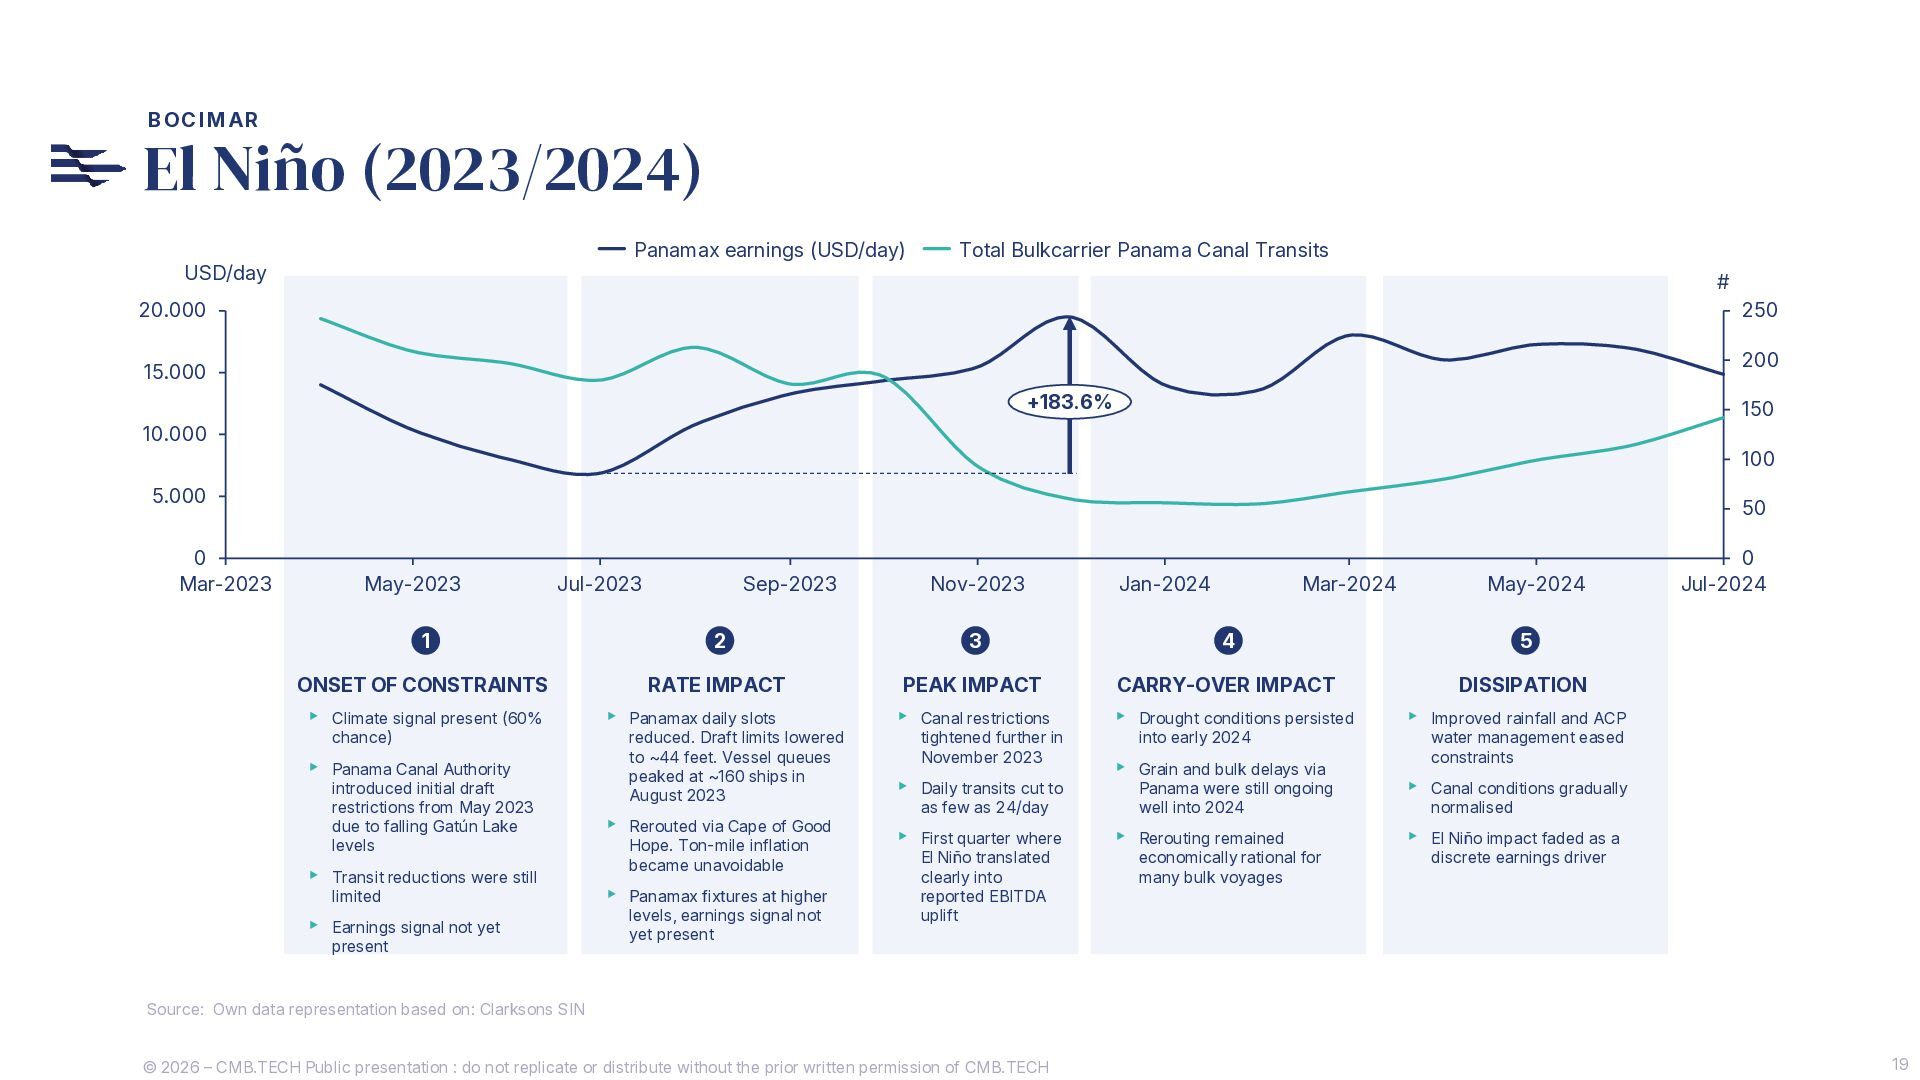
    Panama Canal Transits # 20.000 250 200 15.000 +183.6% 150 10.000 100 5.000 0 Mar-2023 50 May-2023 Jul-2023 Sep-2023 Nov-2023 Jan-2024 Mar-2024 May-2024 1 2 3 4 5 ONSET OF CONSTRAINTS RATE IMPACT PEAK IMPACT CARRY-OVER IMPACT DISSIPATION ▸ Climate signal present (60% ▸ Panamax daily slots ▸ Canal restrictions ▸ Drought conditions persisted ▸ Improved rainfall and ACP chance) ▸ Panama Canal Authority introduced initial draft restrictions from May 2023 due to falling Gatún Lake levels ▸ Transit reductions were still limited ▸ Earnings signal not yet present reduced. Draft limits lowered to ~44 feet. Vessel queues peaked at ~160 ships in August 2023 ▸ Rerouted via Cape of Good Hope. Ton-mile inflation became unavoidable ▸ Panamax fixtures at higher levels, earnings signal not yet present tightened further in November 2023 ▸ Daily transits cut to as few as 24/day ▸ First quarter where El Niño translated clearly into reported EBITDA uplift into early 2024 ▸ Grain and bulk delays via Panama were still ongoing well into 2024 ▸ Rerouting remained economically rational for many bulk voyages 0 Jul-2024 water management eased constraints ▸ Canal conditions gradually normalised ▸ El Niño impact faded as a discrete earnings driver Source: Own data representation based on: Clarksons SIN © 2026 – CMB.TECH Public presentation : do not replicate or distribute without the prior written permission of CMB.TECH 19
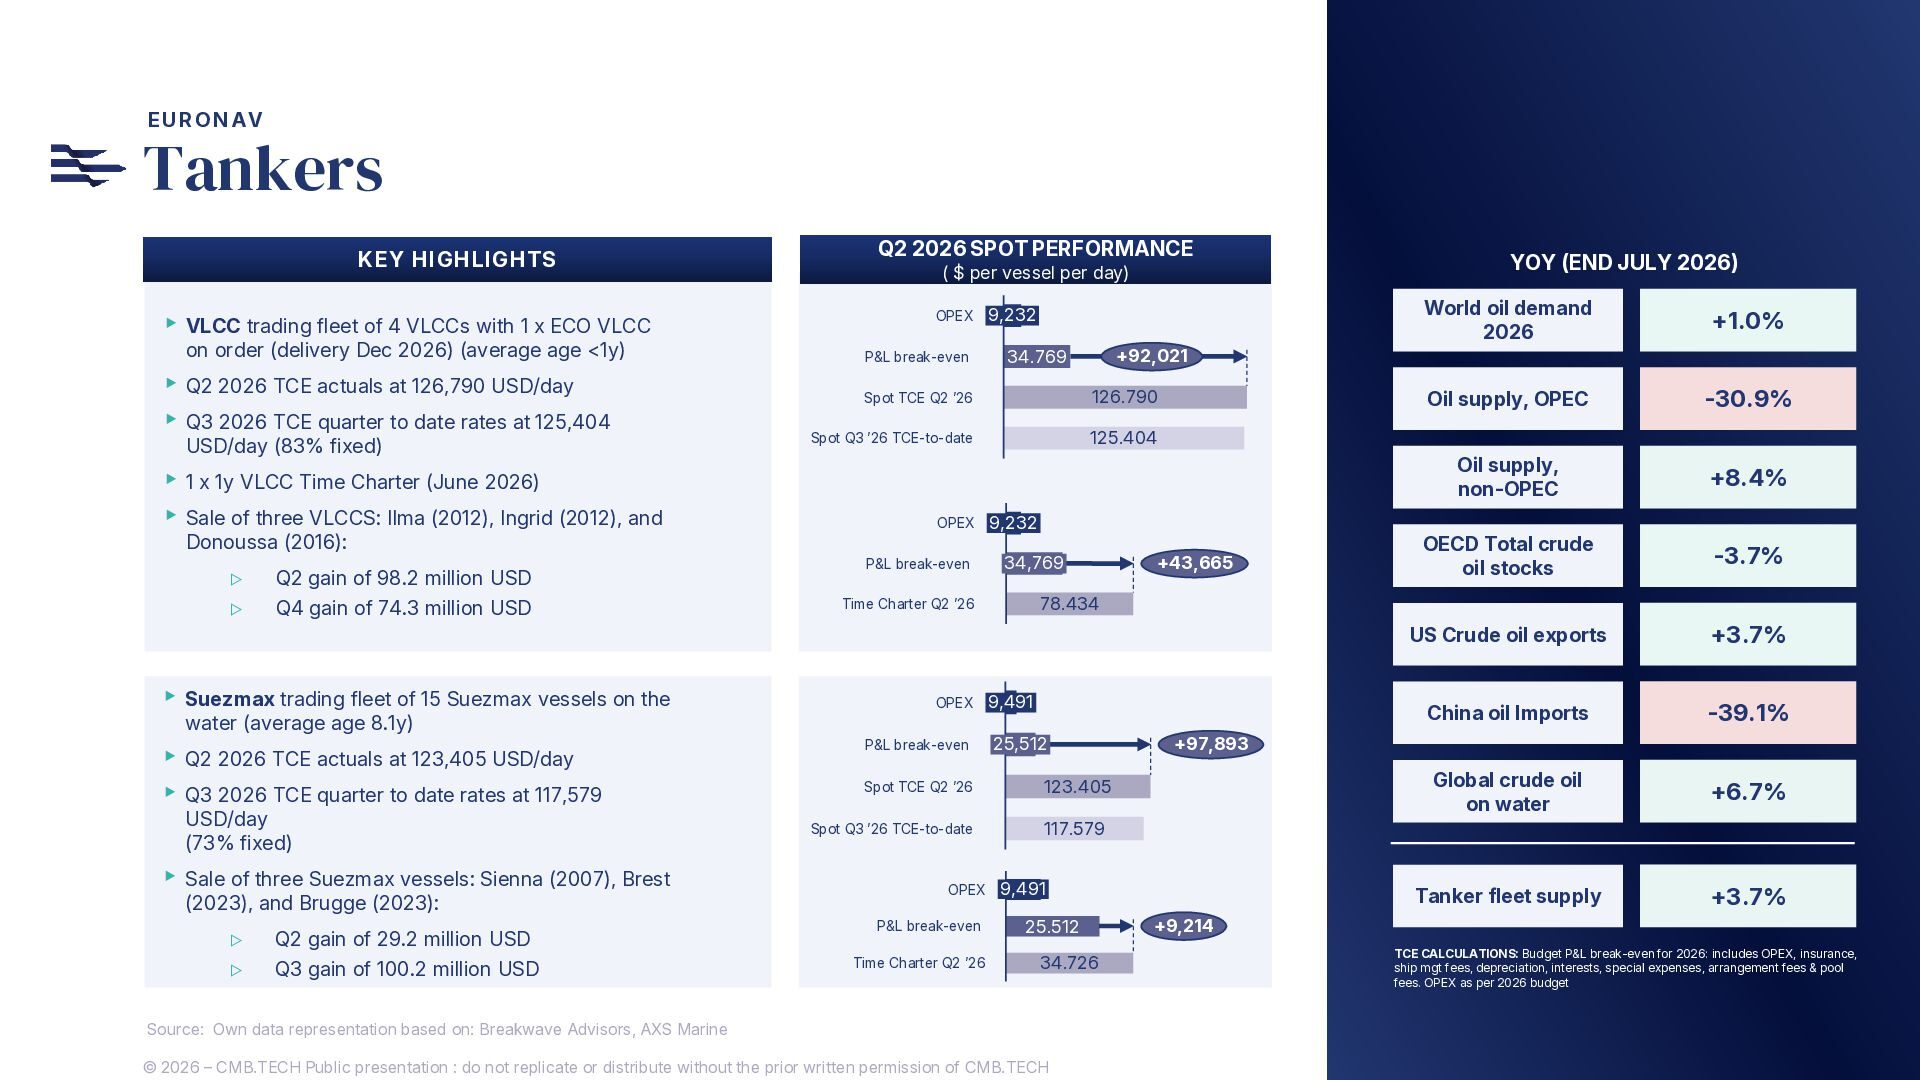
  17. EURONAV Tankers KEY HIGHLIGHTS ▸ VLCC trading fleet of 4

    VLCCs with 1 x ECO VLCC on order (delivery Dec 2026) (average age <1y) ▸ Q2 2026 TCE actuals at 126,790 USD/day ▸ Q3 2026 TCE quarter to date rates at 125,404 USD/day (83% fixed) ▸ 1 x 1y VLCC Time Charter (June 2026) ▸ Sale of three VLCCS: Ilma (2012), Ingrid (2012), and Donoussa (2016): ▷ Q2 gain of 98.2 million USD ▷ Q4 gain of 74.3 million USD ▸ Suezmax trading fleet of 15 Suezmax vessels on the water (average age 8.1y) ▸ Q2 2026 TCE actuals at 123,405 USD/day ▸ Q3 2026 TCE quarter to date rates at 117,579 USD/day (73% fixed) ▸ Sale of three Suezmax vessels: Sienna (2007), Brest (2023), and Brugge (2023): ▷ Q2 gain of 29.2 million USD ▷ Q3 gain of 100.2 million USD Q2 2026 SPOT PERFORMANCE ( $ per vessel per day) OPEX P&L break-even 9,232 126.790 Spot Q3 ’26 TCE-to-date 125.404 P&L break-even 9,232 34,769 P&L break-even 25,512 123.405 Spot Q3 ’26 TCE-to-date 117.579 P&L break-even Time Charter Q2 ’26 +43,665 9,491 Spot TCE Q2 ’26 OPEX +1.0% Oil supply, OPEC -30.9% Oil supply, non-OPEC +8.4% OECD Total crude oil stocks -3.7% US Crude oil exports +3.7% China oil Imports -39.1% Global crude oil on water +6.7% Tanker fleet supply +3.7% 78.434 Time Charter Q2 ’26 OPEX World oil demand 2026 +92,021 34.769 Spot TCE Q2 ’26 OPEX YOY (END JULY 2026) +97,893 9,491 25.512 34.726 +9,214 TCE CALCULATIONS: Budget P&L break-even for 2026: includes OPEX, insurance, ship mgt fees, depreciation, interests, special expenses, arrangement fees & pool fees. OPEX as per 2026 budget Source: Own data representation based on: Breakwave Advisors, AXS Marine © 2026 – CMB.TECH Public presentation : do not replicate or distribute without the prior written permission of CMB.TECH 2121
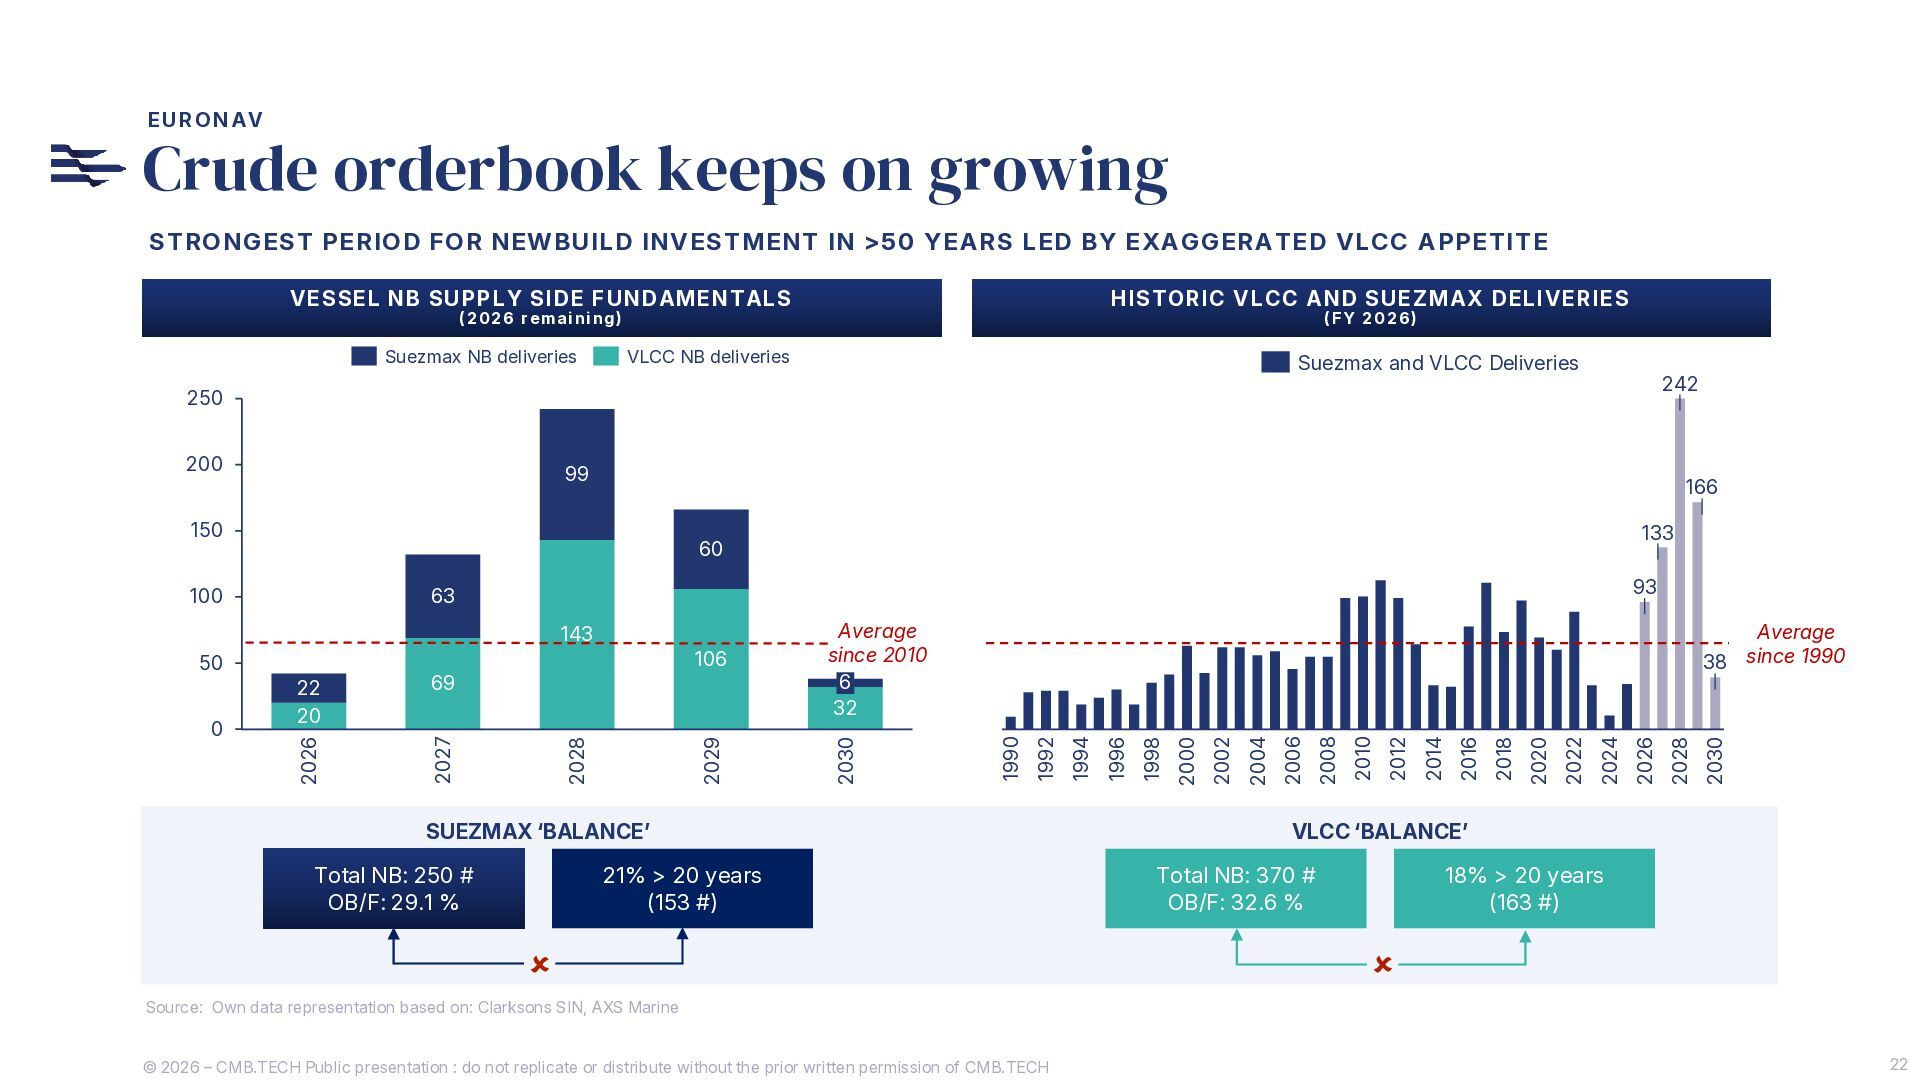
  18. EURONAV Crude orderbook keeps on growing STRONGEST PERIOD FOR NEWBUILD

    INVESTMENT IN >50 YEARS LED BY EXAGGERATED VLCC APPETITE VESSEL NB SUPPLY SIDE FUNDAMENTALS HISTORIC VLCC AND SUEZMAX DELIVERIES (2026 remaining) Suezmax NB deliveries (FY 2026) VLCC NB deliveries Suezmax and VLCC Deliveries 242 250 200 99 166 150 93 63 SUEZMAX ‘BALANCE’ Total NB: 250 # OB/F: 29.1 % 21% > 20 years (153 #)  2030 2028 2026 2024 2022 2020 2018 2016 2014 2012 2010 2008 2006 2004 2002 2000 1998 1996 1994 2028 2029 69 2027 2026 22 20 Average since 1990 38 1992 106 50 Average since 2010 6 32 1990 143 2030 100 0 133 60 VLCC ‘BALANCE’ Total NB: 370 # OB/F: 32.6 % 18% > 20 years (163 #)  Source: Own data representation based on: Clarksons SIN, AXS Marine © 2026 – CMB.TECH Public presentation : do not replicate or distribute without the prior written permission of CMB.TECH 22
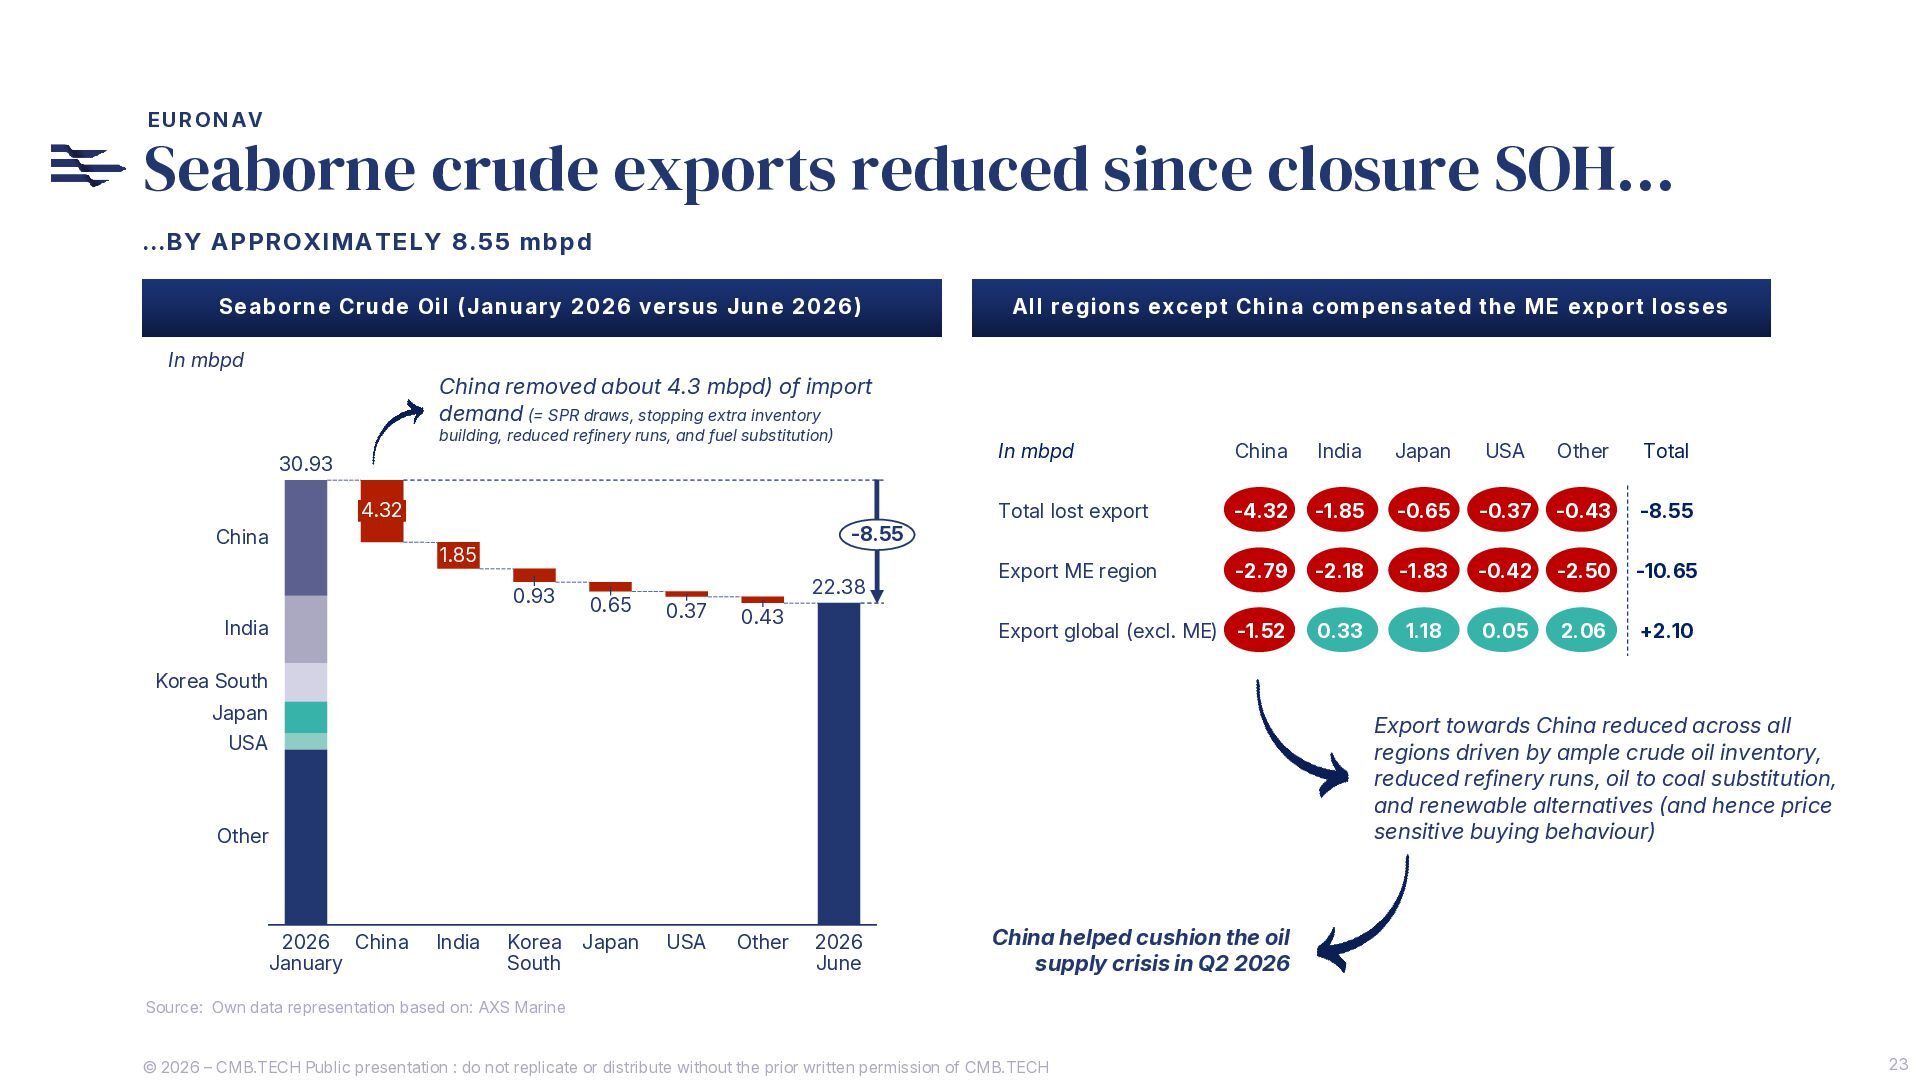
  19. EURONAV Seaborne crude exports reduced since closure SOH… …BY APPROXIMATELY

    8.55 mbpd Seaborne Crude Oil (January 2026 versus June 2026) All regions except China compensated the ME export losses In mbpd China removed about 4.3 mbpd) of import demand (= SPR draws, stopping extra inventory building, reduced refinery runs, and fuel substitution) 30.93 4.32 China -8.55 1.85 0.93 India 0.65 0.37 22.38 0.43 In mbpd China India Japan USA Other Total Total lost export -4.32 -1.85 -0.65 -0.37 -0.43 -8.55 Export ME region -2.79 -2.18 -1.83 -0.42 -2.50 -10.65 Export global (excl. ME) -1.52 0.33 1.18 0.05 2.06 +2.10 Korea South Japan USA Export towards China reduced across all regions driven by ample crude oil inventory, reduced refinery runs, oil to coal substitution, and renewable alternatives (and hence price sensitive buying behaviour) Other 2026 China January India Korea South Japan USA Other 2026 June China helped cushion the oil supply crisis in Q2 2026 Source: Own data representation based on: AXS Marine © 2026 – CMB.TECH Public presentation : do not replicate or distribute without the prior written permission of CMB.TECH 23
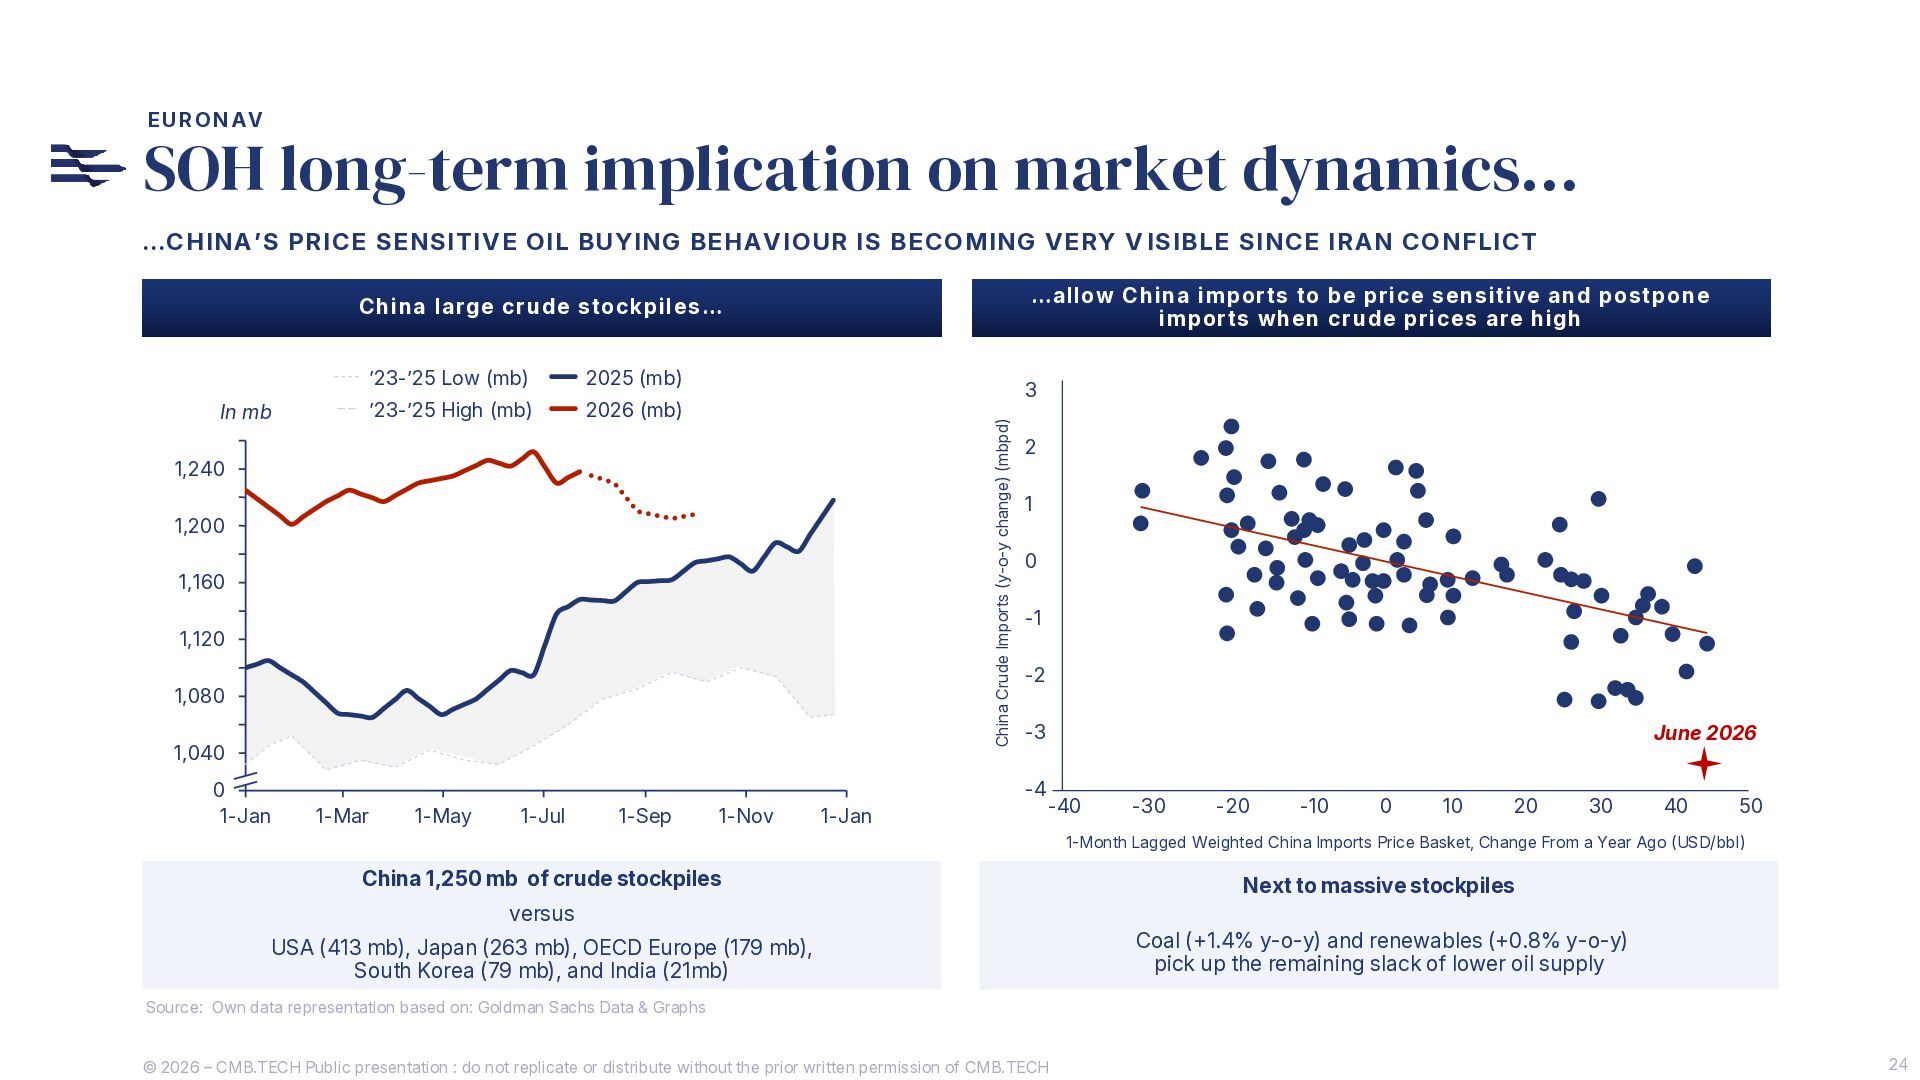
  20. EURONAV SOH long-term implication on market dynamics… …CHINA’S PRICE SENSITIVE

    OIL BUYING BEHAVIOUR IS BECOMING VERY V ISIBLE SINCE IRAN CONFLICT …allow China imports to be price sensitive and postpone imports when crude prices are high China large crude stockpiles… 2025 (mb) ’23-’25 High (mb) 2026 (mb) 3 China Crude Imports (y-o-y change) (mbpd) In mb ’23-’25 Low (mb) 1,240 1,200 1,160 1,120 1,080 1,040 0 1-Jan 2 1 0 -1 -2 -3 -4 1-Mar 1-May 1-Jul 1-Sep 1-Nov 1-Jan June 2026 -40 -30 -20 -10 0 10 20 30 40 50 1-Month Lagged Weighted China Imports Price Basket, Change From a Year Ago (USD/bbl) China 1,250 mb of crude stockpiles Next to massive stockpiles versus USA (413 mb), Japan (263 mb), OECD Europe (179 mb), South Korea (79 mb), and India (21mb) Coal (+1.4% y-o-y) and renewables (+0.8% y-o-y) pick up the remaining slack of lower oil supply Source: Own data representation based on: Goldman Sachs Data & Graphs © 2026 – CMB.TECH Public presentation : do not replicate or distribute without the prior written permission of CMB.TECH 24
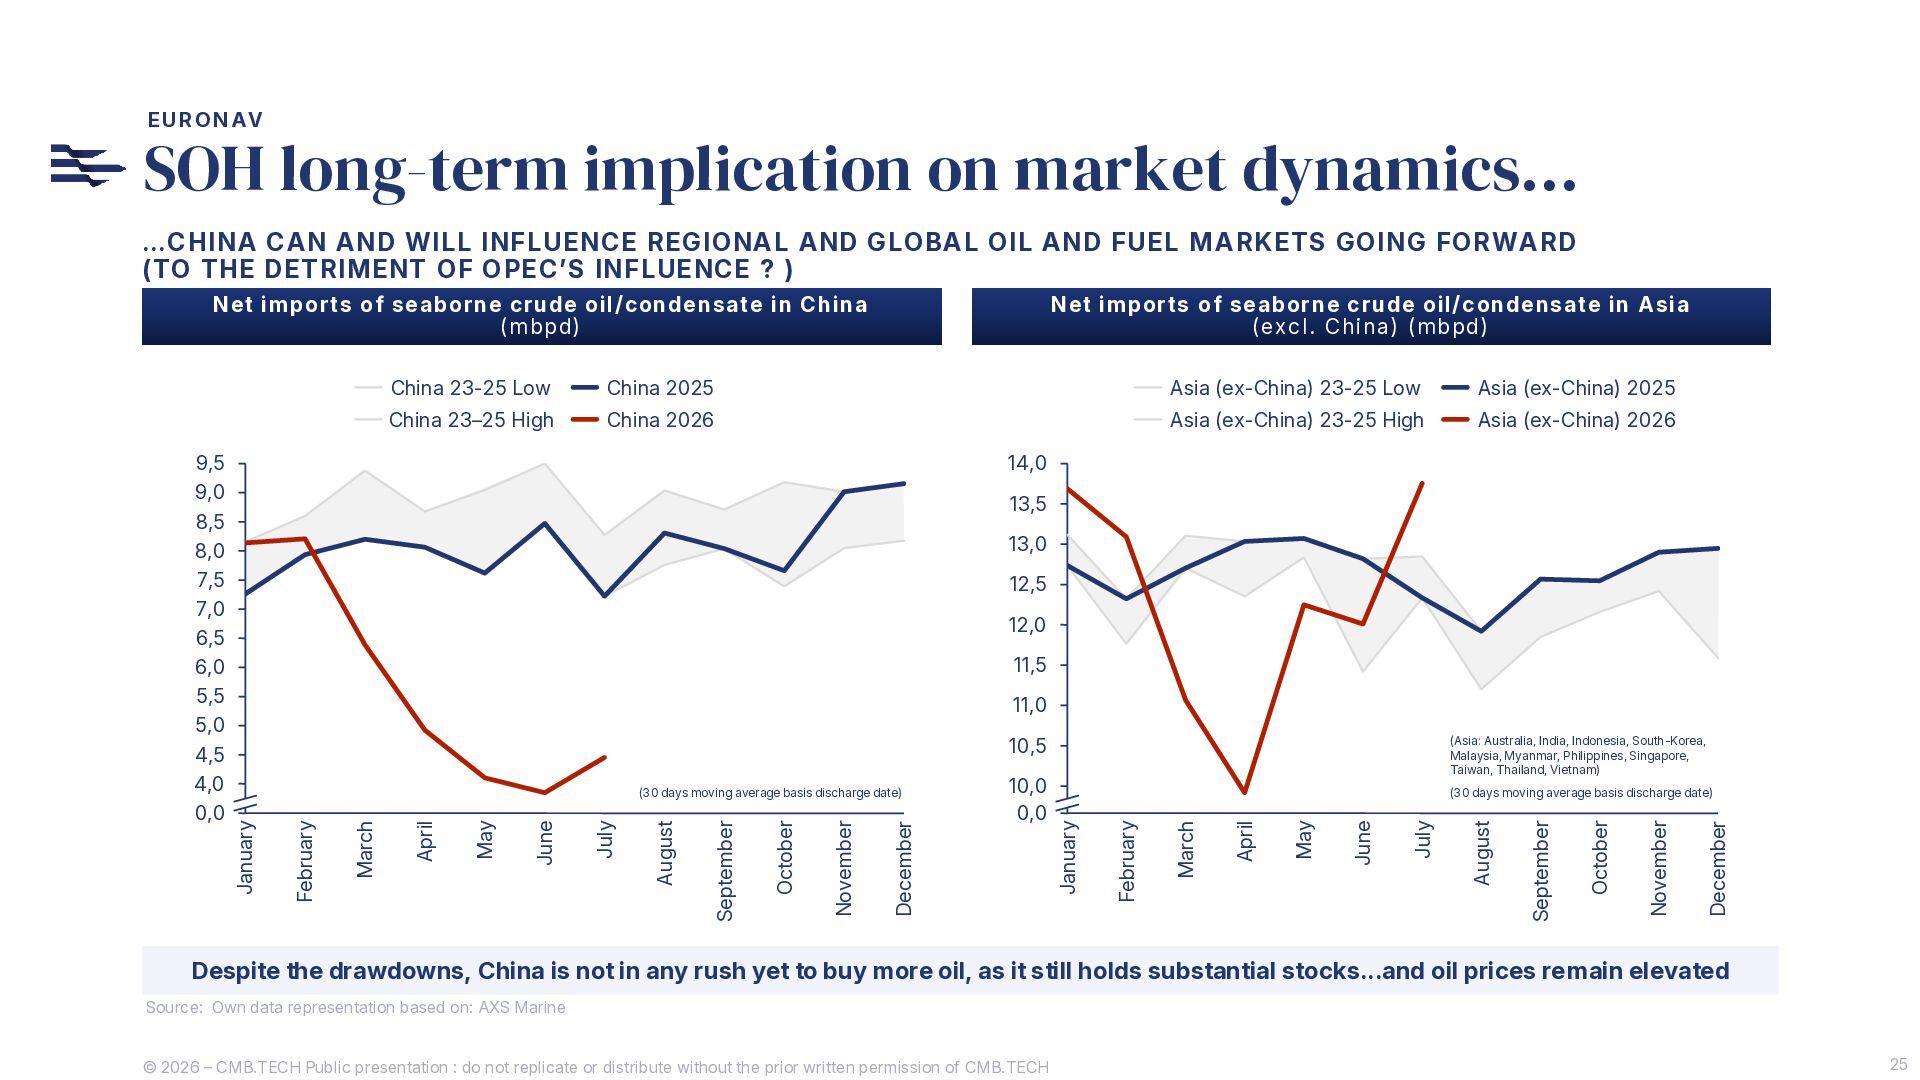
  21. EURONAV SOH long-term implication on market dynamics… …CHINA CAN AND

    WILL INFLUENCE REGIONAL AND GLOBAL OIL AND FUEL M ARKETS GOING FORWARD (TO THE DETRIMENT OF OPEC’S INFLUENCE ? ) Net imports of seaborne crude oil/condensate in China (mbpd) China 23-25 Low China 2025 Asia (ex-China) 23-25 Low Asia (ex-China) 2025 China 23–25 High China 2026 Asia (ex-China) 23-25 High Asia (ex-China) 2026 14,0 13,5 13,0 12,5 12,0 11,5 11,0 10,5 December November October September August July June May April March (30 days moving average basis discharge date) February 10,0 0,0 (Asia: Australia, India, Indonesia, South-Korea, Malaysia, Myanmar, Philippines, Singapore, Taiwan, Thailand, Vietnam) January December November October September August July June May April March February (30 days moving average basis discharge date) January 9,5 9,0 8,5 8,0 7,5 7,0 6,5 6,0 5,5 5,0 4,5 4,0 0,0 Net imports of seaborne crude oil/condensate in Asia (excl. China) (mbpd) Despite the drawdowns, China is not in any rush yet to buy more oil, as it still holds substantial stocks...and oil prices remain elevated Source: Own data representation based on: AXS Marine © 2026 – CMB.TECH Public presentation : do not replicate or distribute without the prior written permission of CMB.TECH 25
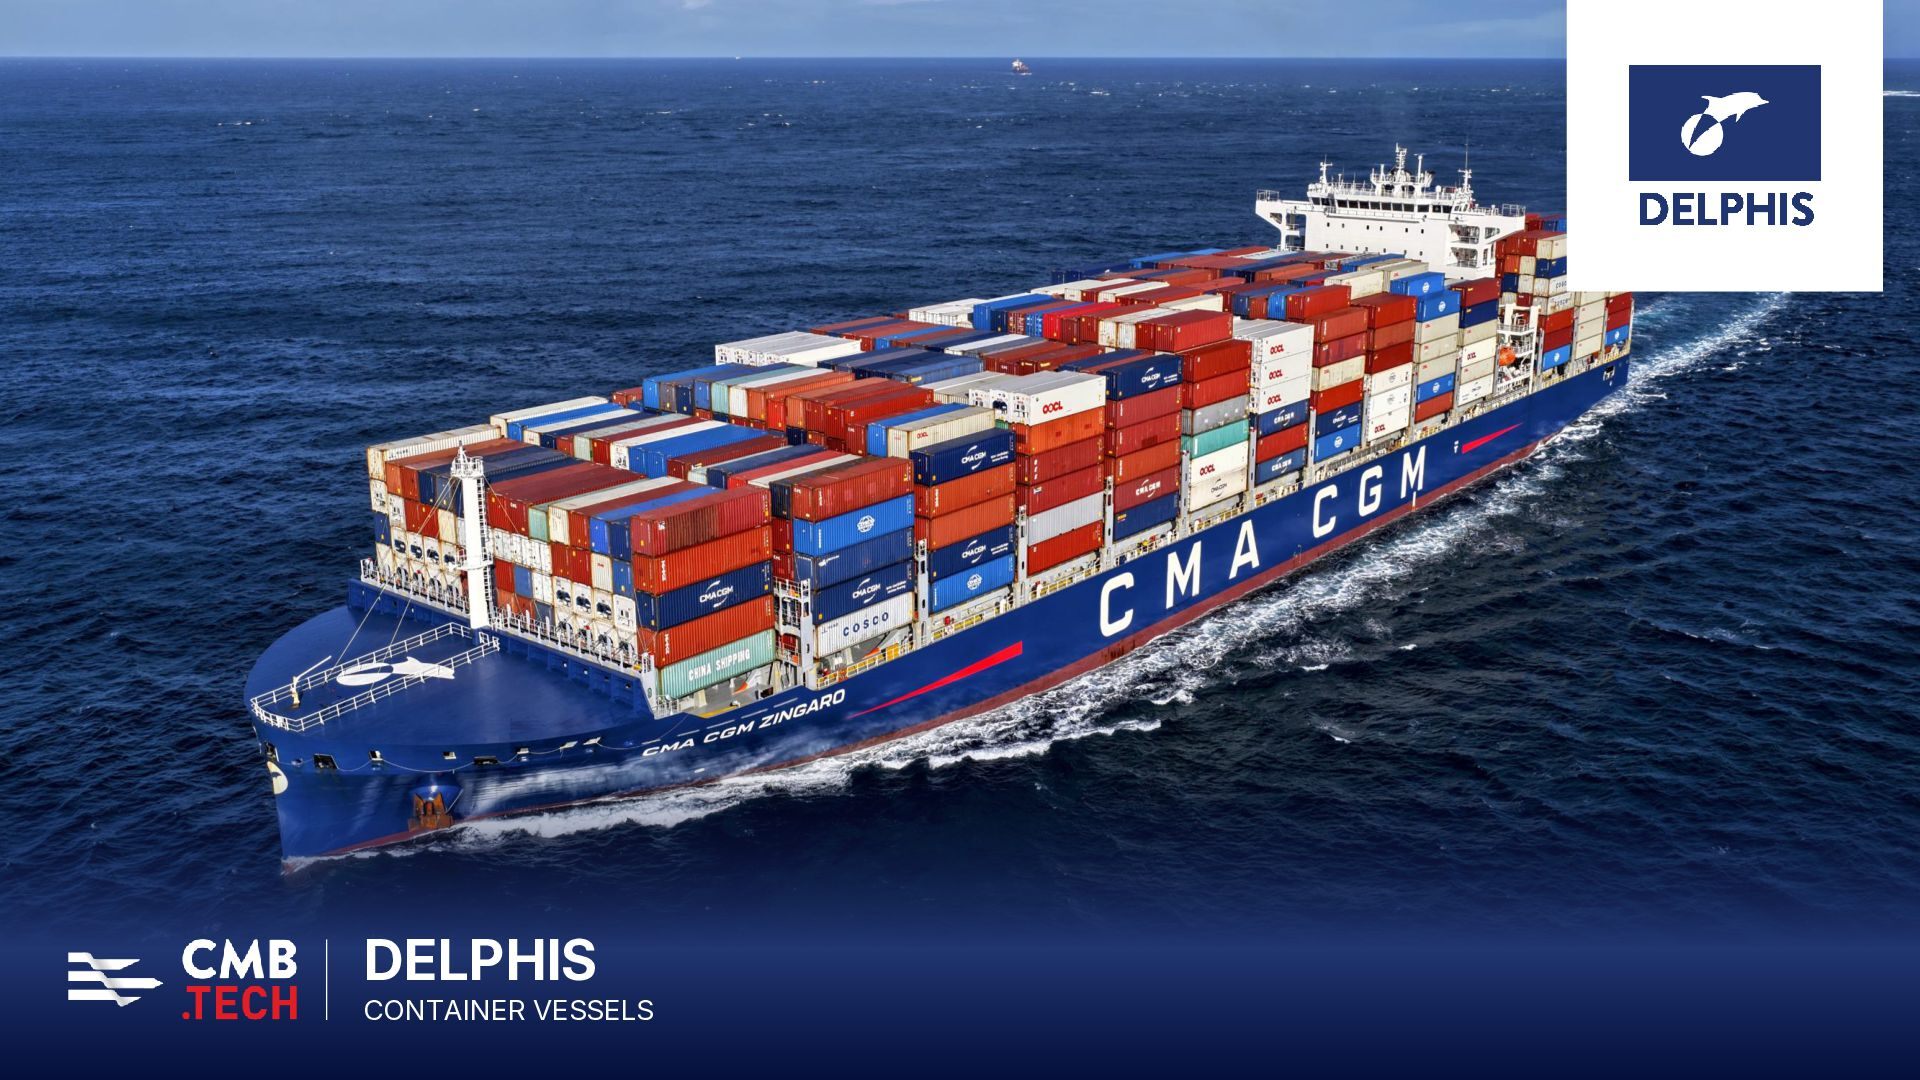
  22. DELPHIS CONTAINER VESSELS © 2026 – CMB.TECH Public presentation :

    do not replicate or distribute without the prior written permission of CMB.TECH 26
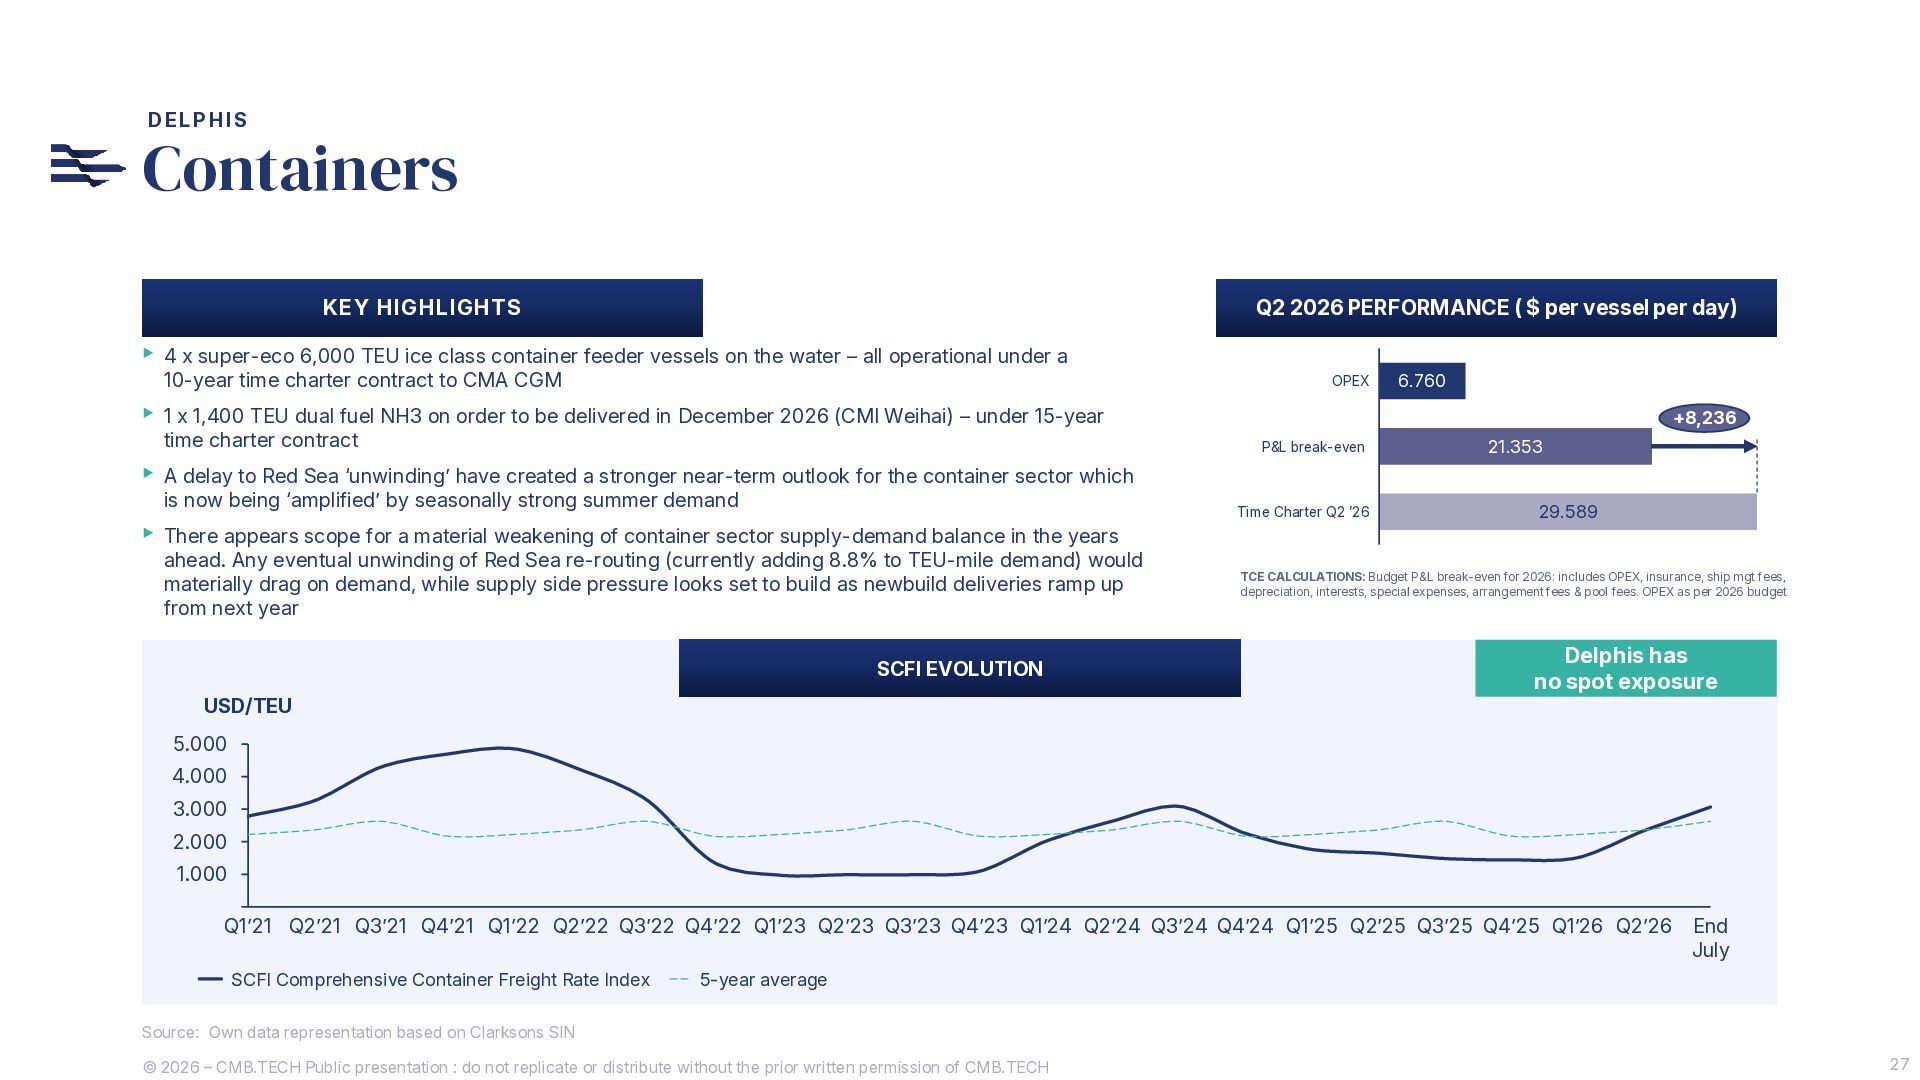
  23. DELPHIS Containers KEY HIGHLIGHTS Q2 2026 PERFORMANCE ( $ per

    vessel per day) ▸ 4 x super-eco 6,000 TEU ice class container feeder vessels on the water – all operational under a 10-year time charter contract to CMA CGM OPEX 6.760 ▸ 1 x 1,400 TEU dual fuel NH3 on order to be delivered in December 2026 (CMI Weihai) – under 15-year time charter contract +8,236 P&L break-even 21.353 ▸ A delay to Red Sea ‘unwinding’ have created a stronger near-term outlook for the container sector which is now being ‘amplified’ by seasonally strong summer demand ▸ There appears scope for a material weakening of container sector supply-demand balance in the years ahead. Any eventual unwinding of Red Sea re-routing (currently adding 8.8% to TEU-mile demand) would materially drag on demand, while supply side pressure looks set to build as newbuild deliveries ramp up from next year SCFI EVOLUTION USD/TEU Time Charter Q2 ’26 29.589 TCE CALCULATIONS: Budget P&L break-even for 2026: includes OPEX, insurance, ship mgt fees, depreciation, interests, special expenses, arrangement fees & pool fees. OPEX as per 2026 budget Delphis has no spot exposure 5.000 4.000 3.000 2.000 1.000 Q1’21 Q2’21 Q3’21 Q4’21 Q1’22 Q2’22 Q3’22 Q4’22 Q1’23 Q2’23 Q3’23 Q4’23 Q1’24 Q2’24 Q3’24 Q4’24 Q1’25 Q2’25 Q3’25 Q4’25 Q1’26 Q2’26 SCFI Comprehensive Container Freight Rate Index End July 5-year average Source: Own data representation based on Clarksons SIN © 2026 – CMB.TECH Public presentation : do not replicate or distribute without the prior written permission of CMB.TECH 27
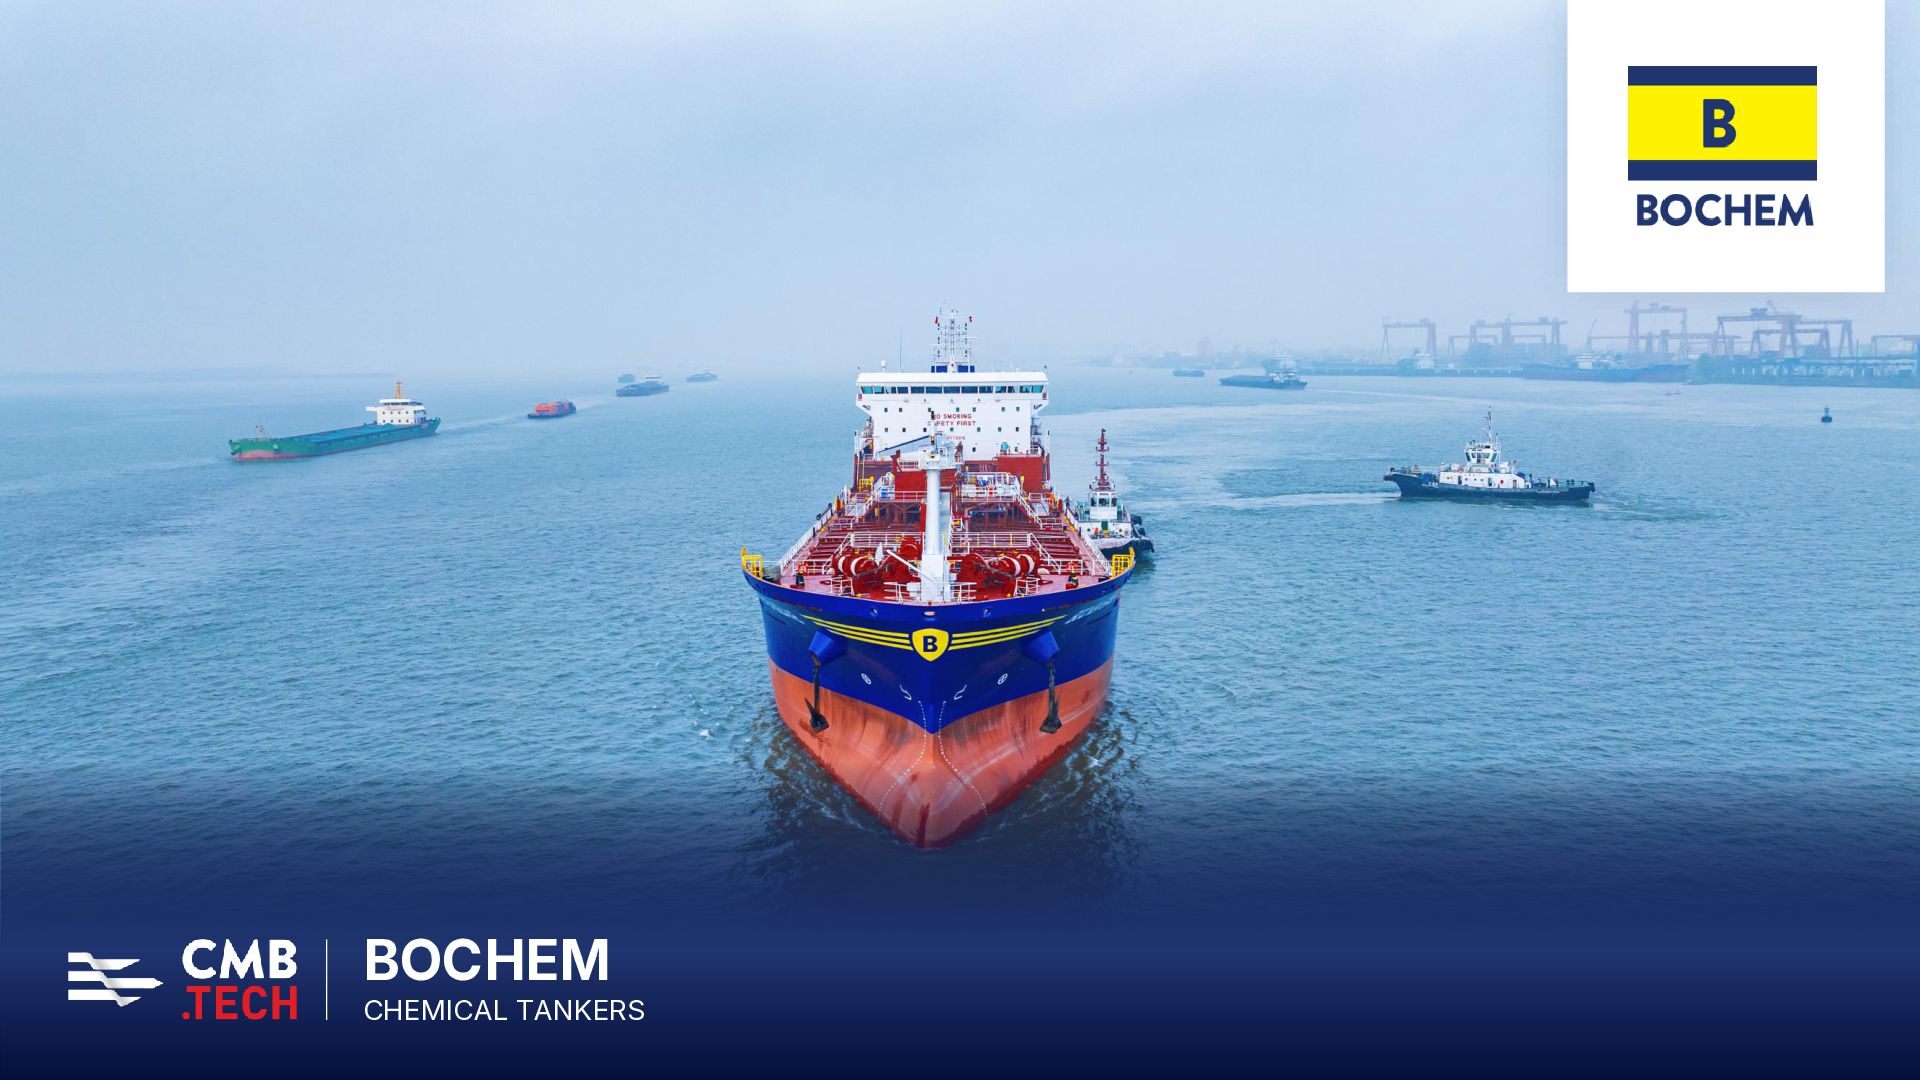
  24. BOCHEM CHEMICAL TANKERS © 2026 – CMB.TECH Public presentation :

    do not replicate or distribute without the prior written permission of CMB.TECH 28
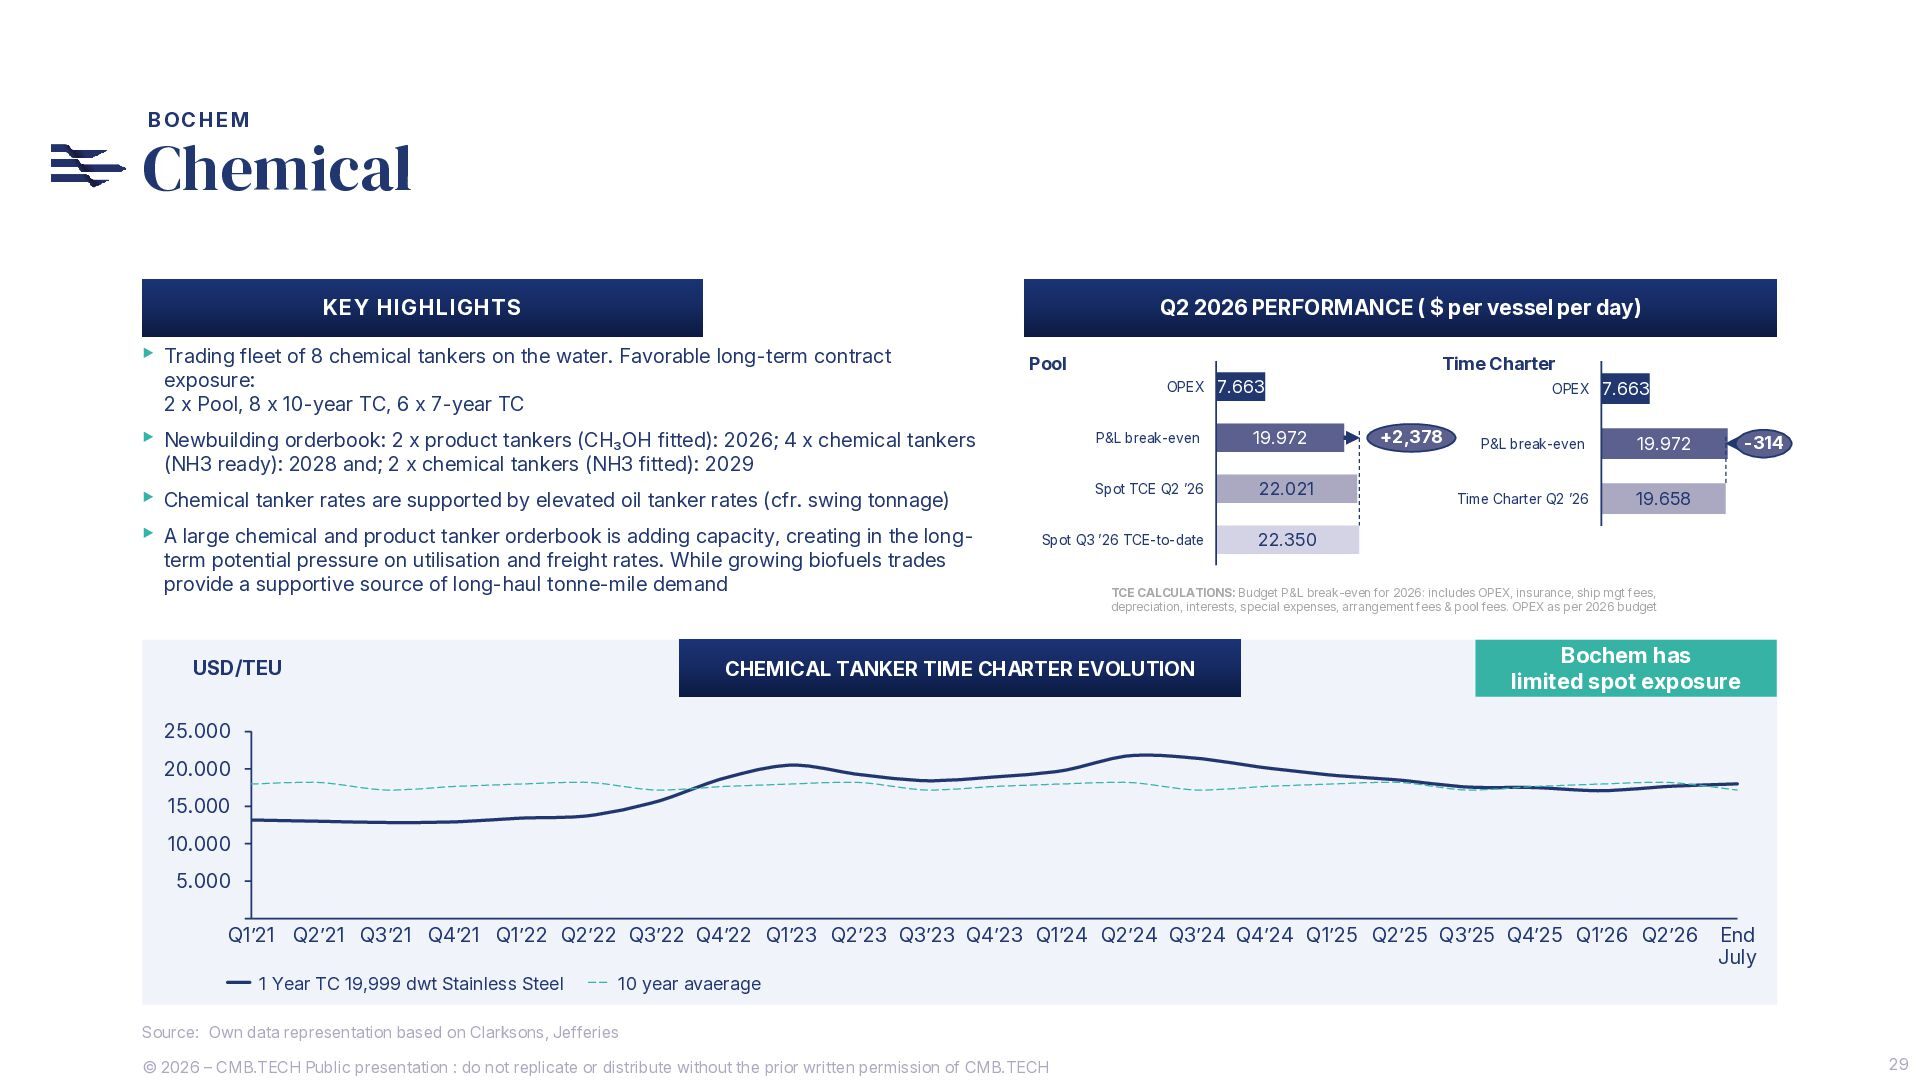
  25. BOCHEM Chemical KEY HIGHLIGHTS Q2 2026 PERFORMANCE ( $ per

    vessel per day) ▸ Trading fleet of 8 chemical tankers on the water. Favorable long-term contract exposure: 2 x Pool, 8 x 10-year TC, 6 x 7-year TC Pool Time Charter OPEX 7.663 ▸ Newbuilding orderbook: 2 x product tankers (CH₃OH fitted): 2026; 4 x chemical tankers P&L break-even 19.972 ▸ Chemical tanker rates are supported by elevated oil tanker rates (cfr. swing tonnage) ▸ A large chemical and product tanker orderbook is adding capacity, creating in the long- Spot TCE Q2 ’26 22.021 Spot Q3 ’26 TCE-to-date 22.350 (NH3 ready): 2028 and; 2 x chemical tankers (NH3 fitted): 2029 term potential pressure on utilisation and freight rates. While growing biofuels trades provide a supportive source of long-haul tonne-mile demand USD/TEU OPEX +2,378 7.663 P&L break-even 19.972 Time Charter Q2 ’26 19.658 -314 TCE CALCULATIONS: Budget P&L break-even for 2026: includes OPEX, insurance, ship mgt fees, depreciation, interests, special expenses, arrangement fees & pool fees. OPEX as per 2026 budget CHEMICAL TANKER TIME CHARTER EVOLUTION Bochem has limited spot exposure 25.000 20.000 15.000 10.000 5.000 Q1’21 Q2’21 Q3’21 Q4’21 Q1’22 Q2’22 Q3’22 Q4’22 Q1’23 Q2’23 Q3’23 Q4’23 Q1’24 Q2’24 Q3’24 Q4’24 Q1’25 Q2’25 Q3’25 Q4’25 Q1’26 Q2’26 1 Year TC 19,999 dwt Stainless Steel End July 10 year avaerage Source: Own data representation based on Clarksons, Jefferies © 2026 – CMB.TECH Public presentation : do not replicate or distribute without the prior written permission of CMB.TECH 29
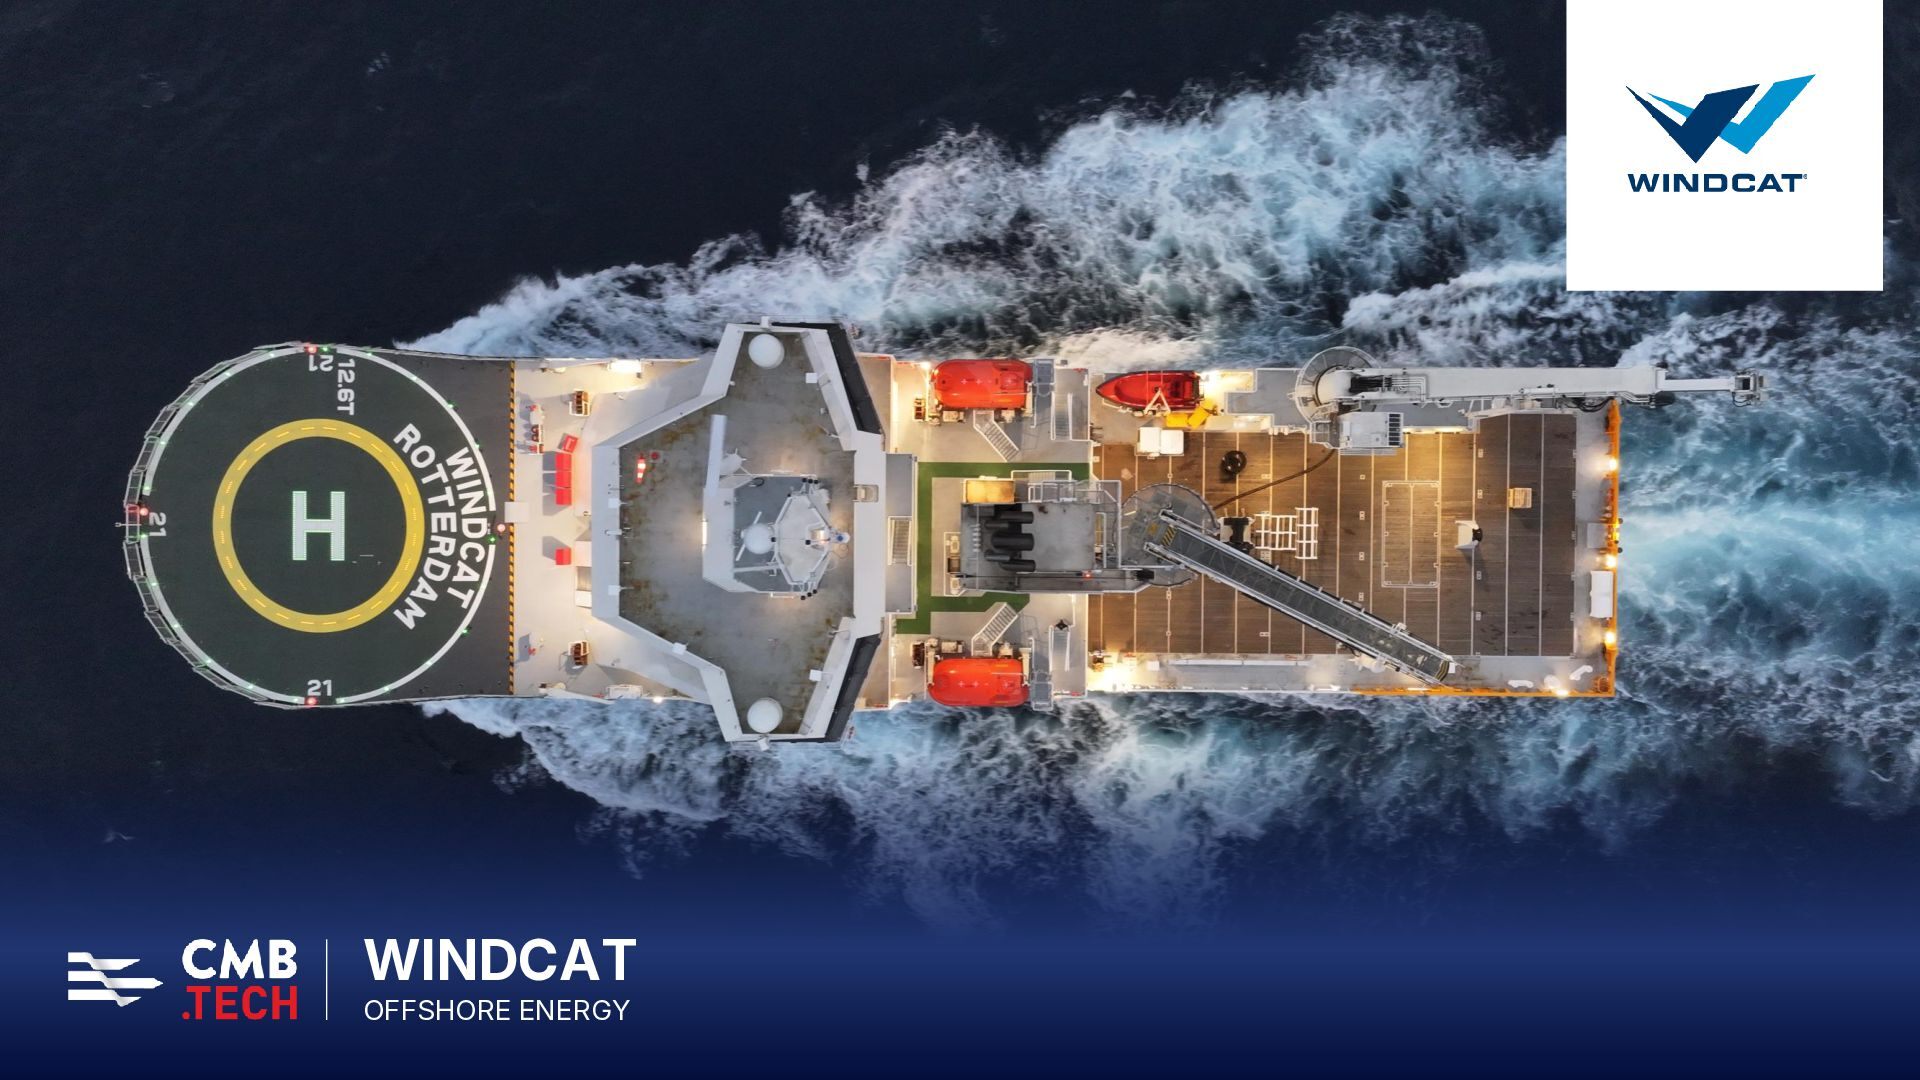
  26. WINDCAT OFFSHORE ENERGY © 2026 – CMB.TECH Public presentation :

    do not replicate or distribute without the prior written permission of CMB.TECH 30
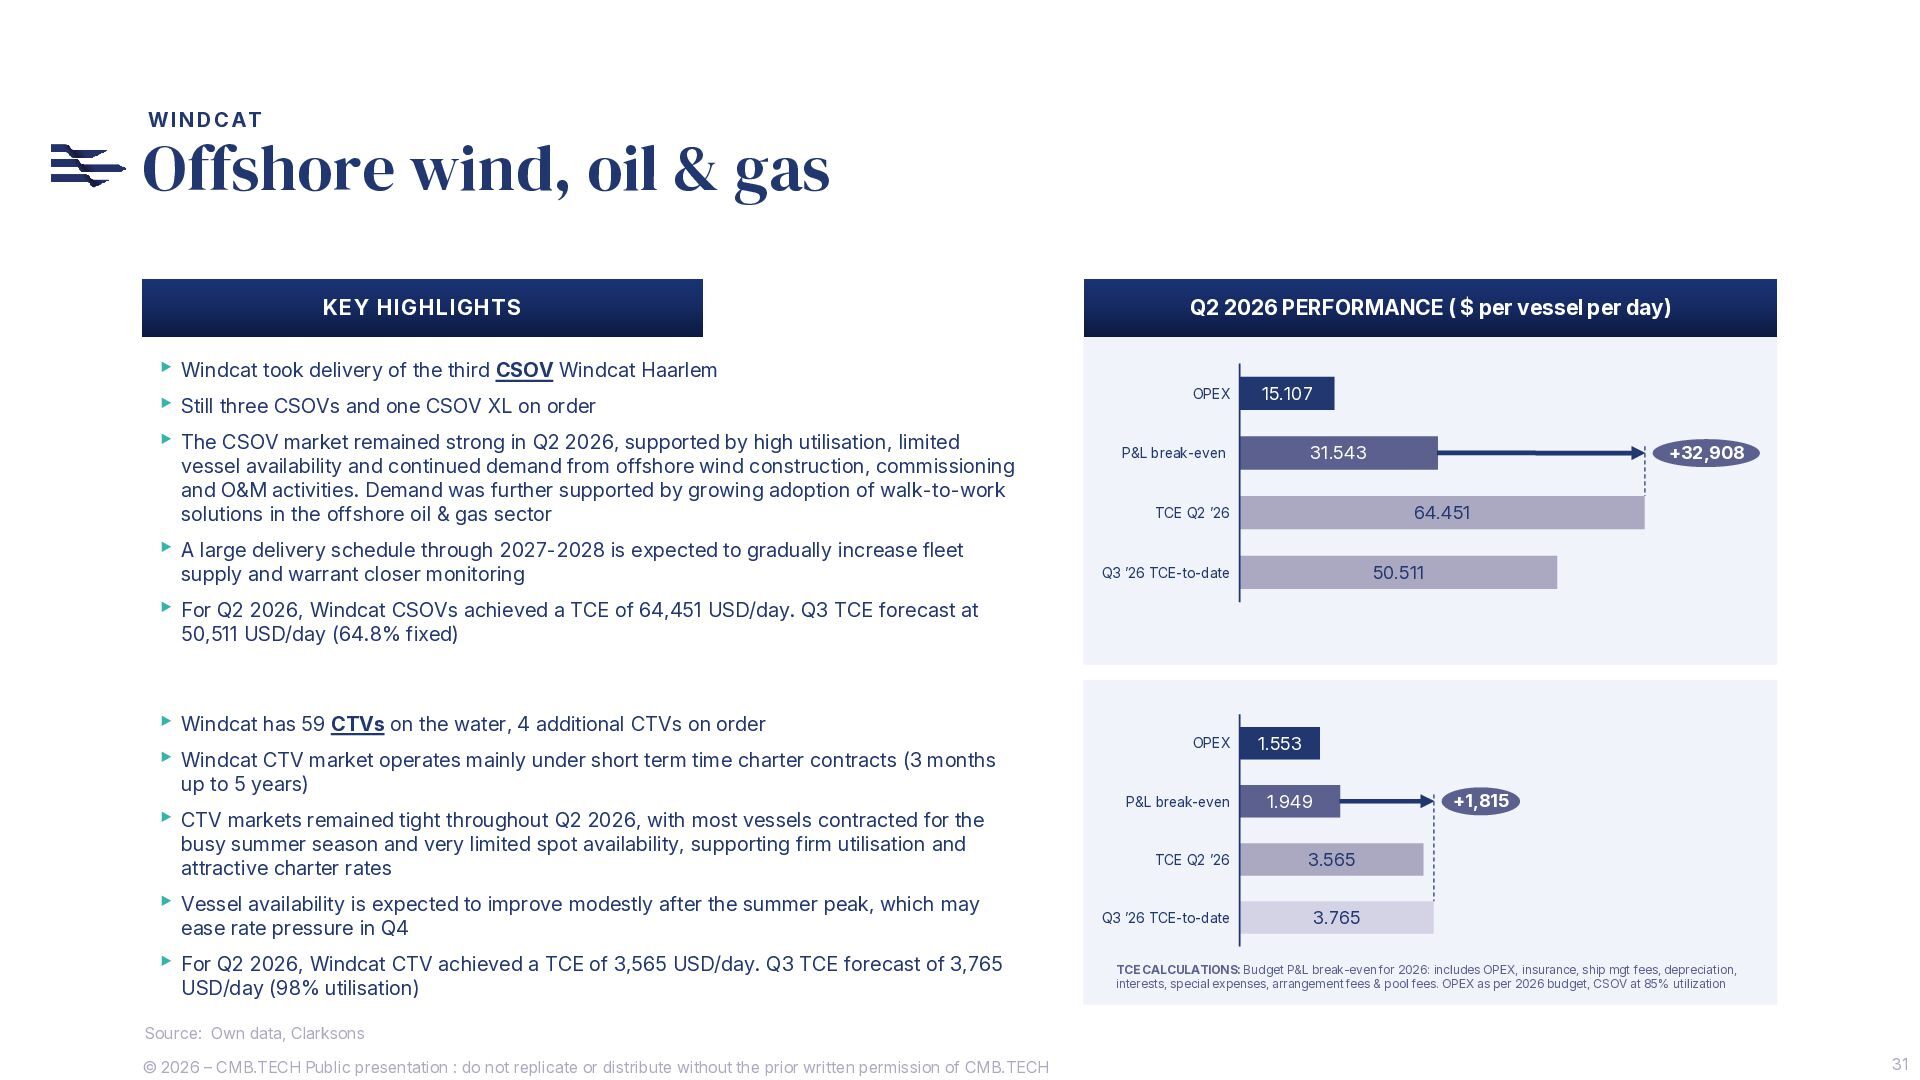
  27. WINDCAT Offshore wind, oil & gas KEY HIGHLIGHTS ▸ Windcat

    took delivery of the third CSOV Windcat Haarlem ▸ Still three CSOVs and one CSOV XL on order ▸ The CSOV market remained strong in Q2 2026, supported by high utilisation, limited vessel availability and continued demand from offshore wind construction, commissioning and O&M activities. Demand was further supported by growing adoption of walk-to-work solutions in the offshore oil & gas sector Q2 2026 PERFORMANCE ( $ per vessel per day) OPEX 15.107 64.451 TCE Q2 ’26 ▸ A large delivery schedule through 2027-2028 is expected to gradually increase fleet supply and warrant closer monitoring +32,908 31.543 P&L break-even 50.511 Q3 ’26 TCE-to-date ▸ For Q2 2026, Windcat CSOVs achieved a TCE of 64,451 USD/day. Q3 TCE forecast at 50,511 USD/day (64.8% fixed) ▸ Windcat has 59 CTVs on the water, 4 additional CTVs on order ▸ Windcat CTV market operates mainly under short term time charter contracts (3 months up to 5 years) ▸ CTV markets remained tight throughout Q2 2026, with most vessels contracted for the busy summer season and very limited spot availability, supporting firm utilisation and attractive charter rates ▸ Vessel availability is expected to improve modestly after the summer peak, which may ease rate pressure in Q4 ▸ For Q2 2026, Windcat CTV achieved a TCE of 3,565 USD/day. Q3 TCE forecast of 3,765 USD/day (98% utilisation) OPEX P&L break-even 1.553 +1,815 1.949 TCE Q2 ’26 3.565 Q3 ’26 TCE-to-date 3.765 TCE CALCULATIONS: Budget P&L break-even for 2026: includes OPEX, insurance, ship mgt fees, depreciation, interests, special expenses, arrangement fees & pool fees. OPEX as per 2026 budget, CSOV at 85% utilization Source: Own data, Clarksons © 2026 – CMB.TECH Public presentation : do not replicate or distribute without the prior written permission of CMB.TECH 31
  28. Q&A ► If you would like to ask a question,

    please raise your hand. ► Introduce yourself & unmute before asking your question. ► If you can’t unmute, please use the Q&A section to ask your question. ► For telephone participants, please type *5 to raise your hand and *6 to unmute. ► If you have any follow-up questions, please send an e-mail to [email protected]