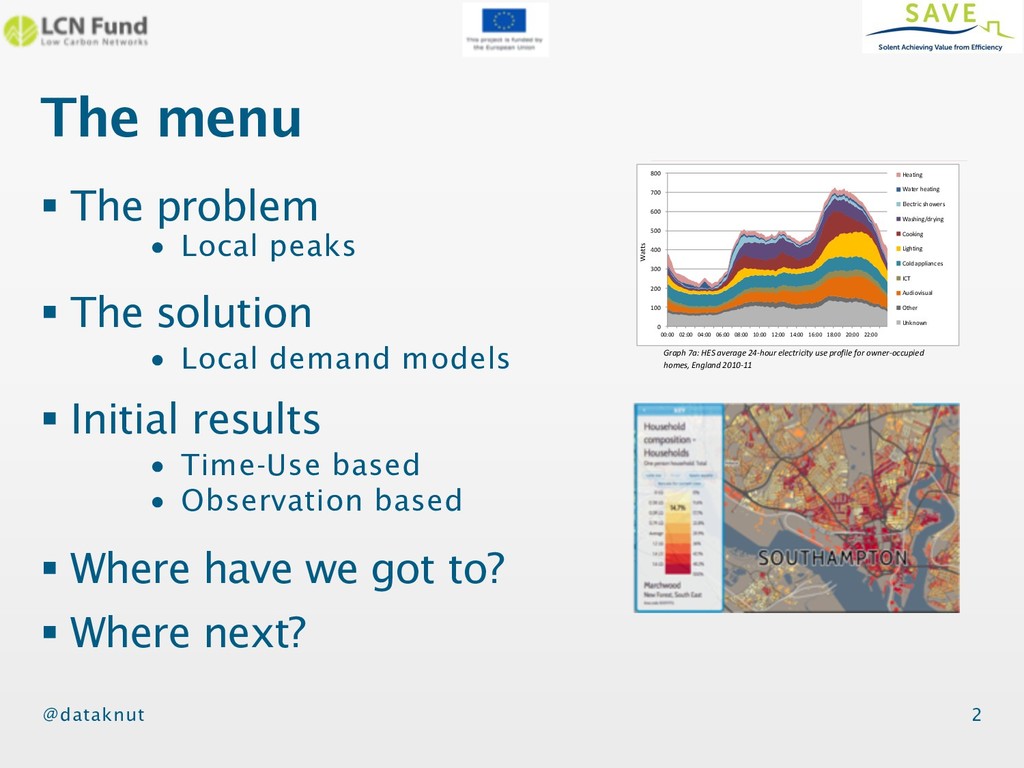
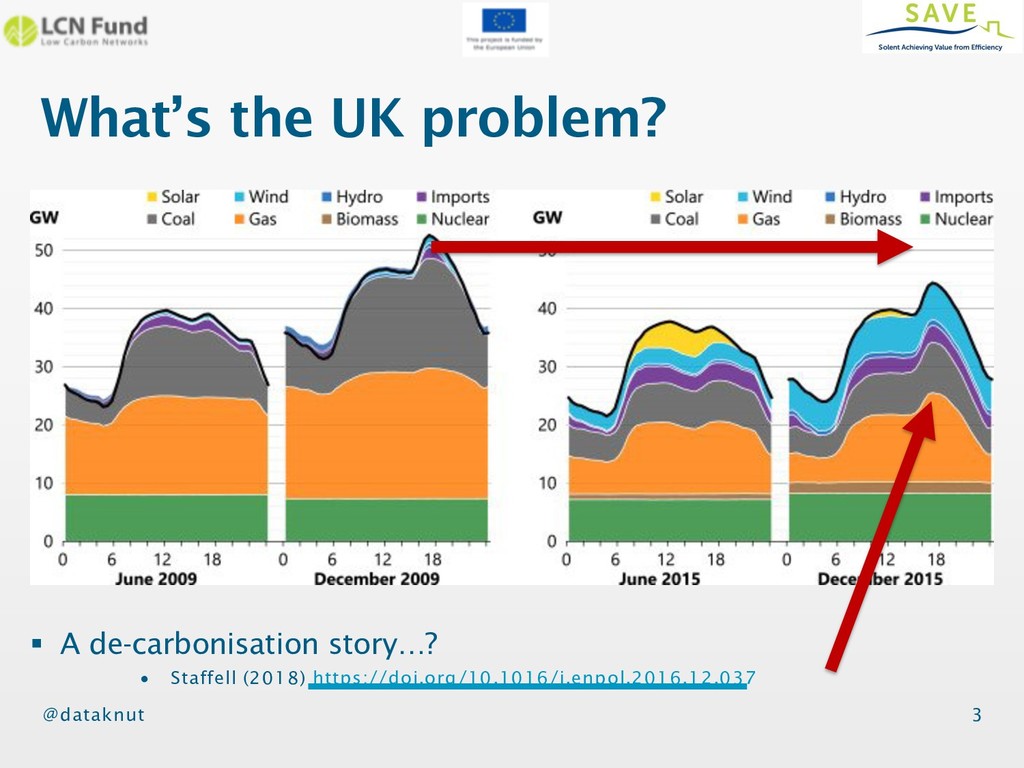
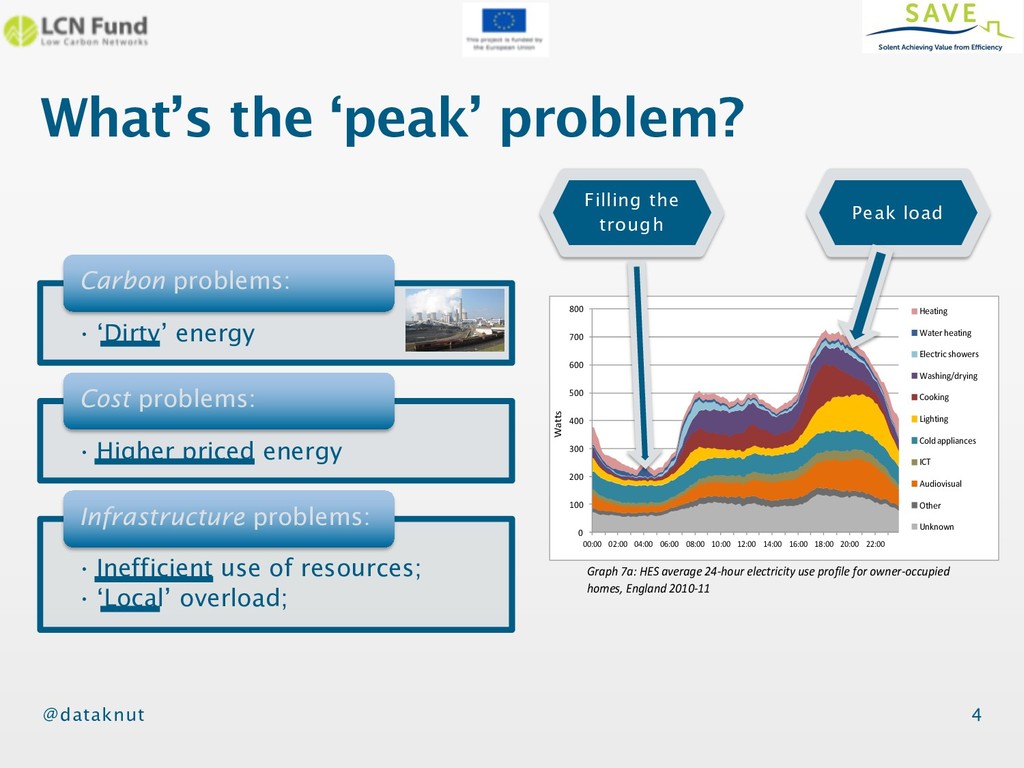
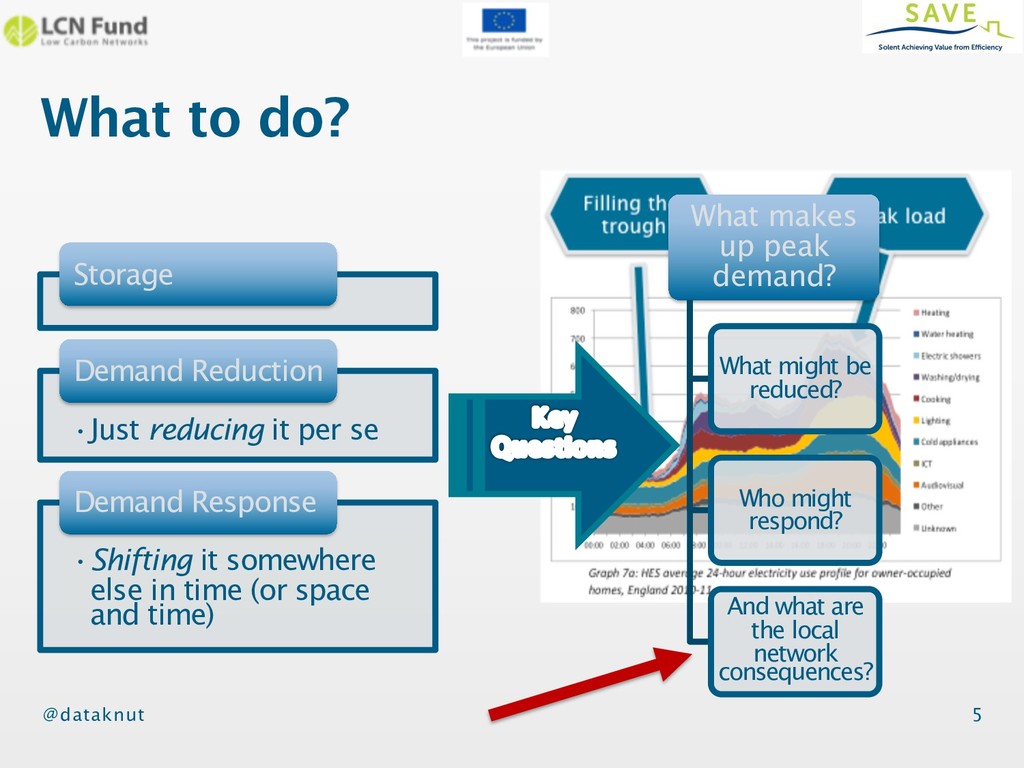
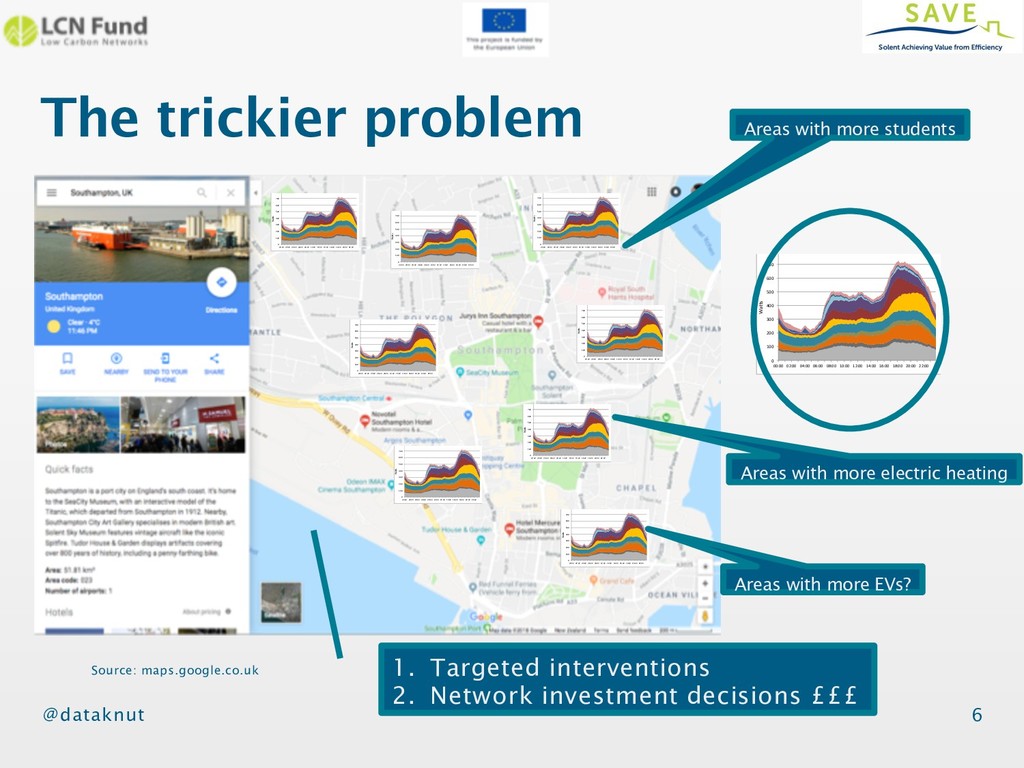
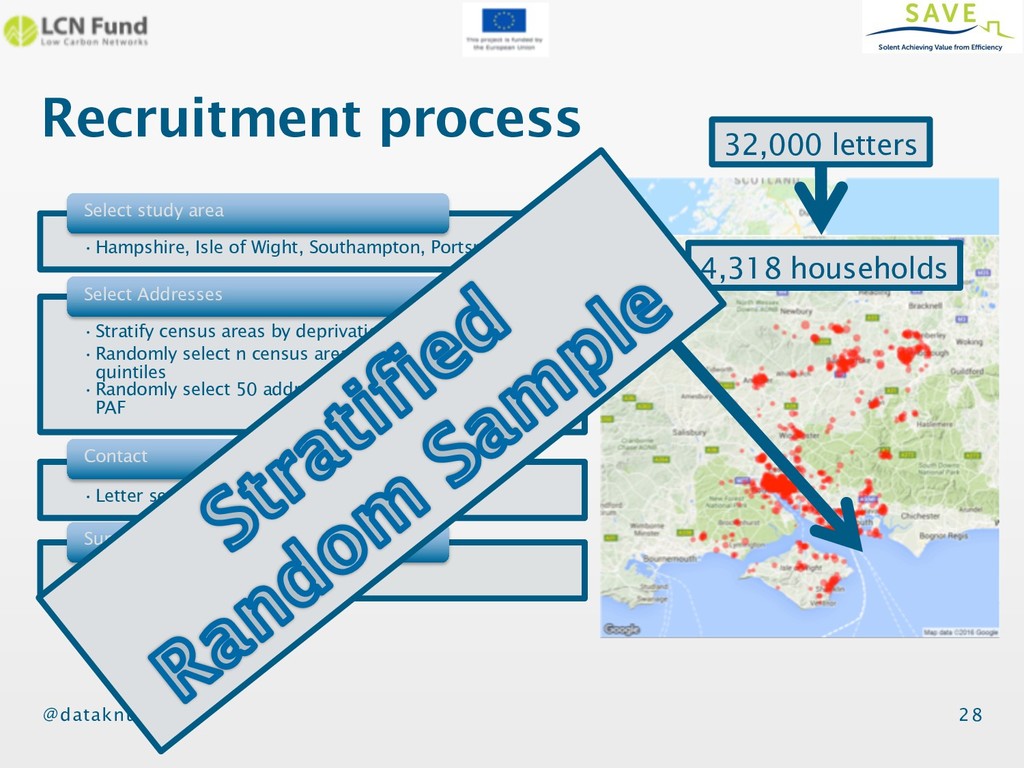
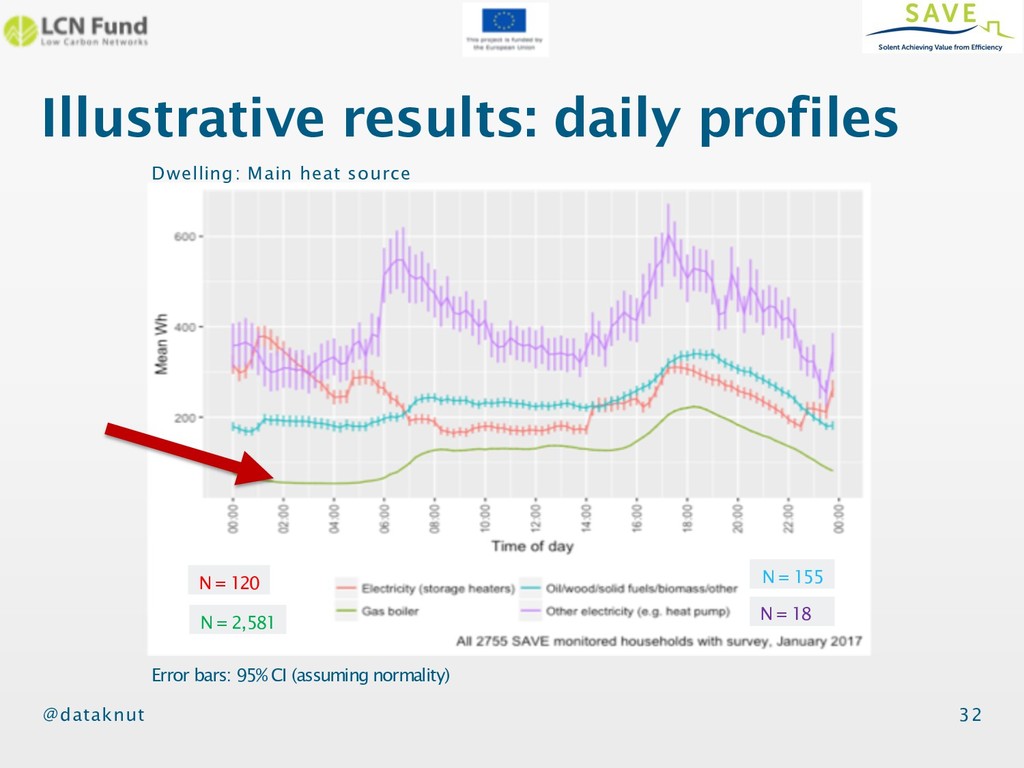
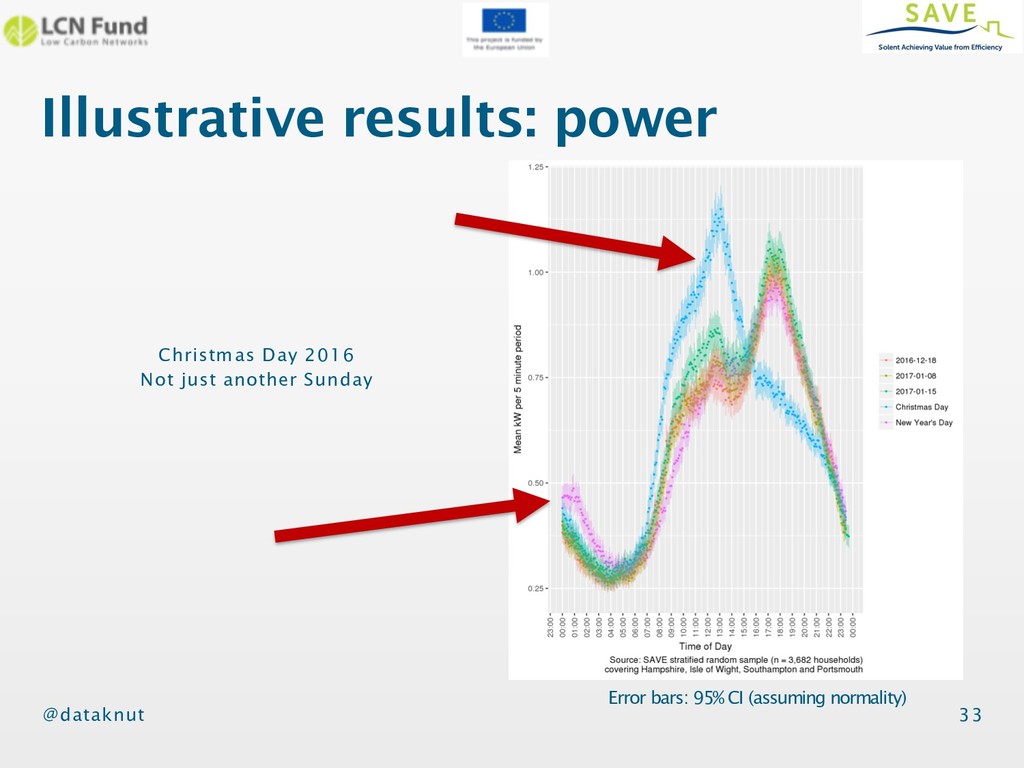
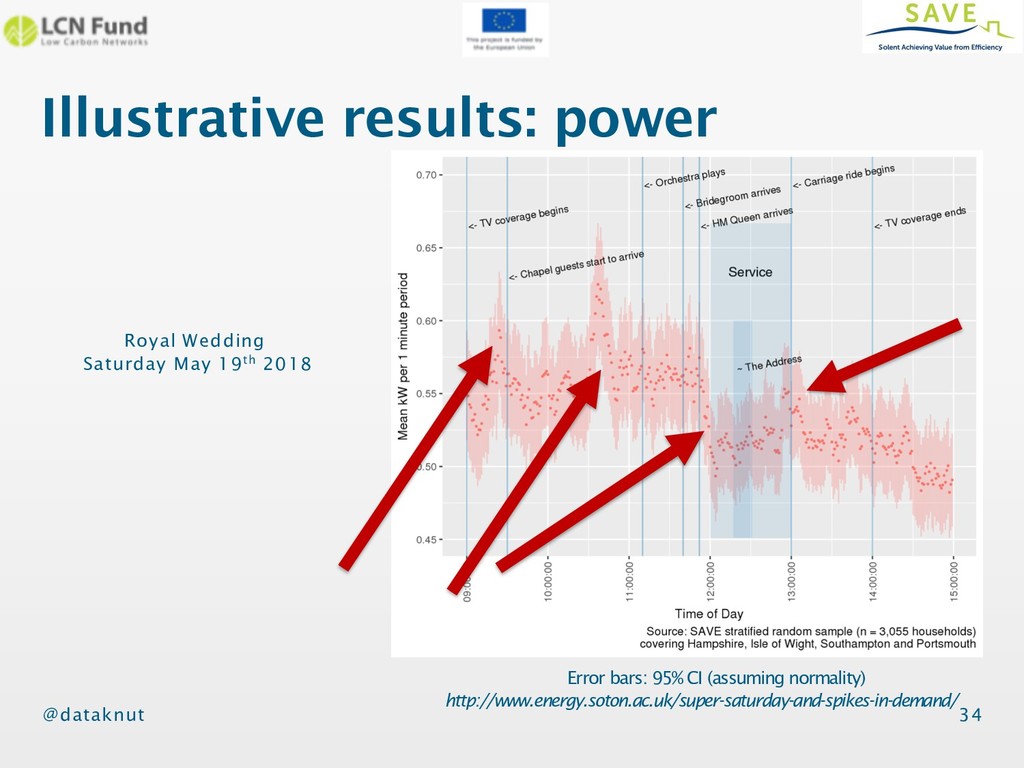
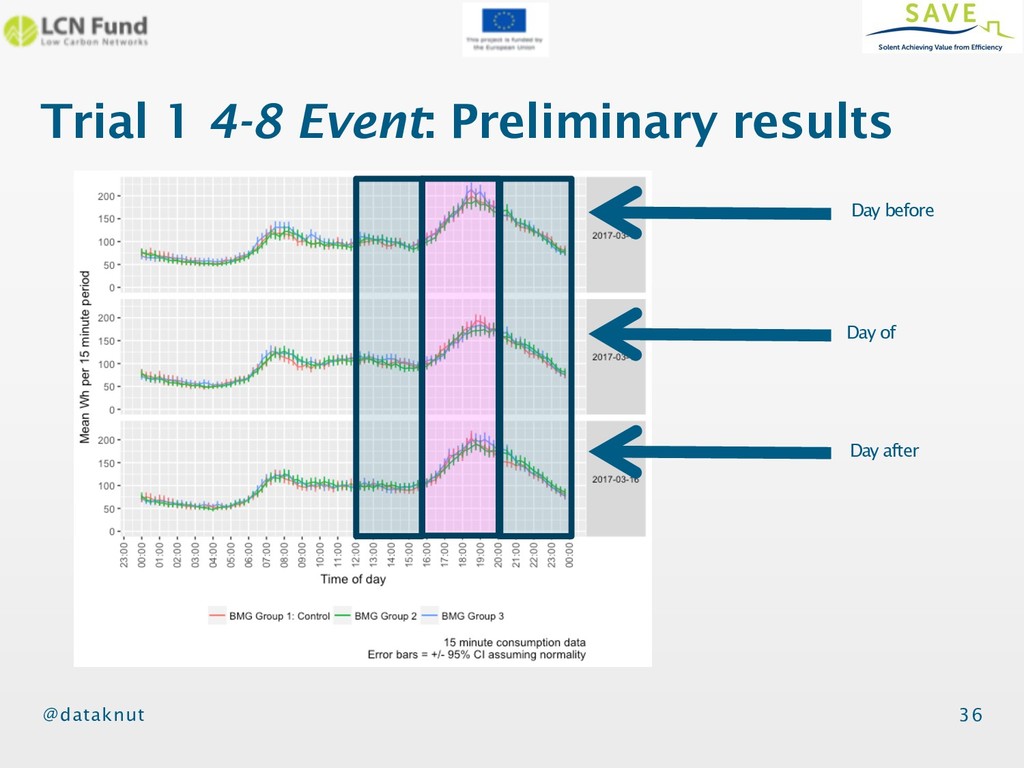
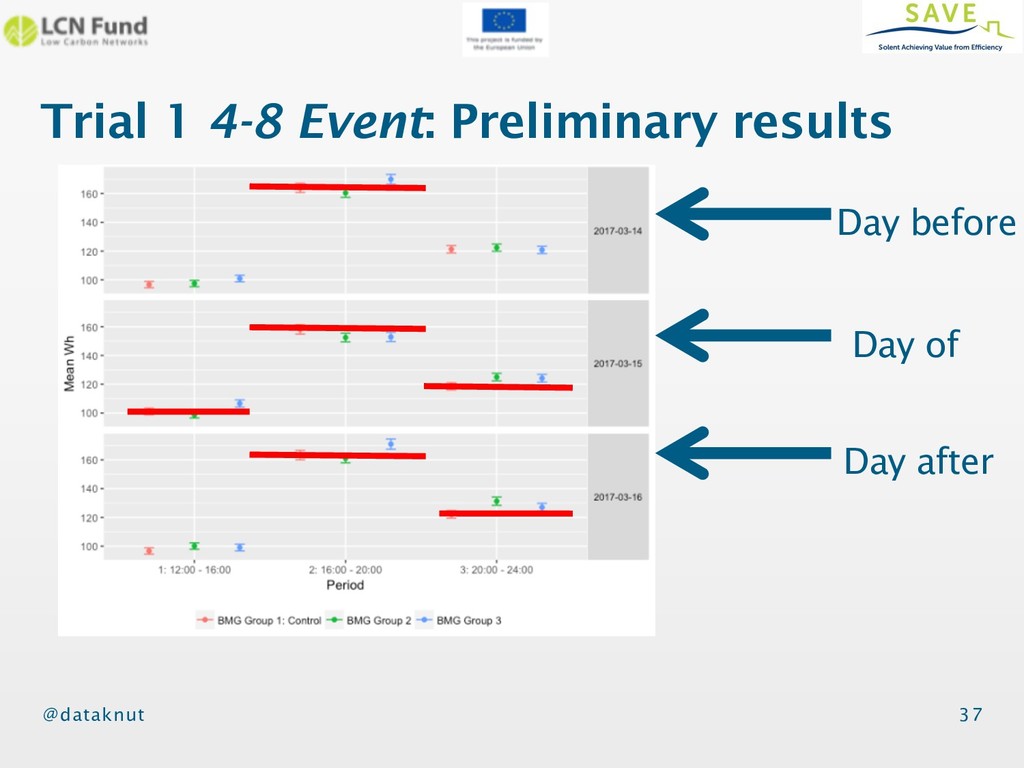
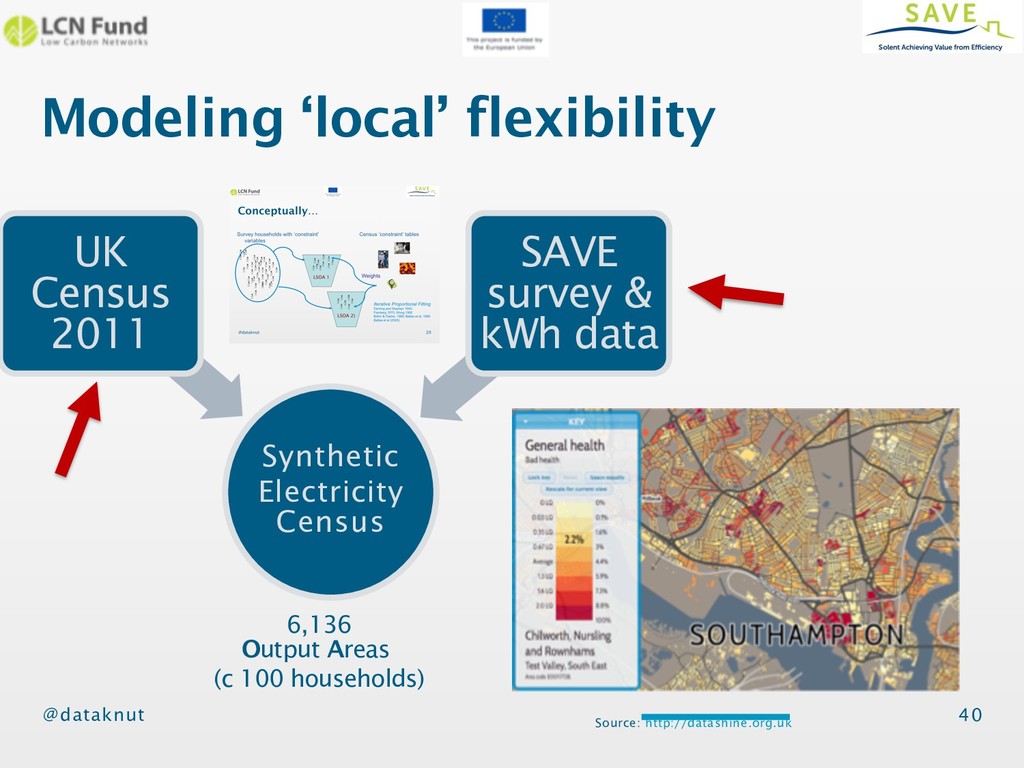
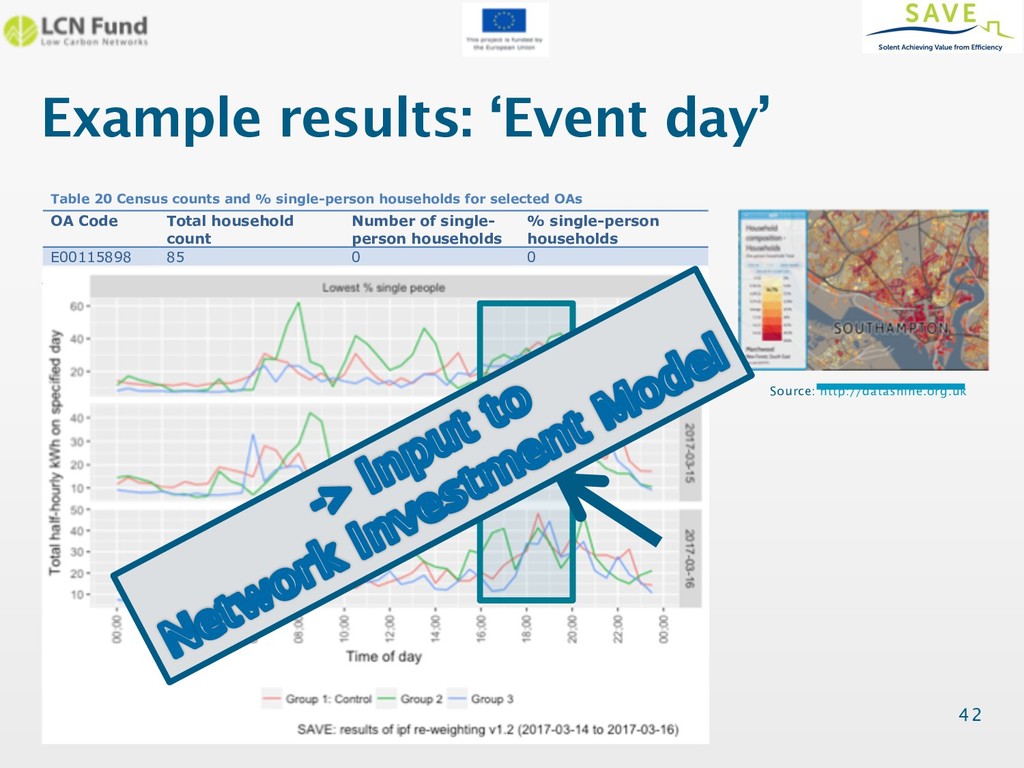
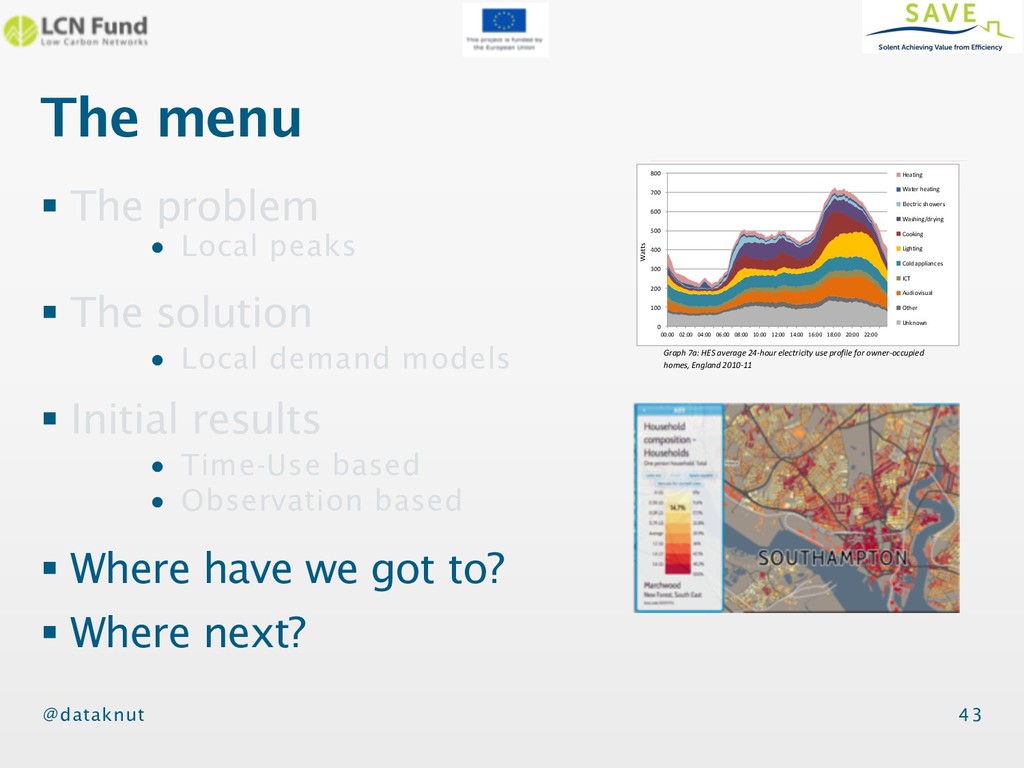
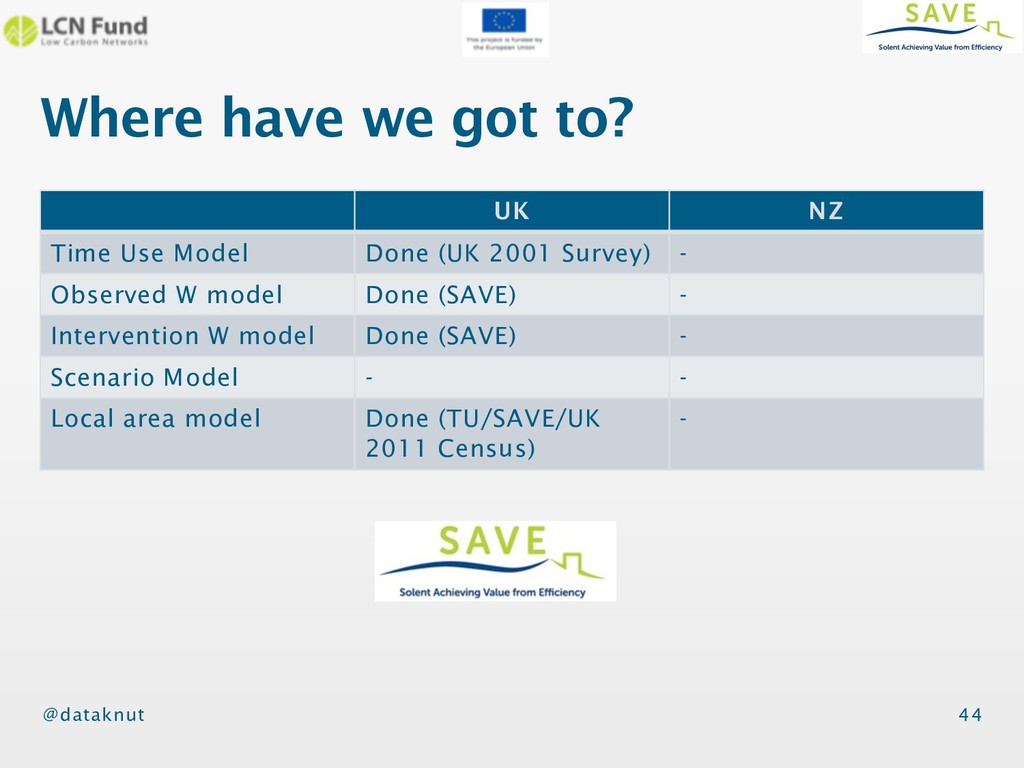
average 24-hour electricity use profile for owner-occupied homes, England 2010-11 Gas consumption The amount of gas consumed in the UK varies dramatically between households. The top 10% of households consume at least four times as much gas as the bottom 10%.60 Modelling to predict households’ energy consumption – based on the property, household income and tenure – has so far been able to explain less than 40% of this variation. Households with especially high or low consumption do not have particular behaviours that make them easy to identify. Instead they tend to have a cluster of very ordinary behaviours that happen to culminate in high or low gas use. There are, it seems, many different ways to be a high or low gas user. The behaviours in question can be clustered under three broad headings: • physical properties of the home – the particular physical environment in which people live • temperature management – how people manage the temperature in their homes and their awareness of the energy implications of their actions • people in the home – who is in the home, and when, and what they are doing. 60 Physical properties of the home Many UK homes have been modified by extensions, conservatories, conversions and/or open plan spaces. These modifications have the potential to affect the thermal properties of a home. But, typically, these have not been included in existing quantitative modelling of domestic energy consumption. Gas use varies enormously from household to household, and the variation has more to do with behaviour than how dwellings are built. 0 100 200 300 400 500 600 700 800 00:00 02:00 04:00 06:00 08:00 10:00 12:00 14:00 16:00 18:00 20:00 22:00 Heating Water heating Electric showers Washing/drying Cooking Lighting Cold appliances ICT Audiovisual Other Unknown Watts The trickier problem 6 Source: maps.google.co.uk UK Housing Energy Fact File 65 Graph 7a: HES average 24-hour electricity use profile for owner-occupied homes, England 2010-11 Gas consumption The amount of gas consumed in the UK varies dramatically between households. The top 10% of households consume at least four times as much gas as the bottom 10%.60 Modelling to predict households’ energy consumption – based on the property, household income and tenure – has so far been able to explain less than 40% of this variation. Households with especially high or low consumption do not have particular behaviours that make them easy to identify. Instead they tend to have a cluster of very ordinary behaviours that happen to culminate in high or low gas use. There are, it seems, many different ways to be a high or low gas user. The behaviours in question can be clustered under three broad headings: • physical properties of the home – the particular physical environment in which people live • temperature management – how people manage the temperature in their homes and their awareness of the energy implications of their actions • people in the home – who is in the home, and when, and what they are doing. 60 Physical properties of the home Many UK homes have been modified by extensions, conservatories, conversions and/or open plan spaces. These modifications have the potential to affect the thermal properties of a home. But, typically, these have not been included in existing quantitative modelling of domestic energy consumption. Gas use varies enormously from household to household, and the variation has more to do with behaviour than how dwellings are built. 0 100 200 300 400 500 600 700 800 00:00 02:00 04:00 06:00 08:00 10:00 12:00 14:00 16:00 18:00 20:00 22:00 Heating Water heating Electric showers Washing/drying Cooking Lighting Cold appliances ICT Audiovisual Other Unknown Watts UK Housing Energy Fact File 65 Graph 7a: HES average 24-hour electricity use profile for owner-occupied homes, England 2010-11 Gas consumption The amount of gas consumed in the UK varies dramatically between households. The top 10% of households consume at least four times as much gas as the bottom 10%.60 Modelling to predict households’ energy consumption – based on the property, household income and tenure – has so far been able to explain less than 40% of this variation. Households with especially high or low consumption do not have particular behaviours that make them easy to identify. Instead they tend to have a cluster of very ordinary behaviours that happen to culminate in high or low gas use. There are, it seems, many different ways to be a high or low gas user. The behaviours in question can be clustered under three broad headings: • physical properties of the home – the particular physical environment in which people live • temperature management – how people manage the temperature in their homes and their awareness of the energy implications of their actions • people in the home – who is in the home, and when, and what they are doing. 60 Physical properties of the home Many UK homes have been modified by extensions, conservatories, conversions and/or open plan spaces. These modifications have the potential to affect the thermal properties of a home. But, typically, these have not been included in existing quantitative modelling of domestic energy consumption. Gas use varies enormously from household to household, and the variation has more to do with behaviour than how dwellings are built. 0 100 200 300 400 500 600 700 800 00:00 02:00 04:00 06:00 08:00 10:00 12:00 14:00 16:00 18:00 20:00 22:00 Heating Water heating Electric showers Washing/drying Cooking Lighting Cold appliances ICT Audiovisual Other Unknown Watts UK Housing Energy Fact File 65 Graph 7a: HES average 24-hour electricity use profile for owner-occupied homes, England 2010-11 Gas consumption The amount of gas consumed in the UK varies dramatically between households. The top 10% of households consume at least four times as much gas as the bottom 10%.60 Modelling to predict households’ energy consumption – based on the property, household income and tenure – has so far been able to explain less than 40% of this variation. Households with especially high or low consumption do not have particular behaviours that make them easy to identify. Instead they tend to have a cluster of very ordinary behaviours that happen to culminate in high or low gas use. There are, it seems, many different ways to be a high or low gas user. The behaviours in question can be clustered under three broad headings: • physical properties of the home – the particular physical environment in which people live • temperature management – how people manage the temperature in their homes and their awareness of the energy implications of their actions • people in the home – who is in the home, and when, and what they are doing. 60 Physical properties of the home Many UK homes have been modified by extensions, conservatories, conversions and/or open plan spaces. These modifications have the potential to affect the thermal properties of a home. But, typically, these have not been included in existing quantitative modelling of domestic energy consumption. Gas use varies enormously from household to household, and the variation has more to do with behaviour than how dwellings are built. 0 100 200 300 400 500 600 700 800 00:00 02:00 04:00 06:00 08:00 10:00 12:00 14:00 16:00 18:00 20:00 22:00 Heating Water heating Electric showers Washing/drying Cooking Lighting Cold appliances ICT Audiovisual Other Unknown Watts UK Housing Energy Fact File 65 Graph 7a: HES average 24-hour electricity use profile for owner-occupied homes, England 2010-11 Gas consumption The amount of gas consumed in the UK varies dramatically between households. The top 10% of households consume at least four times as much gas as the bottom 10%.60 Modelling to predict households’ energy consumption – based on the property, household income and tenure – has so far been able to explain less than 40% of this variation. Households with especially high or low consumption do not have particular behaviours that make them easy to identify. Instead they tend to have a cluster of very ordinary behaviours that happen to culminate in high or low gas use. There are, it seems, many different ways to be a high or low gas user. The behaviours in question can be clustered under three broad headings: • physical properties of the home – the particular physical environment in which people live • temperature management – how people manage the temperature in their homes and their awareness of the energy implications of their actions • people in the home – who is in the home, and when, and what they are doing. 60 Physical properties of the home Many UK homes have been modified by extensions, conservatories, conversions and/or open plan spaces. These modifications have the potential to affect the thermal properties of a home. But, typically, these have not been included in existing quantitative modelling of domestic energy consumption. Gas use varies enormously from household to household, and the variation has more to do with behaviour than how dwellings are built. 0 100 200 300 400 500 600 700 800 00:00 02:00 04:00 06:00 08:00 10:00 12:00 14:00 16:00 18:00 20:00 22:00 Heating Water heating Electric showers Washing/drying Cooking Lighting Cold appliances ICT Audiovisual Other Unknown Watts UK Housing Energy Fact File 65 Graph 7a: HES average 24-hour electricity use profile for owner-occupied homes, England 2010-11 Gas consumption The amount of gas consumed in the UK varies dramatically between households. The top 10% of households consume at least four times as much gas as the bottom 10%.60 Modelling to predict households’ energy consumption – based on the property, household income and tenure – has so far been able to explain less than 40% of this variation. Households with especially high or low consumption do not have particular behaviours that make them easy to identify. Instead they tend to have a cluster of very ordinary behaviours that happen to culminate in high or low gas use. There are, it seems, many different ways to be a high or low gas user. The behaviours in question can be clustered under three broad headings: • physical properties of the home – the particular physical environment in which people live • temperature management – how people manage the temperature in their homes and their awareness of the energy implications of their actions • people in the home – who is in the home, and when, and what they are doing. 60 Physical properties of the home Many UK homes have been modified by extensions, conservatories, conversions and/or open plan spaces. These modifications have the potential to affect the thermal properties of a home. But, typically, these have not been included in existing quantitative modelling of domestic energy consumption. Gas use varies enormously from household to household, and the variation has more to do with behaviour than how dwellings are built. 0 100 200 300 400 500 600 700 800 00:00 02:00 04:00 06:00 08:00 10:00 12:00 14:00 16:00 18:00 20:00 22:00 Heating Water heating Electric showers Washing/drying Cooking Lighting Cold appliances ICT Audiovisual Other Unknown Watts UK Housing Energy Fact File 65 Graph 7a: HES average 24-hour electricity use profile for owner-occupied homes, England 2010-11 Gas consumption The amount of gas consumed in the UK varies dramatically between households. The top 10% of households consume at least four times as much gas as the bottom 10%.60 Modelling to predict households’ energy consumption – based on the property, household income and tenure – has so far been able to explain less than 40% of this variation. Households with especially high or low consumption do not have particular behaviours that make them easy to identify. Instead they tend to have a cluster of very ordinary behaviours that happen to culminate in high or low gas use. There are, it seems, many different ways to be a high or low gas user. The behaviours in question can be clustered under three broad headings: • physical properties of the home – the particular physical environment in which people live • temperature management – how people manage the temperature in their homes and their awareness of the energy implications of their actions • people in the home – who is in the home, and when, and what they are doing. 60 Physical properties of the home Many UK homes have been modified by extensions, conservatories, conversions and/or open plan spaces. These modifications have the potential to affect the thermal properties of a home. But, typically, these have not been included in existing quantitative modelling of domestic energy consumption. Gas use varies enormously from household to household, and the variation has more to do with behaviour than how dwellings are built. 0 100 200 300 400 500 600 700 800 00:00 02:00 04:00 06:00 08:00 10:00 12:00 14:00 16:00 18:00 20:00 22:00 Heating Water heating Electric showers Washing/drying Cooking Lighting Cold appliances ICT Audiovisual Other Unknown Watts UK Housing Energy Fact File 65 Graph 7a: HES average 24-hour electricity use profile for owner-occupied homes, England 2010-11 Gas consumption The amount of gas consumed in the UK varies dramatically between households. The top 10% of households consume at least four times as much gas as the bottom 10%.60 Modelling to predict households’ energy consumption – based on the property, household income and tenure – has so far been able to explain less than 40% of this variation. Households with especially high or low consumption do not have particular behaviours that make them easy to identify. Instead they tend to have a cluster of very ordinary behaviours that happen to culminate in high or low gas use. There are, it seems, many different ways to be a high or low gas user. The behaviours in question can be clustered under three broad headings: • physical properties of the home – the particular physical environment in which people live • temperature management – how people manage the temperature in their homes and their awareness of the energy implications of their actions • people in the home – who is in the home, and when, and what they are doing. 60 Physical properties of the home Many UK homes have been modified by extensions, conservatories, conversions and/or open plan spaces. These modifications have the potential to affect the thermal properties of a home. But, typically, these have not been included in existing quantitative modelling of domestic energy consumption. Gas use varies enormously from household to household, and the variation has more to do with behaviour than how dwellings are built. 0 100 200 300 400 500 600 700 800 00:00 02:00 04:00 06:00 08:00 10:00 12:00 14:00 16:00 18:00 20:00 22:00 Heating Water heating Electric showers Washing/drying Cooking Lighting Cold appliances ICT Audiovisual Other Unknown Watts UK Housing Energy Fact File 65 Graph 7a: HES average 24-hour electricity use profile for owner-occupied homes, England 2010-11 Gas consumption The amount of gas consumed in the UK varies dramatically between households. The top 10% of households consume at least four times as much gas as the bottom 10%.60 Modelling to predict households’ energy consumption – based on the property, household income and tenure – has so far been able to explain less than 40% of this variation. Households with especially high or low consumption do not have particular behaviours that make them easy to identify. Instead they tend to have a cluster of very ordinary behaviours that happen to culminate in high or low gas use. There are, it seems, many different ways to be a high or low gas user. The behaviours in question can be clustered under three broad headings: • physical properties of the home – the particular physical environment in which people live • temperature management – how people manage the temperature in their homes and their awareness of the energy implications of their actions • people in the home – who is in the home, and when, and what they are doing. 60 Physical properties of the home Many UK homes have been modified by extensions, conservatories, conversions and/or open plan spaces. These modifications have the potential to affect the thermal properties of a home. But, typically, these have not been included in existing quantitative modelling of domestic energy consumption. Gas use varies enormously from household to household, and the variation has more to do with behaviour than how dwellings are built. 0 100 200 300 400 500 600 700 800 00:00 02:00 04:00 06:00 08:00 10:00 12:00 14:00 16:00 18:00 20:00 22:00 Heating Water heating Electric showers Washing/drying Cooking Lighting Cold appliances ICT Audiovisual Other Unknown Watts Areas with more electric heating Areas with more students Areas with more EVs? 1. Targeted interventions 2. Network investment decisions £££
![Neighbourhood Demand Profiles Ben Anderson [email protected] / [email protected] @dataknut Why,](https://files.speakerdeck.com/presentations/32c402a1562944579e80082d68ec0ebe/slide_0.jpg)