Upgrade to Pro — share decks privately, control downloads, hide ads and more …

Trends in the timing of energy using activities: what can be learnt from time use data?

Ben Anderson
January 14, 2016

Trends in the timing of energy using activities: what can be learnt from time use data?

3 presentations:
1: Trends in the timing of energy using activities: what can be learnt from time use data?
2: Data Byte: Solar Citizens
3: Data Byte: Patterns of car use in the UK and the implications for EV charging

These were given at a @DEMAND_CENTRE (http://www.demand.ac.uk/) dissemination event hosted by the The Association for Decentralised Energy (http://www.theade.co.uk/), 14th January 2016, London.

Ben Anderson

January 14, 2016
Tweet

More Decks by Ben Anderson

Other Decks in Research

Transcript

  1. @DEMAND_CENTRE What is energy for, when is it used and

    how is this changing? Insights from @DEMAND_CENTRE research ADE, London 14/1/2016 Ben Anderson Energy & Climate Change University of Southampton Trends in the <ming of energy using ac<vi<es: what can be learnt from <me use data?
  2. @DEMAND_CENTRE What is energy for, when is it used and

    how is this changing? Insights from @DEMAND_CENTRE research ADE, London 14/1/2016 1.  What’s a <me use diary? 2.  Data overview 3.  Applica<on to Energy Demand 4.  Ac<vity classes: overall trends 5.  Selected Ac<vi<es: detailed trends 6.  Concluding thoughts Today’s menu
  3. @DEMAND_CENTRE What is energy for, when is it used and

    how is this changing? Insights from @DEMAND_CENTRE research ADE, London 14/1/2016 What’s a <me use survey? BBC 1961 ONS 2005
  4. @DEMAND_CENTRE What is energy for, when is it used and

    how is this changing? Insights from @DEMAND_CENTRE research ADE, London 14/1/2016 ‘Episodes’ data availability Multinational Time Use Study www.timeuse.org/ mtus Gershuny, Jonathan, Kimberly Fisher, Evrim Altintas, Alyssa Borkosky, Donna Dosman, Cara Fedick, Tyler Frederick, et al. 2012. ‘Multinational Time Use Study, Versions World 5.5.3, 5.80 and 6.0 (released October 2012)’. Oxford. http://www.eijtur.org/pdf/volumes/eIJTUR-10-1-6_Time_Pieces.pdf#page=90 Year survey began (survey id) Australia Austria France Germany Israel Italy Netherlands South Africa Spain United Kingdom USA No. No. No. No. No. No. No. No. No. No. No. 1965 221 1974 1491 14898 1975 81 788 1980 16667 1983 945 1985 2776 2921 1987 1533 1989 29973 1990 2299 1991 22554 4223 1992 2236 494 7514 1994 1199 1995 2692 1962 1997 4931 1998 14631 2351 2000 11851 1142 17248 2002 47381 2003 1361 2005 13265 4854 2008 6272 2009 17859
  5. @DEMAND_CENTRE What is energy for, when is it used and

    how is this changing? Insights from @DEMAND_CENTRE research ADE, London 14/1/2016 ‘1985’ Availability UK 2014-15 Out soon!
  6. @DEMAND_CENTRE What is energy for, when is it used and

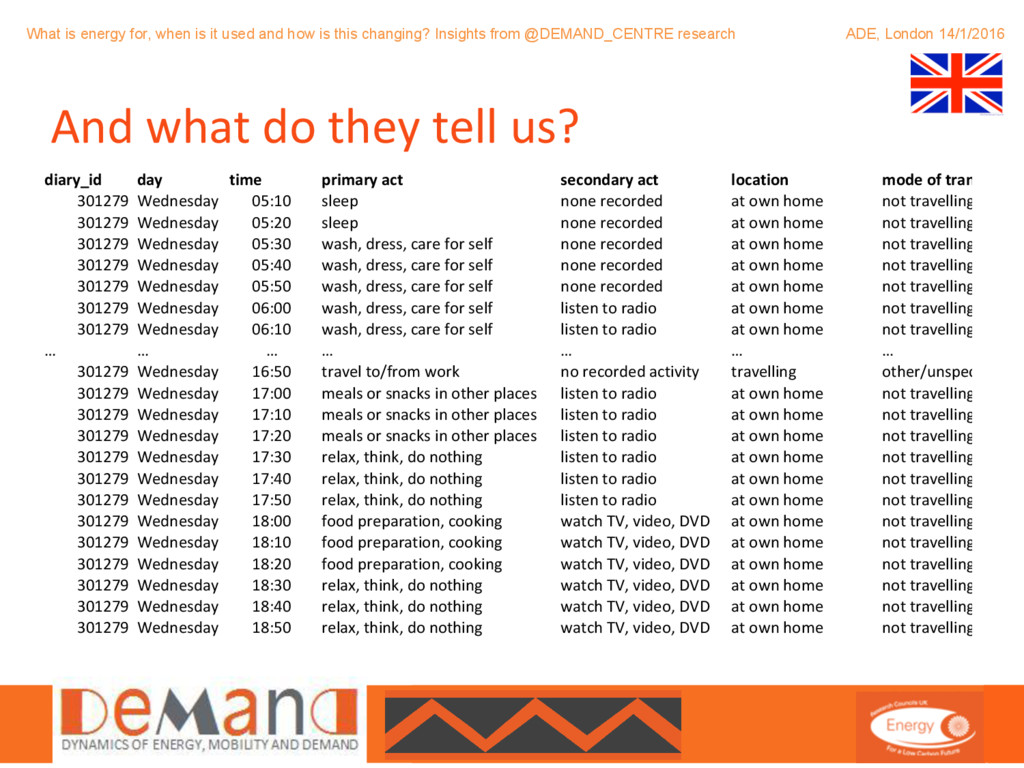
    how is this changing? Insights from @DEMAND_CENTRE research ADE, London 14/1/2016 And what do they tell us? diary_id day time primary+act secondary+act location mode+of+transport 301279 Wednesday 05:10 sleep none3recorded at3own3home not3travelling 301279 Wednesday 05:20 sleep none3recorded at3own3home not3travelling 301279 Wednesday 05:30 wash,3dress,3care3for3self none3recorded at3own3home not3travelling 301279 Wednesday 05:40 wash,3dress,3care3for3self none3recorded at3own3home not3travelling 301279 Wednesday 05:50 wash,3dress,3care3for3self none3recorded at3own3home not3travelling 301279 Wednesday 06:00 wash,3dress,3care3for3self listen3to3radio at3own3home not3travelling 301279 Wednesday 06:10 wash,3dress,3care3for3self listen3to3radio at3own3home not3travelling … … … … … … … 301279 Wednesday 16:50 travel3to/from3work no3recorded3activity travelling other/unspecified3tra 301279 Wednesday 17:00 meals3or3snacks3in3other3places listen3to3radio at3own3home not3travelling 301279 Wednesday 17:10 meals3or3snacks3in3other3places listen3to3radio at3own3home not3travelling 301279 Wednesday 17:20 meals3or3snacks3in3other3places listen3to3radio at3own3home not3travelling 301279 Wednesday 17:30 relax,3think,3do3nothing listen3to3radio at3own3home not3travelling 301279 Wednesday 17:40 relax,3think,3do3nothing listen3to3radio at3own3home not3travelling 301279 Wednesday 17:50 relax,3think,3do3nothing listen3to3radio at3own3home not3travelling 301279 Wednesday 18:00 food3preparation,3cooking watch3TV,3video,3DVD at3own3home not3travelling 301279 Wednesday 18:10 food3preparation,3cooking watch3TV,3video,3DVD at3own3home not3travelling 301279 Wednesday 18:20 food3preparation,3cooking watch3TV,3video,3DVD at3own3home not3travelling 301279 Wednesday 18:30 relax,3think,3do3nothing watch3TV,3video,3DVD at3own3home not3travelling 301279 Wednesday 18:40 relax,3think,3do3nothing watch3TV,3video,3DVD at3own3home not3travelling 301279 Wednesday 18:50 relax,3think,3do3nothing watch3TV,3video,3DVD at3own3home not3travelling
  7. @DEMAND_CENTRE What is energy for, when is it used and

    how is this changing? Insights from @DEMAND_CENTRE research ADE, London 14/1/2016 But we have to be careful… 1974 1983/7 1995 2001 2005 Harmonisa<on MTUS: 69 ‘harmonised’ activity codes 1974: 73 codes ‘1985’: 188 codes 1995: 190 codes 2001: 265 codes 2005: 30 codes
  8. @DEMAND_CENTRE What is energy for, when is it used and

    how is this changing? Insights from @DEMAND_CENTRE research ADE, London 14/1/2016 But we have to be careful… 1974 1983/7 1995 2001 2005 Harmonisa<on 1974: Housework Routine Housework “Cleaning” Non-routine housework “Laundry”
  9. @DEMAND_CENTRE What is energy for, when is it used and

    how is this changing? Insights from @DEMAND_CENTRE research ADE, London 14/1/2016 1.  What’s a <me use diary? 2.  Data overview 3.  Applica<on to Energy Demand 4.  Ac<vity classes: overall trends 5.  Selected Ac<vi<es: detailed trends 6.  Concluding thoughts Today’s menu
  10. @DEMAND_CENTRE What is energy for, when is it used and

    how is this changing? Insights from @DEMAND_CENTRE research ADE, London 14/1/2016 Some things are easier than others… Torri< (2012) Demand Side Management for the European Supergrid: Occupancy variances of European single-person households, Energy Policy 44 (2012) 199– 206 Occupancy levels in single person households c. 2005
  11. @DEMAND_CENTRE What is energy for, when is it used and

    how is this changing? Insights from @DEMAND_CENTRE research ADE, London 14/1/2016 Power demand profiles can be inferred… 0 500 1000 1500 2000 2500 3000 00:00 01:00 02:00 03:00 04:00 05:00 06:00 07:00 08:00 09:00 10:00 11:00 12:00 13:00 14:00 15:00 16:00 17:00 18:00 19:00 20:00 21:00 22:00 23:00 Imputed mean power per half hour (W) Lighting Audio TV Reading Computer Ironing Laundry Cleaning Dish washing Cooking Wash/dress self Source: Imputed power for acts at home based on Widen et al doi:10.1016/j.enbuild.2009.02.013 using ONS 2005 Time Use Survey (h^p://dx.doi.org/10.5255/UKDA-SN-5592-1), author’s calcula<ons
  12. @DEMAND_CENTRE What is energy for, when is it used and

    how is this changing? Insights from @DEMAND_CENTRE research ADE, London 14/1/2016 1.  What’s a <me use diary? 2.  Data overview 3.  Applica<on to Energy Demand 4.  Ac<vity classes: overall trends 5.  Selected Ac<vi<es: detailed trends 6.  Concluding thoughts But for DEMAND…
  13. @DEMAND_CENTRE What is energy for, when is it used and

    how is this changing? Insights from @DEMAND_CENTRE research ADE, London 14/1/2016 10 Ac<vity ‘classes’ 1.  Travel 2.  Media use 3.  Sport/exercise 4.  Voluntary, civic or leisure 5.  Shopping/service use 6.  Educa<on related 7.  Work related 8.  Cooking & ea<ng 9.  Personal, child or adult care, domes<c work 10. Sleep % of respondents – 1974 Source: MTUS 1974, author’s calcula<ons, weighted
  14. @DEMAND_CENTRE What is energy for, when is it used and

    how is this changing? Insights from @DEMAND_CENTRE research ADE, London 14/1/2016 What’s changed? % of respondents – 1974 % of respondents – ‘1985’ % of respondents – 2000 % of respondents – 2005 Source: MTUS 1974-2005, author’s calcula<ons, primary ac<vi<es, weighted
  15. @DEMAND_CENTRE What is energy for, when is it used and

    how is this changing? Insights from @DEMAND_CENTRE research ADE, London 14/1/2016 % point change 1974 – 2005 - primary -25 -20 -15 -10 -5 0 5 10 15 00:00 01:00 02:00 03:00 04:00 05:00 06:00 07:00 08:00 09:00 10:00 11:00 12:00 13:00 14:00 15:00 16:00 17:00 18:00 19:00 20:00 21:00 22:00 23:00 % point change 1974 - 2005 Travel Media use incl. TV, radio, PC, internet Sport or exercise Voluntary, civic, watching sport, leisure or social activities Shopping/service use Education or related Work or work related Cooking or eating Personal, child, adult or household care/ chores Source: MTUS 1974-2005, author’s calcula<ons, primary ac<vi<es, weighted
  16. @DEMAND_CENTRE What is energy for, when is it used and

    how is this changing? Insights from @DEMAND_CENTRE research ADE, London 14/1/2016 -25.0% -20.0% -15.0% -10.0% -5.0% 0.0% 5.0% 10.0% 15.0% 00:00 01:00 02:00 03:00 04:00 05:00 06:00 07:00 08:00 09:00 10:00 11:00 12:00 13:00 14:00 15:00 16:00 17:00 18:00 19:00 20:00 21:00 22:00 23:00 % point change 1974-2005 Travel Media use incl. TV, radio, PC, internet Sport or exercise Voluntary, civic, watching sport, leisure or social activities Shopping/service use Education or related Work or work related Cooking or eating Personal, child, adult or household care/chores % point change 1974 – 2005 - secondary Source: MTUS 1974-2005, author’s calcula<ons, secondary ac<vi<es, weighted
  17. @DEMAND_CENTRE What is energy for, when is it used and

    how is this changing? Insights from @DEMAND_CENTRE research ADE, London 14/1/2016 1.  What’s a <me use diary? 2.  Data overview 3.  Applica<on to Energy Demand 4.  Ac<vity classes: overall trends 5.  Selected Ac<vi<es: detailed trends 6.  Concluding thoughts Today’s menu
  18. @DEMAND_CENTRE What is energy for, when is it used and

    how is this changing? Insights from @DEMAND_CENTRE research ADE, London 14/1/2016 In detail: ‘Cooking’ & Ea<ng @home % point change 1974 - 2005 -12.00% -10.00% -8.00% -6.00% -4.00% -2.00% 0.00% 2.00% 4.00% 00:00 01:00 02:00 03:00 04:00 05:00 06:00 07:00 08:00 09:00 10:00 11:00 12:00 13:00 14:00 15:00 16:00 17:00 18:00 19:00 20:00 21:00 22:00 23:00 Ea<ng Food prepara<on -7.00% -6.00% -5.00% -4.00% -3.00% -2.00% -1.00% 0.00% 1.00% 2.00% 00:00 01:30 03:00 04:30 06:00 07:30 09:00 10:30 12:00 13:30 15:00 16:30 18:00 19:30 21:00 22:30 Source: MTUS 1974-2005, author’s calcula<ons, weighted
  19. @DEMAND_CENTRE What is energy for, when is it used and

    how is this changing? Insights from @DEMAND_CENTRE research ADE, London 14/1/2016 -0.6% -0.4% -0.2% 0.0% 0.2% 0.4% 0.6% 00:00 01:00 02:00 03:00 04:00 05:00 06:00 07:00 08:00 09:00 10:00 11:00 12:00 13:00 14:00 15:00 16:00 17:00 18:00 19:00 20:00 21:00 22:00 23:00 Weekdays (average) Saturday Sunday In detail: ‘Cooking’ @home Source: MTUS 1974-2005, author’s calcula<ons, weighted % point change in rela<ve distribu<on within year 1974 – 2005 Whither Sunday lunch?
  20. @DEMAND_CENTRE What is energy for, when is it used and

    how is this changing? Insights from @DEMAND_CENTRE research ADE, London 14/1/2016 In detail: Sunday Lunch -0.05 0 0.05 0.1 0.15 0.2 0.25 16-24 25-34 35-44 45-54 55-64 65-74 75+ Prevalence of Sunday lunch lowest 25% middle 50% highest 25% Source: MTUS 1974-2005, author’s calcula<ons, Mean number of half hours in which food prep at home on Sunday 11:00 – 14:00 was reported by income group, weighted 1974 -0.05 0 0.05 0.1 0.15 0.2 0.25 16-24 25-34 35-44 45-54 55-64 64-74 75+ lowest 25% middle 50% highest 25% 2005 Income:
  21. @DEMAND_CENTRE What is energy for, when is it used and

    how is this changing? Insights from @DEMAND_CENTRE research ADE, London 14/1/2016 In detail: Travel Source: MTUS 1974-2005, author’s calcula<ons, weighted As a primary or secondary ac<vity 0% 2% 4% 6% 8% 10% 12% 14% 16% 18% 20% 00:00 01:30 03:00 04:30 06:00 07:30 09:00 10:30 12:00 13:30 15:00 16:30 18:00 19:30 21:00 22:30 % half hours 1974 Saturday Sunday Weekdays (average) 0% 2% 4% 6% 8% 10% 12% 14% 16% 18% 20% 00:00 01:30 03:00 04:30 06:00 07:30 09:00 10:30 12:00 13:30 15:00 16:30 18:00 19:30 21:00 22:30 % half hours 2005 Saturday Sunday Weekdays (average)
  22. @DEMAND_CENTRE What is energy for, when is it used and

    how is this changing? Insights from @DEMAND_CENTRE research ADE, London 14/1/2016 In detail: Travel Source: MTUS 1974-2005, author’s calcula<ons, weighted Ac<vity class (primary) -2.00% -1.00% 0.00% 1.00% 2.00% 3.00% 4.00% 5.00% 6.00% 00:00 01:30 03:00 04:30 06:00 07:30 09:00 10:30 12:00 13:30 15:00 16:30 18:00 19:30 21:00 22:30 % point difference 1974-2005 Primary Secondary 0.0% 2.0% 4.0% 6.0% 8.0% 10.0% 12.0% 14.0% 00:00 01:00 02:00 03:00 04:00 05:00 06:00 07:00 08:00 09:00 10:00 11:00 12:00 13:00 14:00 15:00 16:00 17:00 18:00 19:00 20:00 21:00 22:00 % half hours 2005 1974
  23. @DEMAND_CENTRE What is energy for, when is it used and

    how is this changing? Insights from @DEMAND_CENTRE research ADE, London 14/1/2016 In detail: Car use Source: MTUS 1974-2005, author’s calcula<ons, weighted As a primary or secondary ac<vity -1.000% 0.000% 1.000% 2.000% 3.000% 4.000% 5.000% 6.000% 7.000% 8.000% 9.000% 10.000% 00:00 01:00 02:00 03:00 04:00 05:00 06:00 07:00 08:00 09:00 10:00 11:00 12:00 13:00 14:00 15:00 16:00 17:00 18:00 19:00 20:00 21:00 22:00 23:00 2005 2000 1985 1974 -2.0% -1.5% -1.0% -0.5% 0.0% 0.5% 1.0% 00:00 01:30 03:00 04:30 06:00 07:30 09:00 10:30 12:00 13:30 15:00 16:30 18:00 19:30 21:00 22:30 % change 1974-2005 Weekdays (average) Saturday Sunday
  24. @DEMAND_CENTRE What is energy for, when is it used and

    how is this changing? Insights from @DEMAND_CENTRE research ADE, London 14/1/2016 In detail: Car use Source: MTUS 1974-2005, author’s calcula<ons, weighted As a primary or secondary ac<vity 0 0.5 1 1.5 2 2.5 3 3.5 4 1974 1985 2000 2005 Usage index lowest 25% middle 50% highest 25% 0 0.5 1 1.5 2 2.5 3 3.5 4 4.5 16-24 25-34 35-44 45-54 55-64 64-74 75+ lowest 25% middle 50% highest 25% 1974
  25. @DEMAND_CENTRE What is energy for, when is it used and

    how is this changing? Insights from @DEMAND_CENTRE research ADE, London 14/1/2016 0.00% 0.50% 1.00% 1.50% 2.00% 2.50% 00:00 01:00 02:00 03:00 04:00 05:00 06:00 07:00 08:00 09:00 10:00 11:00 12:00 13:00 14:00 15:00 16:00 17:00 18:00 19:00 20:00 21:00 22:00 23:00 PC/Internet In detail: Media use Source: MTUS 1974-2005, author’s calcula<ons, weighted % point change 1974* – 2005 * Except PC/internet: 1985-2005 As a primary or secondary ac<vity Ac<vity class -20.0% -15.0% -10.0% -5.0% 0.0% 5.0% 10.0% 15.0% 00:00 01:30 03:00 04:30 06:00 07:30 09:00 10:30 12:00 13:30 15:00 16:30 18:00 19:30 21:00 22:30 % point difference (primary) % point difference (secondary)
  26. @DEMAND_CENTRE What is energy for, when is it used and

    how is this changing? Insights from @DEMAND_CENTRE research ADE, London 14/1/2016 -2.0% -1.5% -1.0% -0.5% 0.0% 0.5% 1.0% 00:00 01:00 02:00 03:00 04:00 05:00 06:00 07:00 08:00 09:00 10:00 11:00 12:00 13:00 14:00 15:00 16:00 17:00 18:00 19:00 20:00 21:00 22:00 23:00 Weekday (average) Saturday Sunday Shijing prac<ces? Source: MTUS 1974-2005, author’s calcula<ons, weighted % point change 1974* – 2005 in rela<ve distribu<on within year * Except PC/internet: 1985-2005 As a primary or secondary ac<vity & standardised within years -0.3% -0.2% -0.2% -0.1% -0.1% 0.0% 0.1% 0.1% 0.2% 0.2% 0.3% 00:00 01:30 03:00 04:30 06:00 07:30 09:00 10:30 12:00 13:30 15:00 16:30 18:00 19:30 21:00 22:30 Weekday (average) Saturday Sunday TV/games PC/Internet
  27. @DEMAND_CENTRE What is energy for, when is it used and

    how is this changing? Insights from @DEMAND_CENTRE research ADE, London 14/1/2016 In detail: Care & Chores % point change 1974* – 2005 * Except laundry: 1985-2005 Source: MTUS 1974-2005, author’s calcula<ons, weighted -10.00% -8.00% -6.00% -4.00% -2.00% 0.00% 2.00% 00:00 01:30 03:00 04:30 06:00 07:30 09:00 10:30 12:00 13:30 15:00 16:30 18:00 19:30 21:00 22:30 Wash/dress -8.00% -6.00% -4.00% -2.00% 0.00% 2.00% 00:00 01:30 03:00 04:30 06:00 07:30 09:00 10:30 12:00 13:30 15:00 16:30 18:00 19:30 21:00 22:30 Cleaning -2.00% -1.00% 0.00% 1.00% 2.00% 00:00 01:30 03:00 04:30 06:00 07:30 09:00 10:30 12:00 13:30 15:00 16:30 18:00 19:30 21:00 22:30 Laundry
  28. @DEMAND_CENTRE What is energy for, when is it used and

    how is this changing? Insights from @DEMAND_CENTRE research ADE, London 14/1/2016 -0.6% -0.4% -0.2% 0.0% 0.2% 0.4% 0.6% 00:00 01:30 03:00 04:30 06:00 07:30 09:00 10:30 12:00 13:30 15:00 16:30 18:00 19:30 21:00 22:30 Weekday Saturday Sunday -0.4% -0.3% -0.2% -0.1% 0.0% 0.1% 0.2% 0.3% 0.4% 00:00 01:00 02:00 03:00 04:00 05:00 06:00 07:00 08:00 09:00 10:00 11:00 12:00 13:00 14:00 15:00 16:00 17:00 18:00 19:00 20:00 21:00 22:00 23:00 Weekday Saturday Sunday Shijing prac<ces? Laundry % point change 1974* – 2005 in rela<ve distribu<on within year * Except laundry: 1985-2005 Source: MTUS 1974-2005, author’s calcula<ons, weighted Cleaning
  29. @DEMAND_CENTRE What is energy for, when is it used and

    how is this changing? Insights from @DEMAND_CENTRE research ADE, London 14/1/2016 -0.6% -0.4% -0.2% 0.0% 0.2% 0.4% 0.6% 00:00 01:30 03:00 04:30 06:00 07:30 09:00 10:30 12:00 13:30 15:00 16:30 18:00 19:30 21:00 22:30 Weekday Saturday Sunday Shijing prac<ces? Laundry % point change laundry 1985 – 2005 in rela<ve distribu<on within year Source: MTUS 1974-2005, author’s calcula<ons, weighted 0 0.5 1 1.5 2 2.5 1974 1985 1995 2000 2005 % of half hours in which recorded lowest 25% middle 50% highest 25% % half hours where laundry reported by income group 1975-2005
  30. @DEMAND_CENTRE What is energy for, when is it used and

    how is this changing? Insights from @DEMAND_CENTRE research ADE, London 14/1/2016 84% of reported laundry in 2005 was by women The ‘double burden’ 0.0% 0.2% 0.4% 0.6% 0.8% 1.0% 1.2% 1.4% 1.6% 1.8% 2.0% Weekday (average) Saturday Sunday This is when it was reported by full-<me working women Source: MTUS 1974-2005, author’s calcula<ons, weighted % of laundry reported by full <me working women in 2005
  31. @DEMAND_CENTRE What is energy for, when is it used and

    how is this changing? Insights from @DEMAND_CENTRE research ADE, London 14/1/2016 1.  What’s a <me use diary? 2.  Data overview 3.  Applica<on to Energy Demand 4.  Ac<vity classes: overall trends 5.  Selected Ac<vi<es: detailed trends 6.  Concluding thoughts Today’s menu
  32. @DEMAND_CENTRE What is energy for, when is it used and

    how is this changing? Insights from @DEMAND_CENTRE research ADE, London 14/1/2016 Key messages I: Dynamism How do we ‘meet’ DEMAND? -25 -20 -15 -10 -5 0 5 10 15 00:00 01:30 03:00 04:30 06:00 07:30 09:00 10:30 12:00 13:30 15:00 16:30 18:00 19:30 21:00 22:30 % point change 1974 - 2005 Travel Media use incl. TV, radio, PC, internet Sport or exercise Voluntary, civic, watching sport, leisure or social activities Shopping/service use Education or related Work or work related Cooking or eating Personal, child, adult or household care/ chores When it keeps changing?
  33. @DEMAND_CENTRE What is energy for, when is it used and

    how is this changing? Insights from @DEMAND_CENTRE research ADE, London 14/1/2016 Key messages II: Constrained evolu<on Prac<ces Infrastr uctures Social trends Evolving demand Non-energy energy policy Labour market policies Working hours School hours (Sub)Urban planning
  34. @DEMAND_CENTRE What is energy for, when is it used and

    how is this changing? Insights from @DEMAND_CENTRE research ADE, London 14/1/2016 Ques<ons? @dataknut [email protected]
  35. @DEMAND_CENTRE What is energy for, when is it used and

    how is this changing? Insights from @DEMAND_CENTRE research ADE, London 14/1/2016 Data Byte: Solar Ci<zens Ben Anderson Energy & Climate Change University of Southampton
  36. @DEMAND_CENTRE What is energy for, when is it used and

    how is this changing? Insights from @DEMAND_CENTRE research ADE, London 14/1/2016 0% 10% 20% 30% 40% 50% 60% 70% 80% 90% 100% 00:00 01:00 02:00 03:00 04:00 05:00 06:00 07:00 08:00 09:00 10:00 11:00 12:00 13:00 14:00 15:00 16:00 17:00 18:00 19:00 20:00 21:00 22:00 23:00 Travel Media use incl. TV, radio, PC, internet Sport or exercise Voluntary, civic, watching sport, leisure or social activities Shopping/service use Education or related Work or work related Cooking or eating Personal, child, adult or household care/ chores Sleep/rest What might be current ‘solar prac<ces’? Source: ONS 2005, weighted, primary ac<vity class where at home, author’s calcula<ons Instant? Via storage?
  37. @DEMAND_CENTRE What is energy for, when is it used and

    how is this changing? Insights from @DEMAND_CENTRE research ADE, London 14/1/2016 0 500 1000 1500 2000 2500 3000 00:00 01:00 02:00 03:00 04:00 05:00 06:00 07:00 08:00 09:00 10:00 11:00 12:00 13:00 14:00 15:00 16:00 17:00 18:00 19:00 20:00 21:00 22:00 23:00 Imputed mean power per half hour (W) Lighting Audio TV Reading Computer Ironing Laundry Cleaning Dish washing Cooking Wash/dress self What might be current ‘solar power’ demand? Source: Imputed power for acts at home based on Widen et al doi:10.1016/j.enbuild.2009.02.013 using ONS 2005 Time Use Survey (h^p://dx.doi.org/10.5255/UKDA-SN-5592-1), author’s calcula<ons Instant? Via storage?
  38. @DEMAND_CENTRE What is energy for, when is it used and

    how is this changing? Insights from @DEMAND_CENTRE research ADE, London 14/1/2016 Who might be ‘solar ci<zens’? No effect for: Tenure Region Social status (NS-SEC) Source: Mul<variate regression on mean number of half hours > 75th percen<le imputed power demand, imputed power based on Widen et al doi:10.1016/j.enbuild.2009.02.013 using ONS 2005 Time Use Survey (h^p://dx.doi.org/10.5255/UKDA-SN-5592-1), author’s calcula<ons > 75th percentile power demand 11:00 – 14:00 -0.08 -0.06 -0.04 -0.02 0 0.02 0.04 45-54 55-64 65-74 75+ Semi-detached single person Inactive 1 child 2+ children Coefficient
  39. @DEMAND_CENTRE What is energy for, when is it used and

    how is this changing? Insights from @DEMAND_CENTRE research ADE, London 14/1/2016 Imputed ‘Solar Peak’ power ‘prac<ces’ Non-solar ci<zens, 2005 Imputed power based on Widen et al doi:10.1016/j.enbuild.2009.02.013 using ONS 2005 Time Use Survey (h^p://dx.doi.org/10.5255/UKDA-SN-5592-1), author’s calcula<ons 0 500 1000 1500 2000 2500 3000 3500 4000 11:00 11:30 12:00 12:30 13:00 13:30 14:00 14:30 W Lighting Audio TV Reading Computer Ironing Laundry Cleaning Dish washing Cooking Wash/dress self 0 500 1000 1500 2000 2500 3000 3500 4000 11:00 11:30 12:00 12:30 13:00 13:30 14:00 14:30 W Lighting Audio TV Reading Computer Ironing Laundry Cleaning Dish washing Cooking Wash/dress self Solar ci<zens, 2005
  40. @DEMAND_CENTRE What is energy for, when is it used and

    how is this changing? Insights from @DEMAND_CENTRE research ADE, London 14/1/2016 Ques<ons? Next: Pa=erns of car use in the UK and the implica@ons for EV charging @dataknut [email protected]
  41. @DEMAND_CENTRE What is energy for, when is it used and

    how is this changing? Insights from @DEMAND_CENTRE research ADE, London 14/1/2016 Data Byte: Pa^erns of car use in the UK and the implica<ons for EV charging Ben Anderson Energy & Climate Change University of Southampton
  42. @DEMAND_CENTRE What is energy for, when is it used and

    how is this changing? Insights from @DEMAND_CENTRE research ADE, London 14/1/2016 When do people charge EVs at home? Source: U.S. Department of Energy (2014) Evalua<ng Electric Vehicle Charging Impacts and Customer Charging Behaviours – Experiences from Six Smart Grid Investment Grant Projects, December 2014 Source: Ovo Power (2014) “This is what Tesla owners are doing while you sleep” h^p://blog.opower.com/2014/07/this-is-what-tesla- owners-are-doing-while-you-sleep/
  43. @DEMAND_CENTRE What is energy for, when is it used and

    how is this changing? Insights from @DEMAND_CENTRE research ADE, London 14/1/2016 When might they charge them? -1.0% 0.0% 1.0% 2.0% 3.0% 4.0% 5.0% 6.0% 7.0% 8.0% 9.0% 00:00 01:30 03:00 04:30 06:00 07:30 09:00 10:30 12:00 13:30 15:00 16:30 18:00 19:30 21:00 22:30 % half hours in which car use reported 2005 2000 1985 1974 Source: ONS 2005 Time Use Survey (h^p://dx.doi.org/10.5255/UKDA-SN-5592-1), author’s calcula<ons, weighted 0% 20% 40% 60% 80% 100% 120% 0.0% 0.5% 1.0% 1.5% 2.0% 2.5% 3.0% 3.5% 00:00 01:30 03:00 04:30 06:00 07:30 09:00 10:30 12:00 13:30 15:00 16:30 18:00 19:30 21:00 22:30 Car travel ending anywhere as % of acts Car travel ending at home as % of acts Car travel ending at home as % of car travel ending anywhere
  44. @DEMAND_CENTRE What is energy for, when is it used and

    how is this changing? Insights from @DEMAND_CENTRE research ADE, London 14/1/2016 And on which days? 0.00% 0.20% 0.40% 0.60% 0.80% 1.00% 1.20% 1.40% 1.60% % of half hours where car trip ends at home Sunday Weekdays (average) Saturday Source: ONS 2005 Time Use Survey (h^p://dx.doi.org/10.5255/UKDA-SN-5592-1), author’s calcula<ons, weighted
  45. @DEMAND_CENTRE What is energy for, when is it used and

    how is this changing? Insights from @DEMAND_CENTRE research ADE, London 14/1/2016 Implica<ons Prac<ces Infrastr uctures Social trends Evolving temporal demand Structuring factors Tariff incentives Out of home charging Car performance
  46. @DEMAND_CENTRE What is energy for, when is it used and

    how is this changing? Insights from @DEMAND_CENTRE research ADE, London 14/1/2016 As an example 0.00% 0.20% 0.40% 0.60% 0.80% 1.00% 1.20% 1.40% 1.60% % of half hours where car trip ends at home Sunday Weekdays (average) Saturday Source: ONS 2005, author’s calcula<ons, weighted How might these structuring factors change this?
  47. @DEMAND_CENTRE What is energy for, when is it used and

    how is this changing? Insights from @DEMAND_CENTRE research ADE, London 14/1/2016 Ques<ons? @dataknut [email protected]