Upgrade to Pro — share decks privately, control downloads, hide ads and more …

Making Better Decisions using Flow Metrics

Making Better Decisions using Flow Metrics

A talk on five flow metrics that focus on business outcomes: What, Why, How, +plus considerations

Dominica DeGrandis

December 06, 2018
Tweet

More Decks by Dominica DeGrandis

Other Decks in Technology

Transcript

  1. © Tasktop 2018 Making Better Decisions with Flow Metrics Mik

    Kersten, Tasktop CEO Dominica DeGrandis, Director Digital Transformation
  2. © Tasktop 2018 • Flow metrics are tied to business

    value • Flow metrics are based on outcomes • Flow metrics provide a feedback loop to improve decisions WHAT’s THE POINT?
  3. © Tasktop 2018 v Flow Distribution: A measure to see

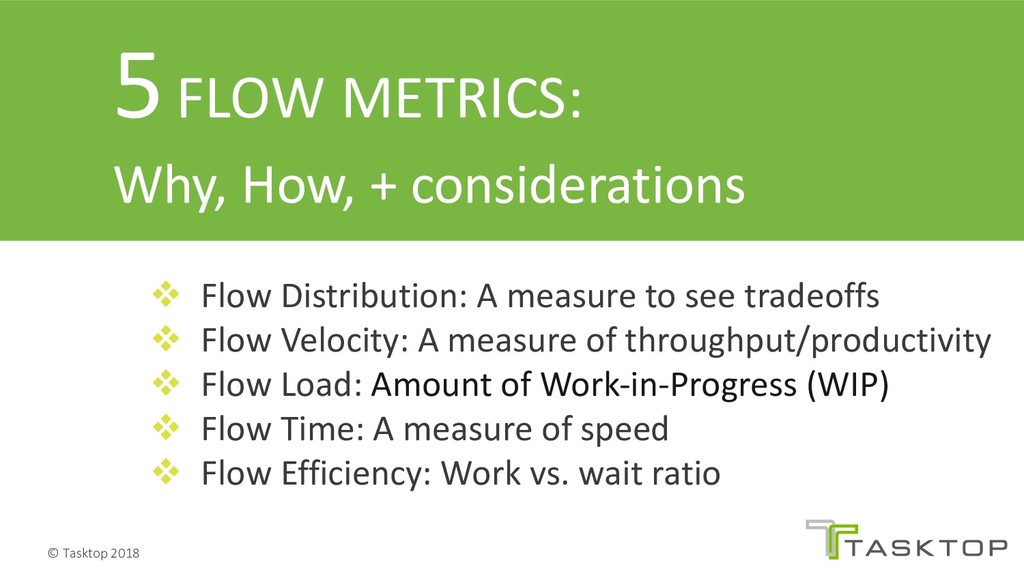
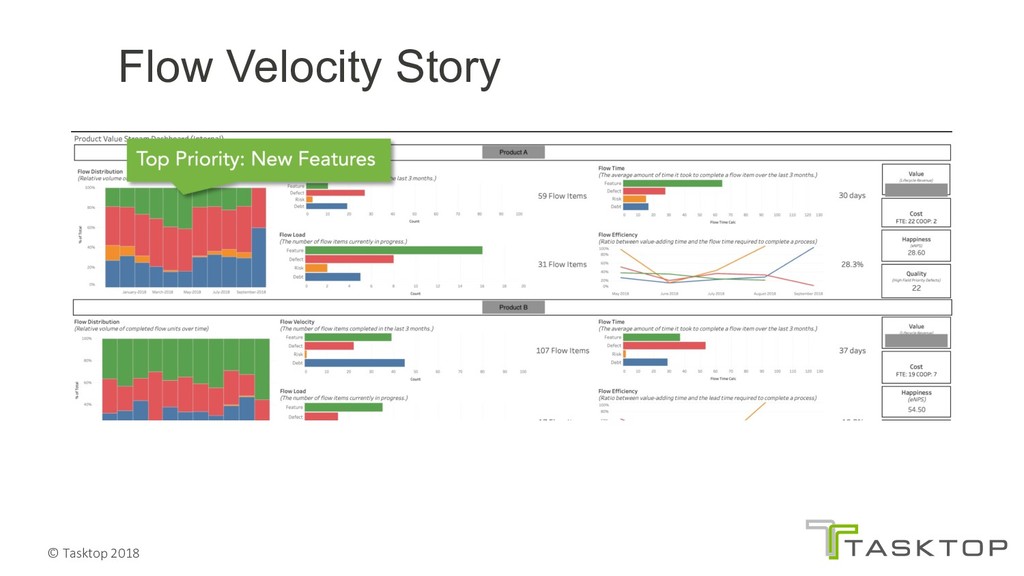
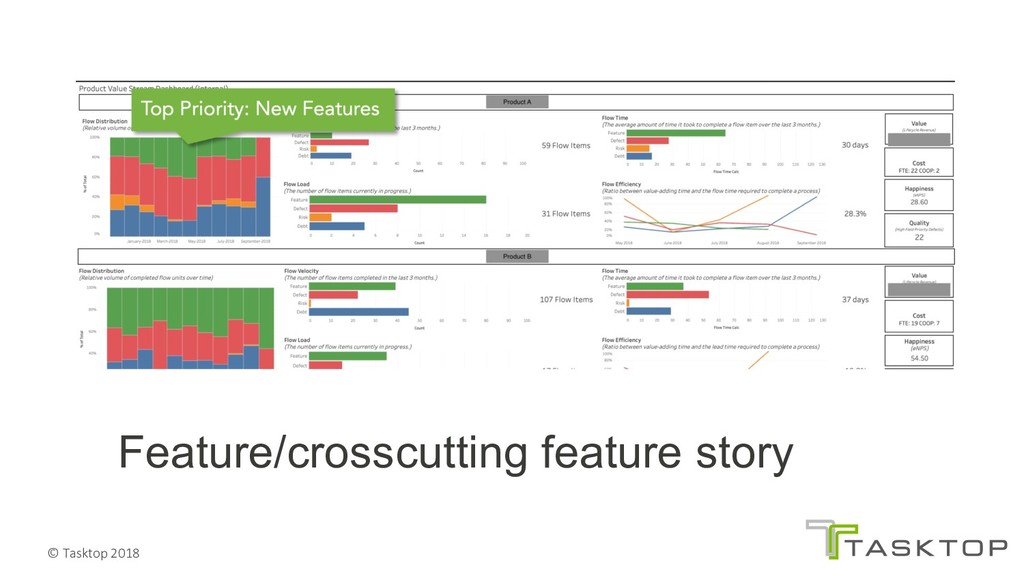
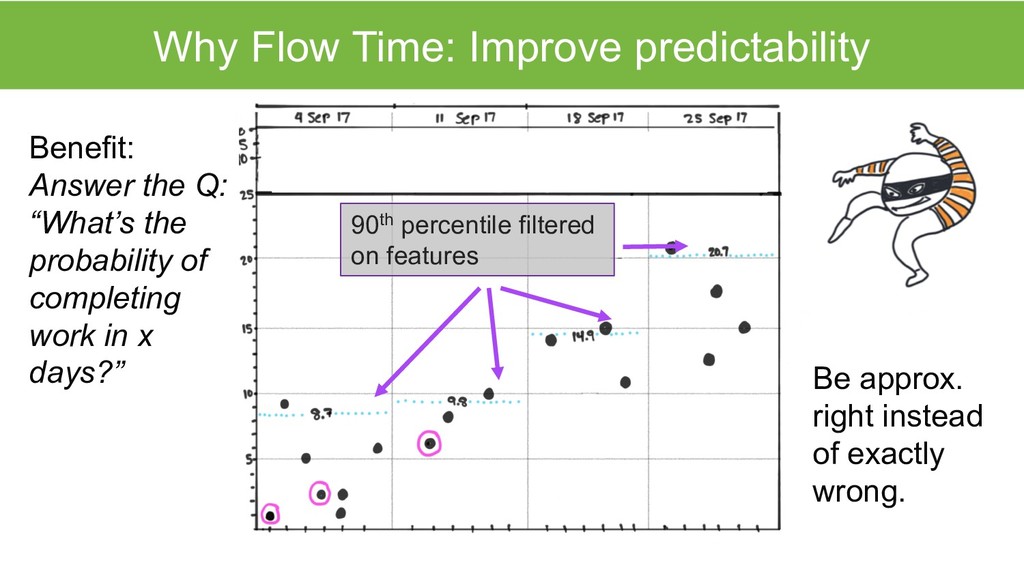
    tradeoffs v Flow Velocity: A measure of throughput/productivity v Flow Load: Amount of Work-in-Progress (WIP) v Flow Time: A measure of speed v Flow Efficiency: Work vs. wait ratio 5FLOW METRICS: Why, How, + considerations
  4. © Tasktop 2018 Why Flow Distribution: Visualize the tradeoffs A

    decision to do one thing is a decision to delay something else. Provoke necessary discussion on priorities. Balance work types based on biz strategy.
  5. © Tasktop 2018 Look at Flow time Why Flow Velocity:

    Improve estimates & forecasting Flow Velocity: The number of items completed during a given time frame.
  6. © Tasktop 2018 Why Flow Load: WIP is a leading

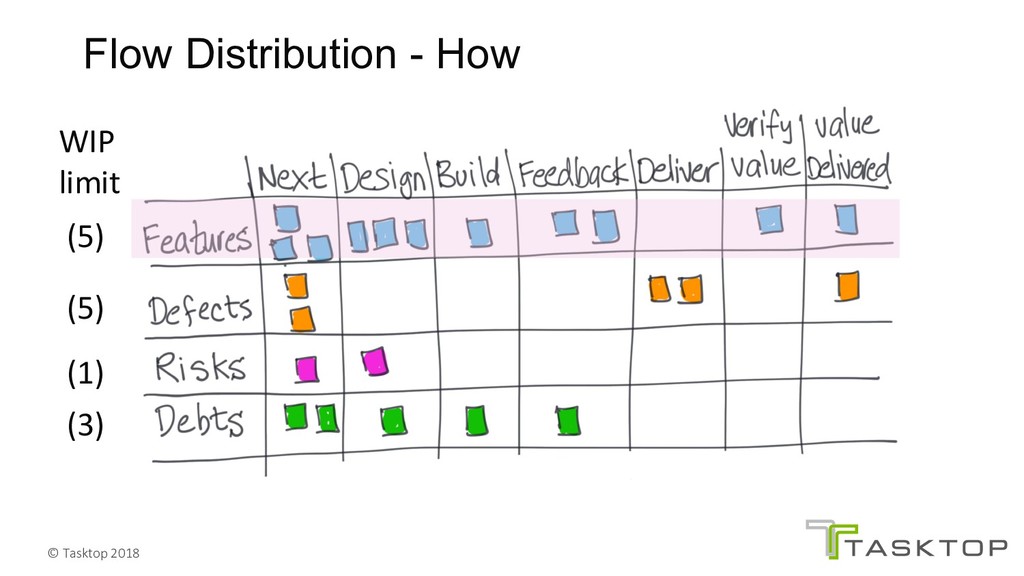
    indicator Flow Load: All the partially completed work. All the work-in-progress (WIP) in the value stream Benefit: Provokes convo’s on WIP limits that act as enabling constraint.
  7. © Tasktop 2018 Dominica DeGrandis Thief Too much Work-in-progress (WIP)

    High WIP means that other items sit waiting for service longer. The single most important factor that affects queue size is capacity utilization.
  8. © Tasktop 2018 Dominica DeGrandis Thief Too much Work-in-progress (WIP)

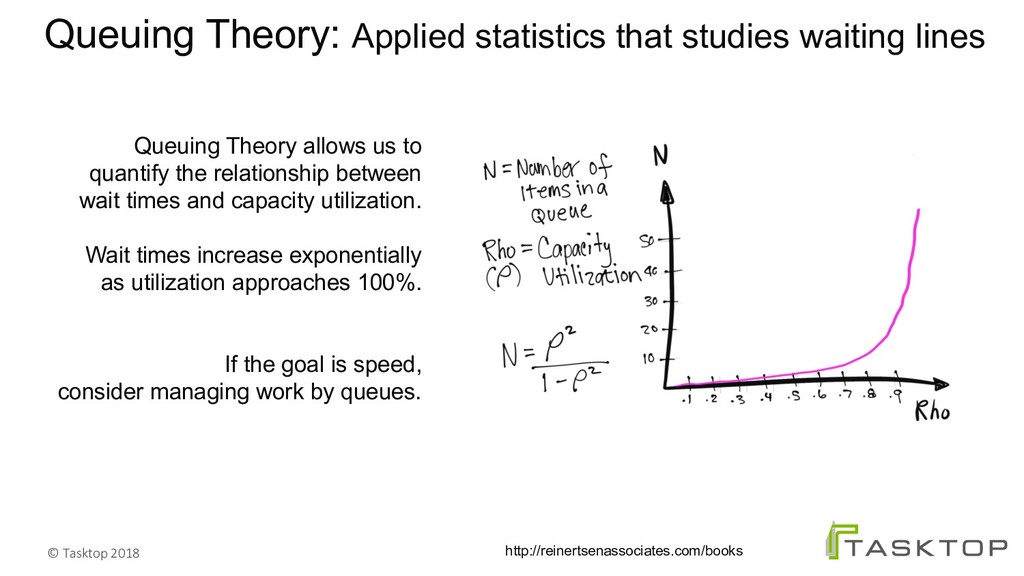
    Queuing Theory allows us to quantify the relationship between wait times and capacity utilization. Wait times increase exponentially as utilization approaches 100%. Queuing Theory: Applied statistics that studies waiting lines If the goal is speed, consider managing work by queues. http://reinertsenassociates.com/books/
  9. © Tasktop 2018 90th percentile filtered on features Benefit: Answer

    the Q: “What’s the probability of completing work in x days?” Why Flow Time: Improve predictability Be approx. right instead of exactly wrong.
  10. © Tasktop 2018 Flow Time – How Yes, let’s do

    this! Flow Time: The duration from when work enters the value stream to its completion.
  11. © Tasktop 2018 Flow Efficiency: The percentage of time where

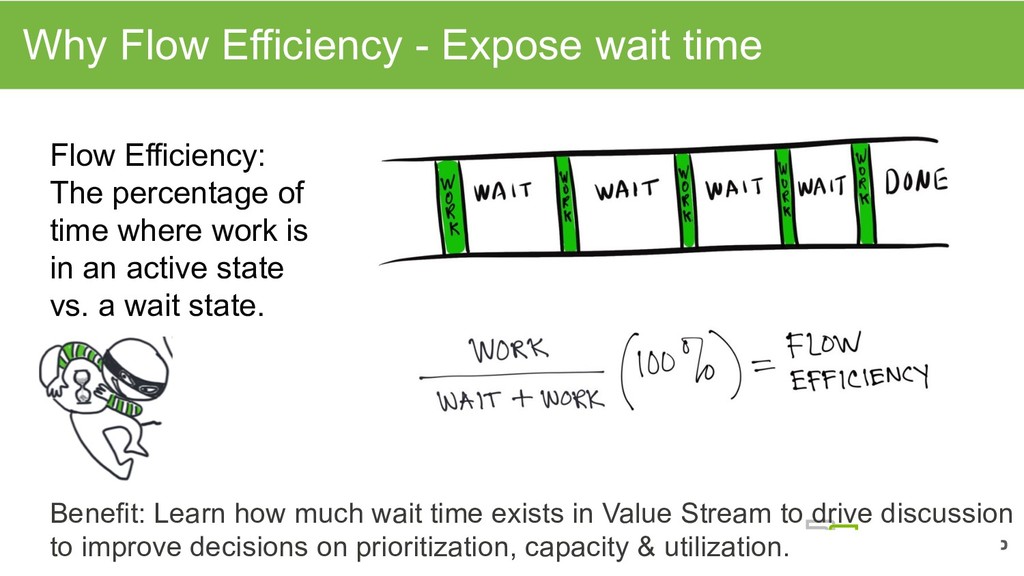
    work is in an active state vs. a wait state. Why Flow Efficiency - Expose wait time Benefit: Learn how much wait time exists in Value Stream to drive discussion to improve decisions on prioritization, capacity & utilization.
  12. © Tasktop 2018 TAKEAWAYS & BENEFITS • Flow metrics are

    tied to business value • Flow metrics are based on outcomes • Flow metrics provide a feedback loop to improve decisions
  13. © Tasktop 2018 How to Get started with Flow Metrics

    Start capturing 1 artifact, 1 VS and 1 metric (Flow Time)