Upgrade to Pro — share decks privately, control downloads, hide ads and more …

Factors for Consideration in Learning Analytics; An Investigation into Student Activity on an MLE (Updated for 2016)

Factors for Consideration in Learning Analytics; An Investigation into Student Activity on an MLE (Updated for 2016)

Presented at Keele Learning and Teaching Conference 2016 #KALTC16
https://www.keele.ac.uk/lpdc/learningteaching/keelelearningandteachingconference/

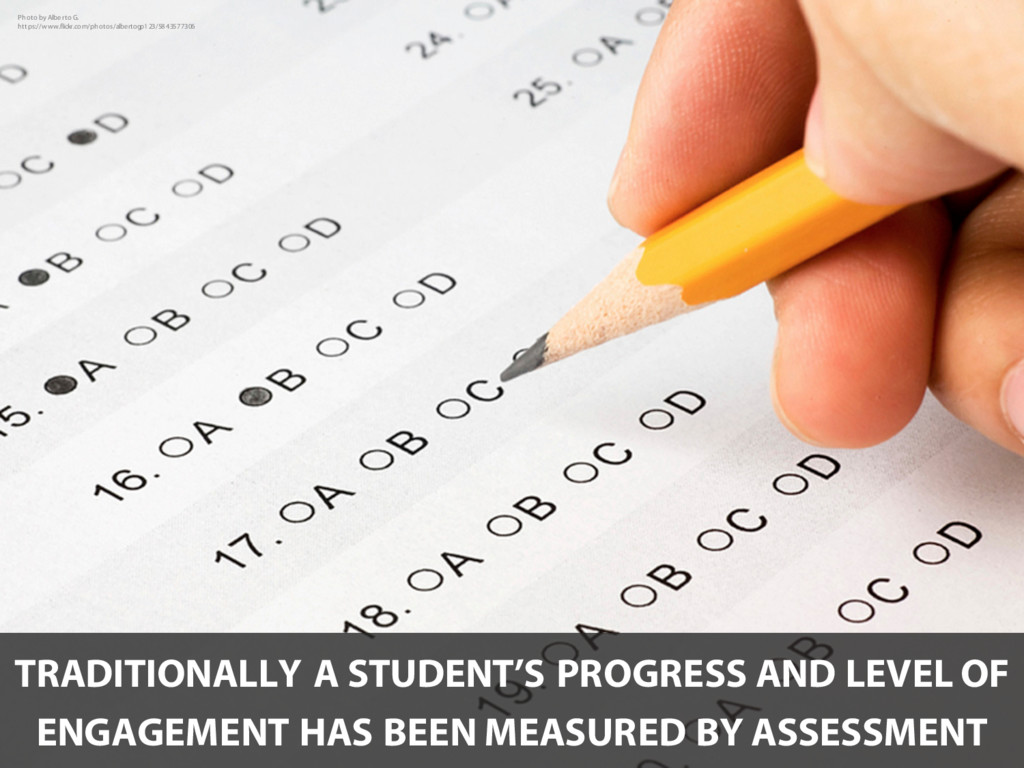
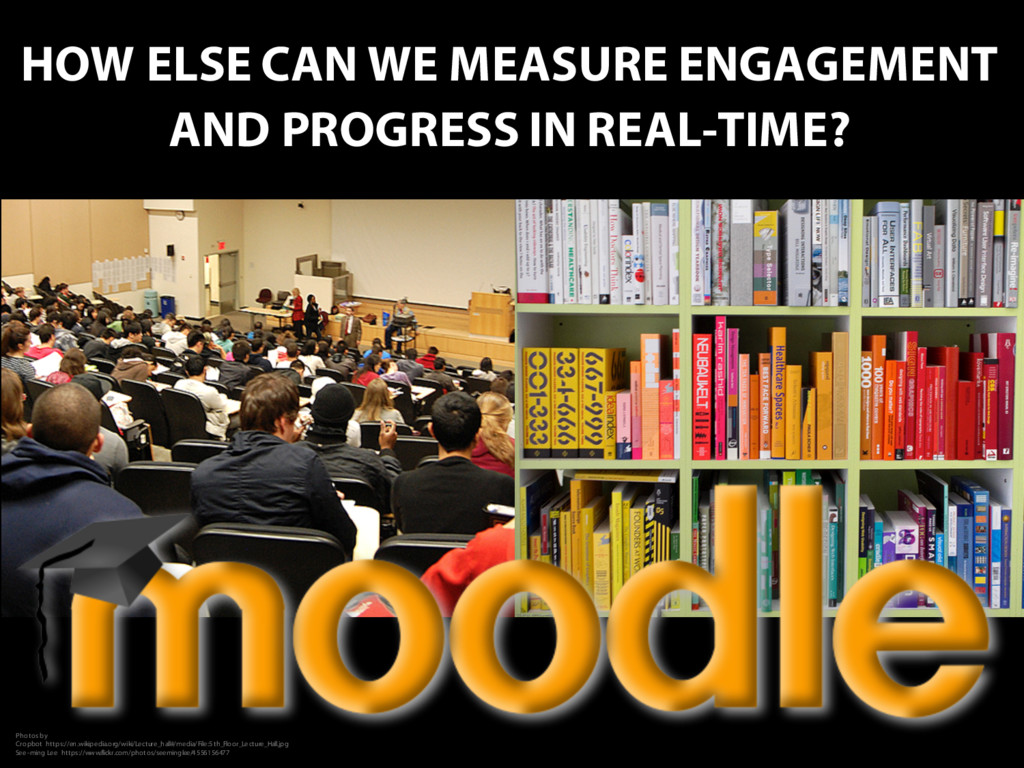
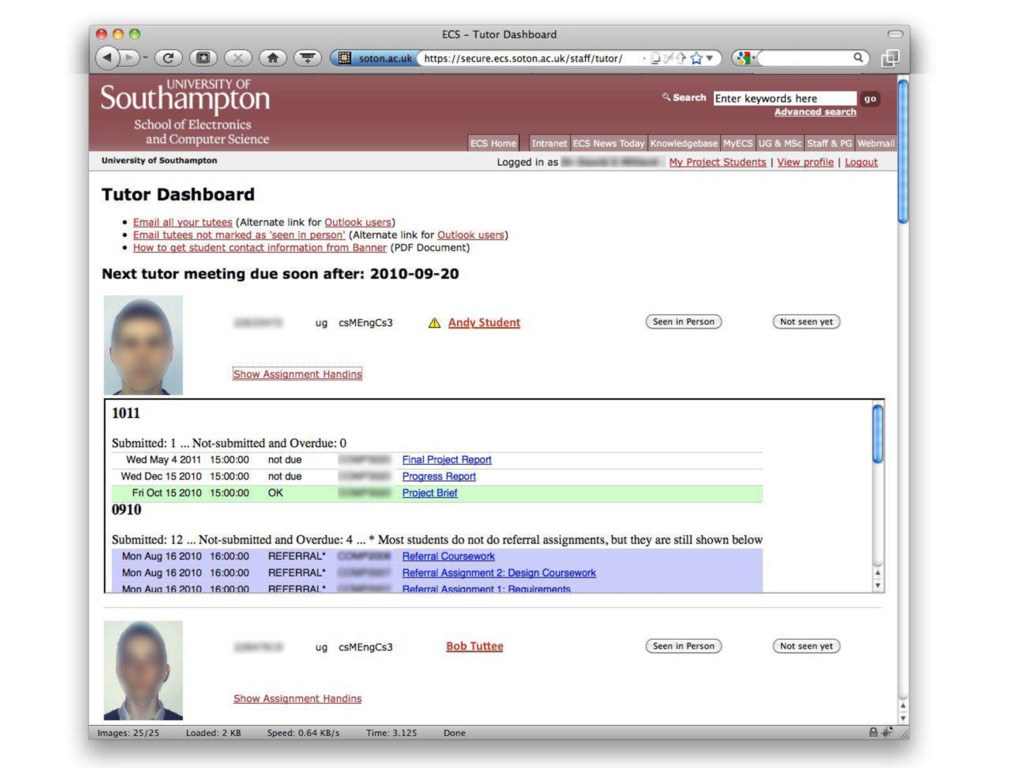
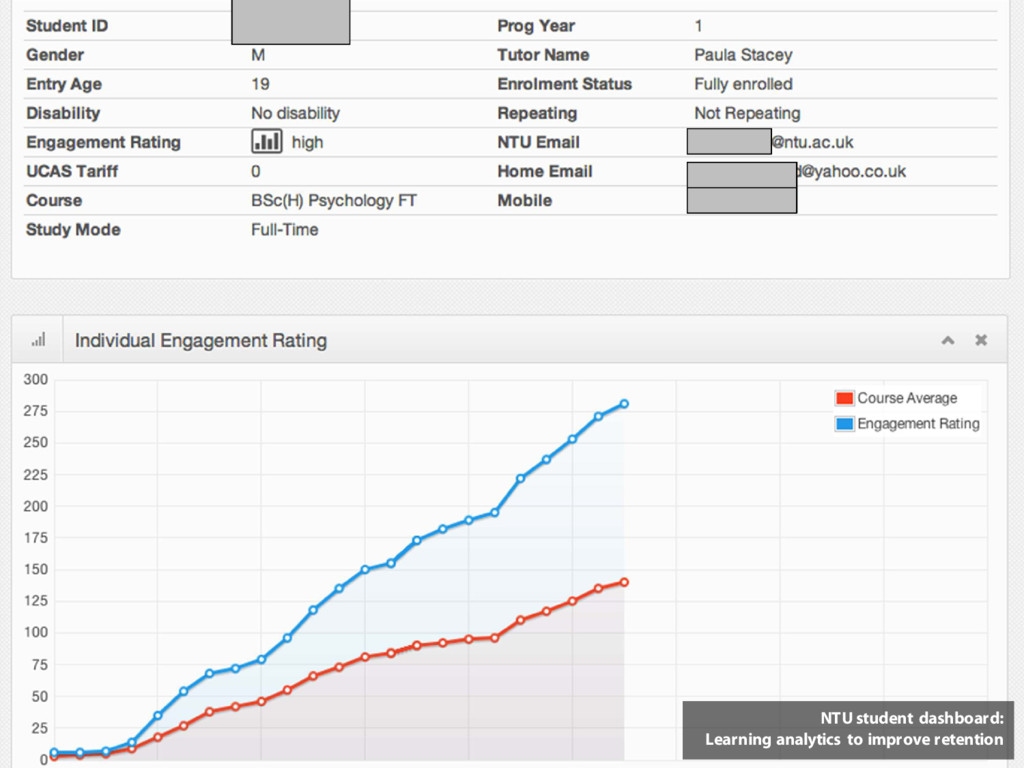
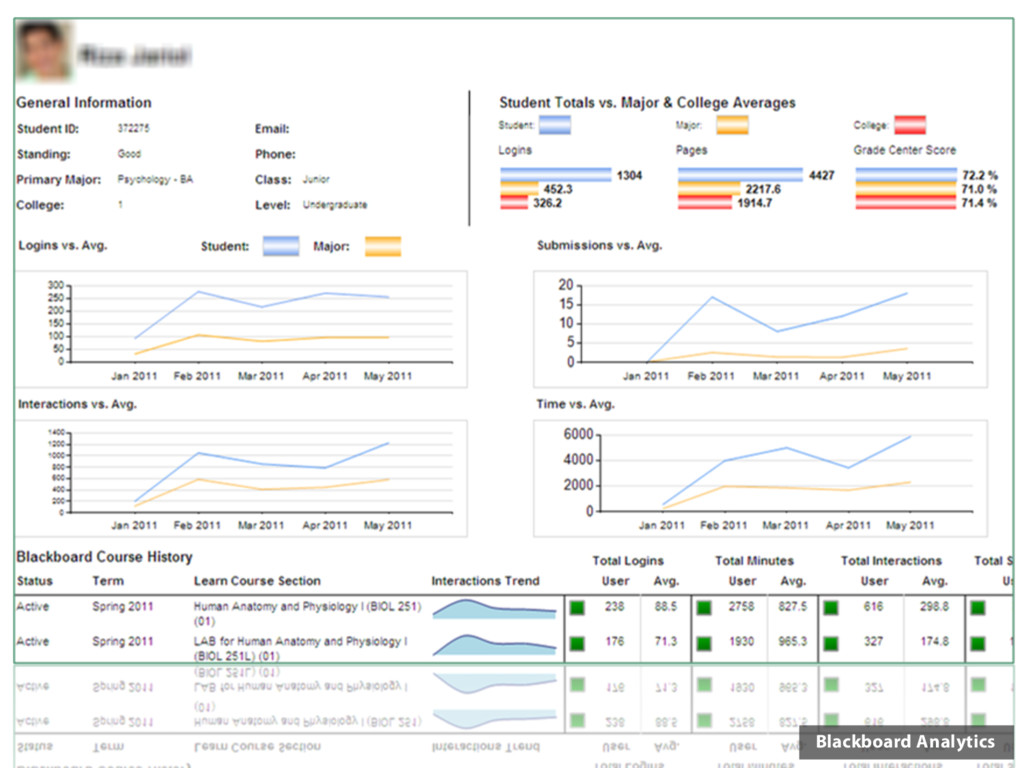
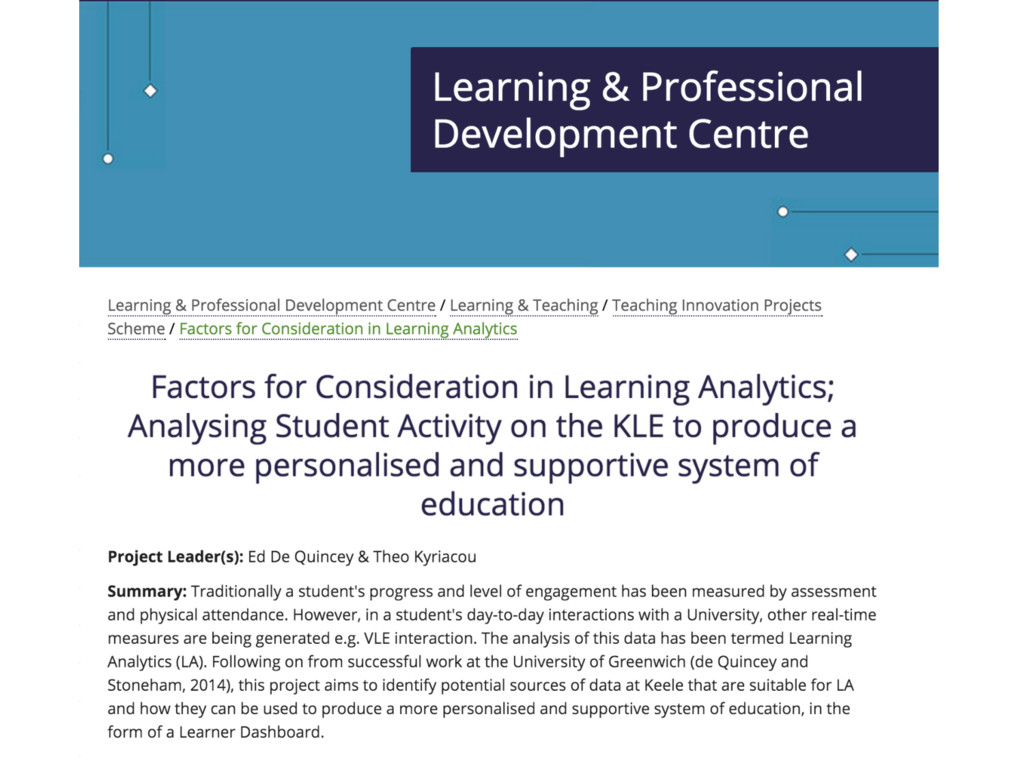
Traditionally a student’s progress and engagement have been measured by assessment and attendance. However, in a student’s day-to-day interactions with a University, other real-time measures are being generated e.g. VLE interaction, Library usage etc., with HE now gathering an “astonishing array of data about its ‘customers’” (Siemens & Long, 2011).

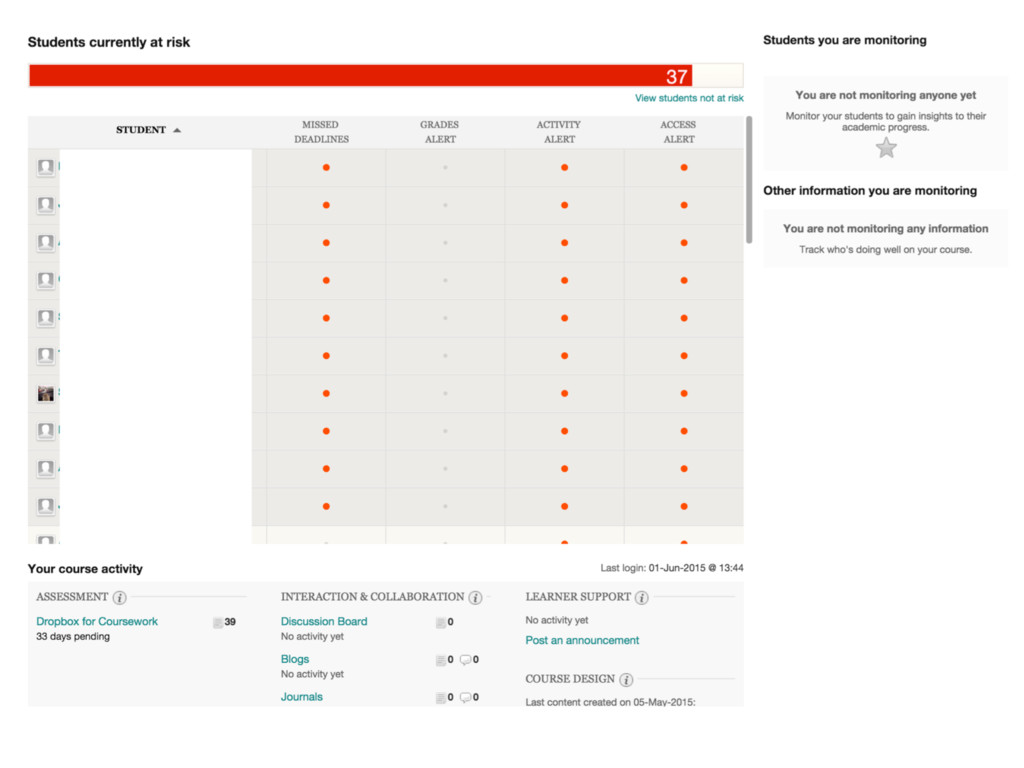
The analysis of this data has been termed Learning Analytics (LA) (Johnson et al., 2013) and has the potential to identify at-risk learners and provide intervention to assist learners in achieving success (Macfadyen & Dawson, 2010).

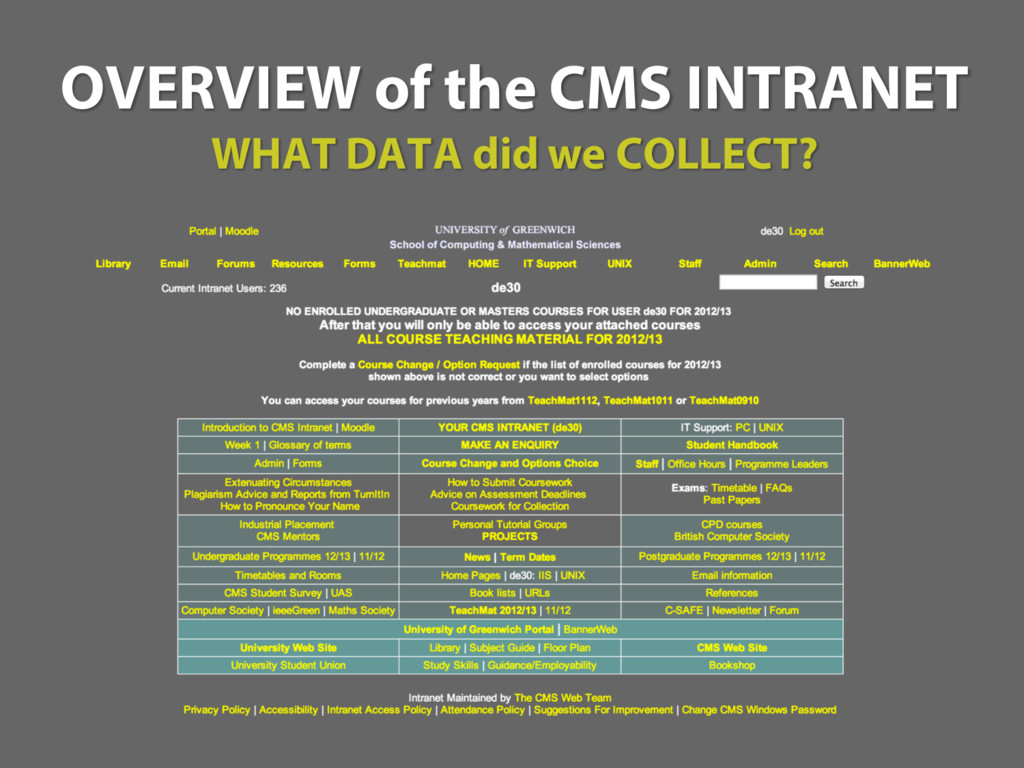
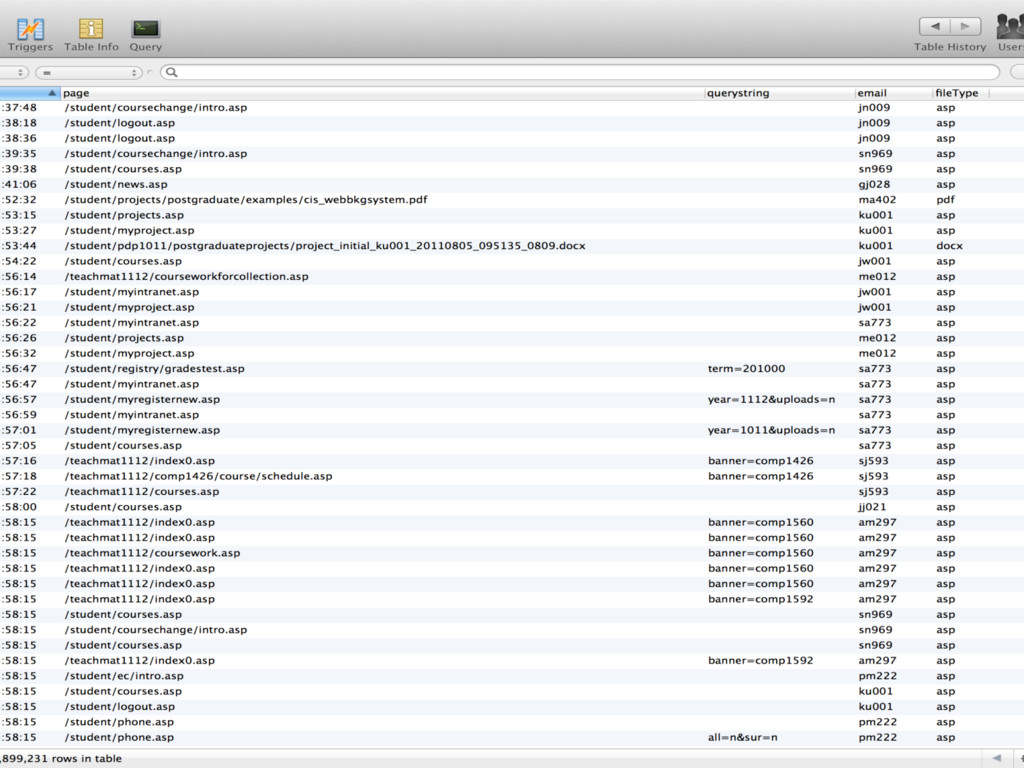
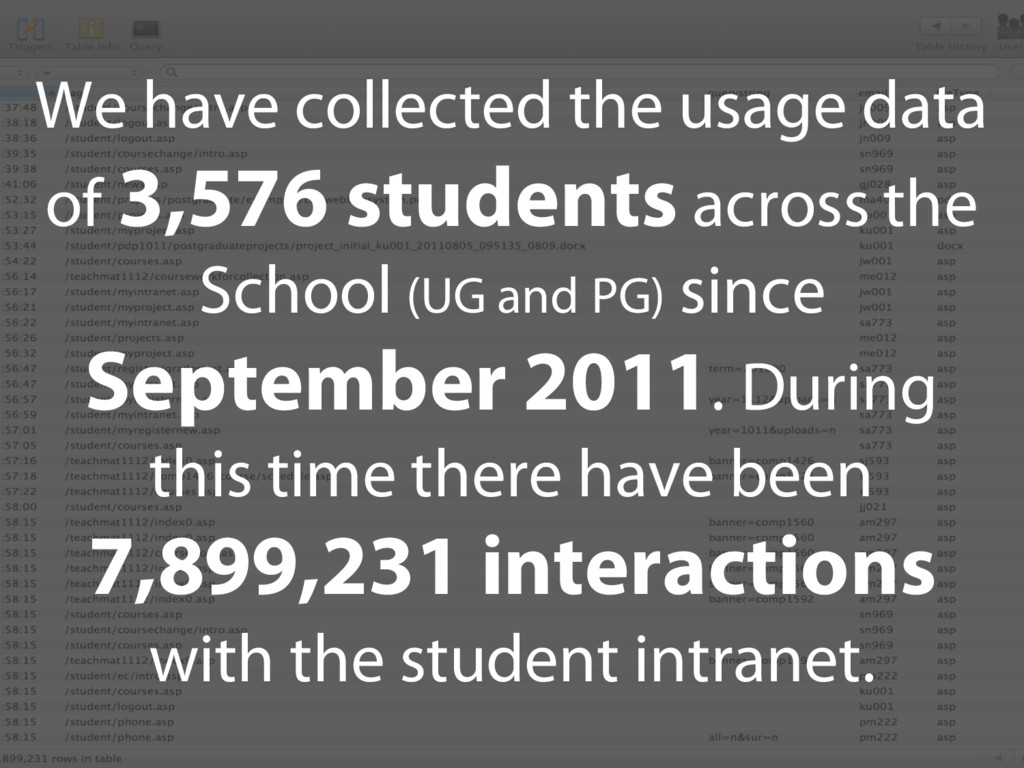
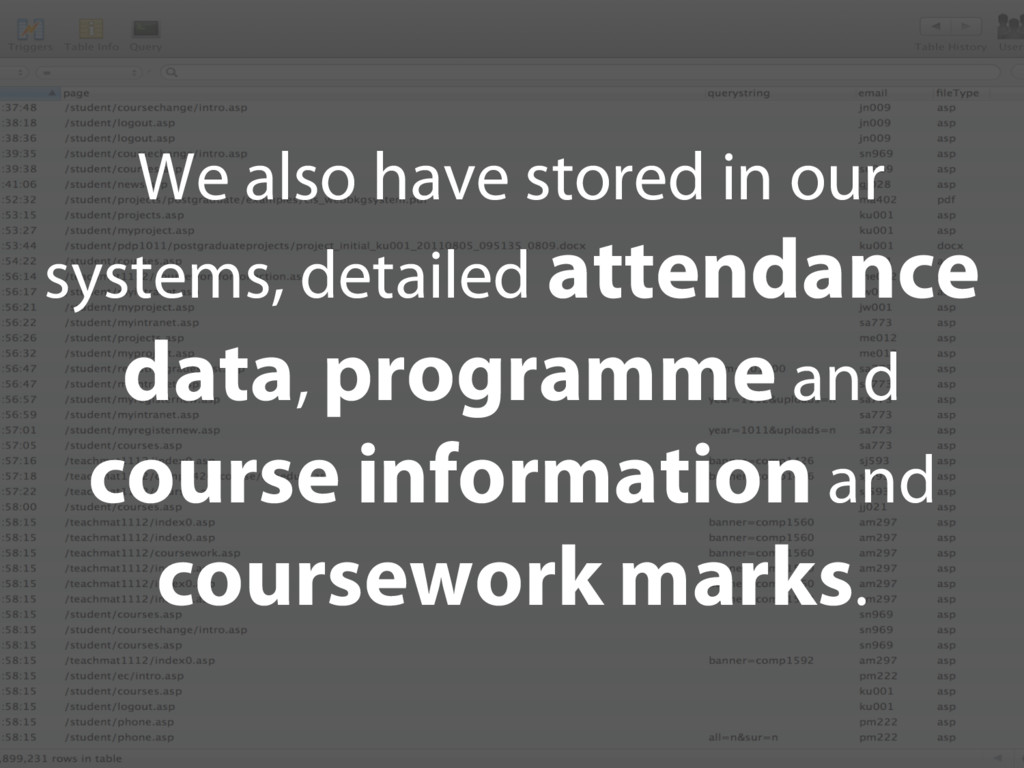
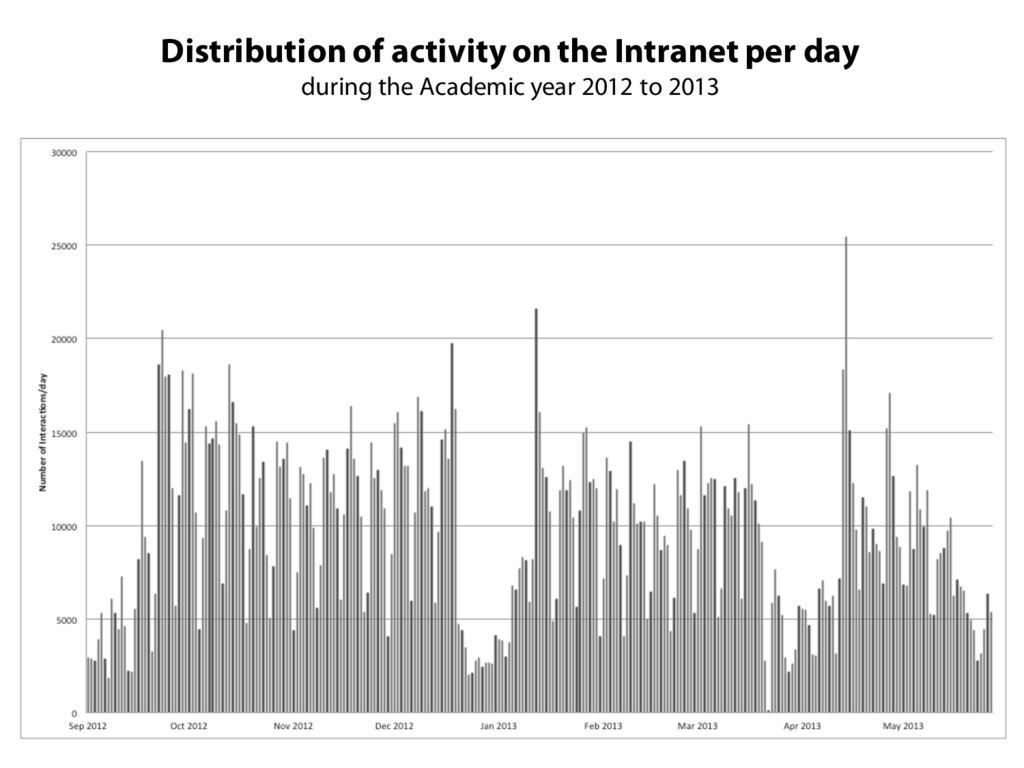
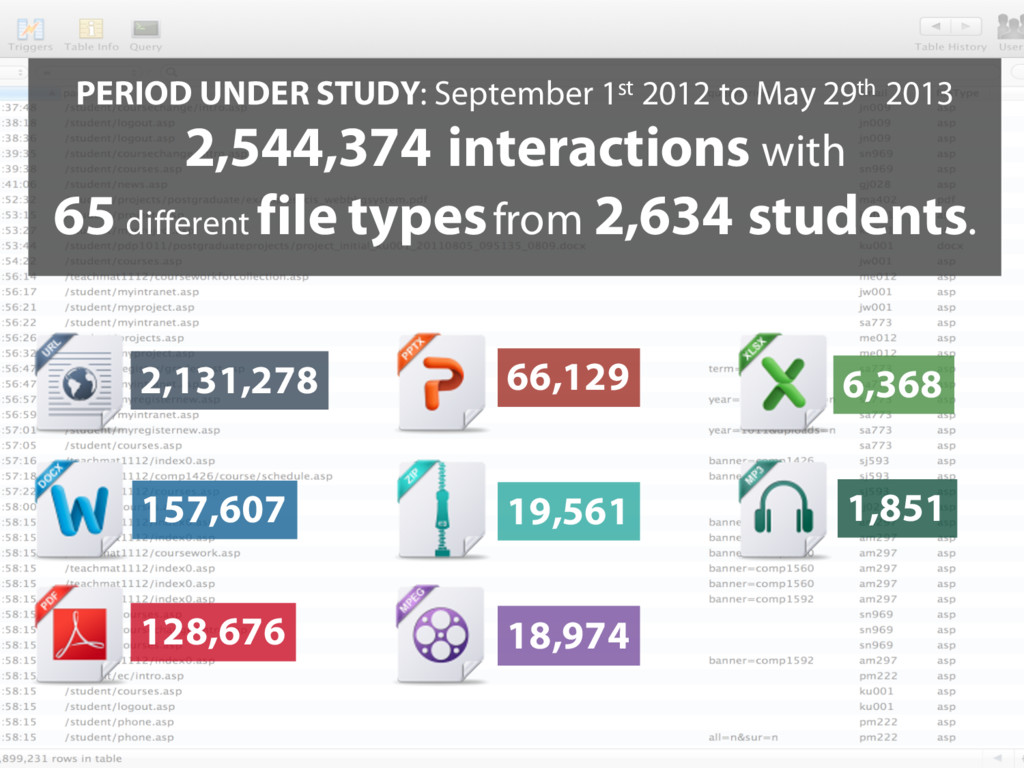
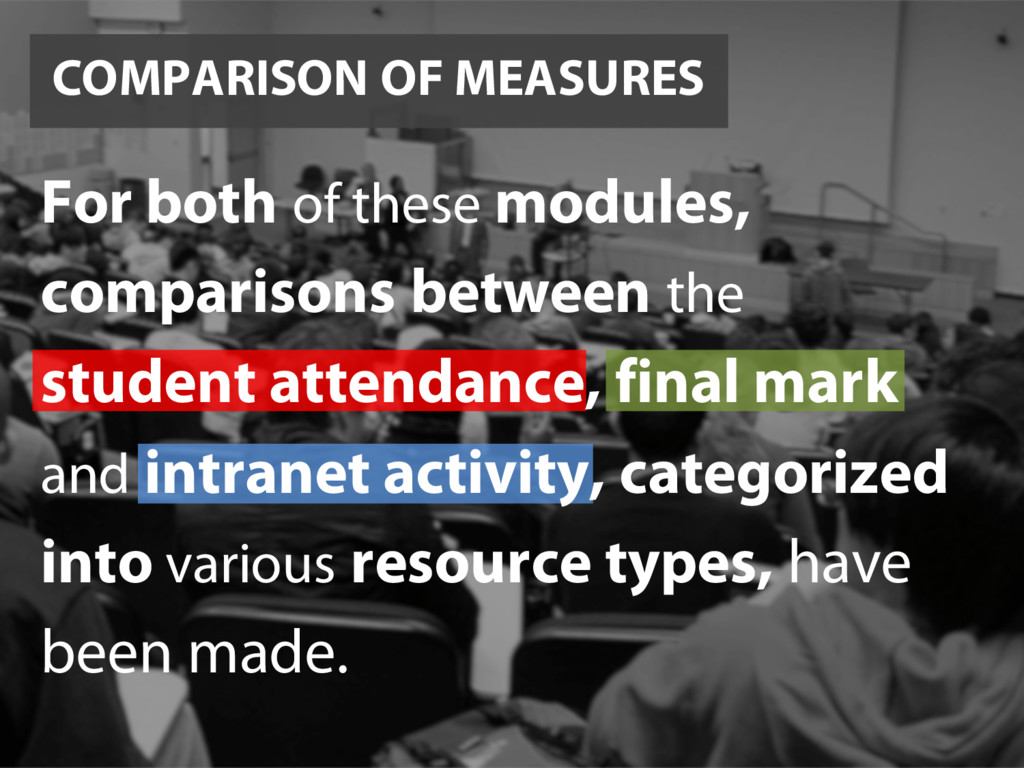
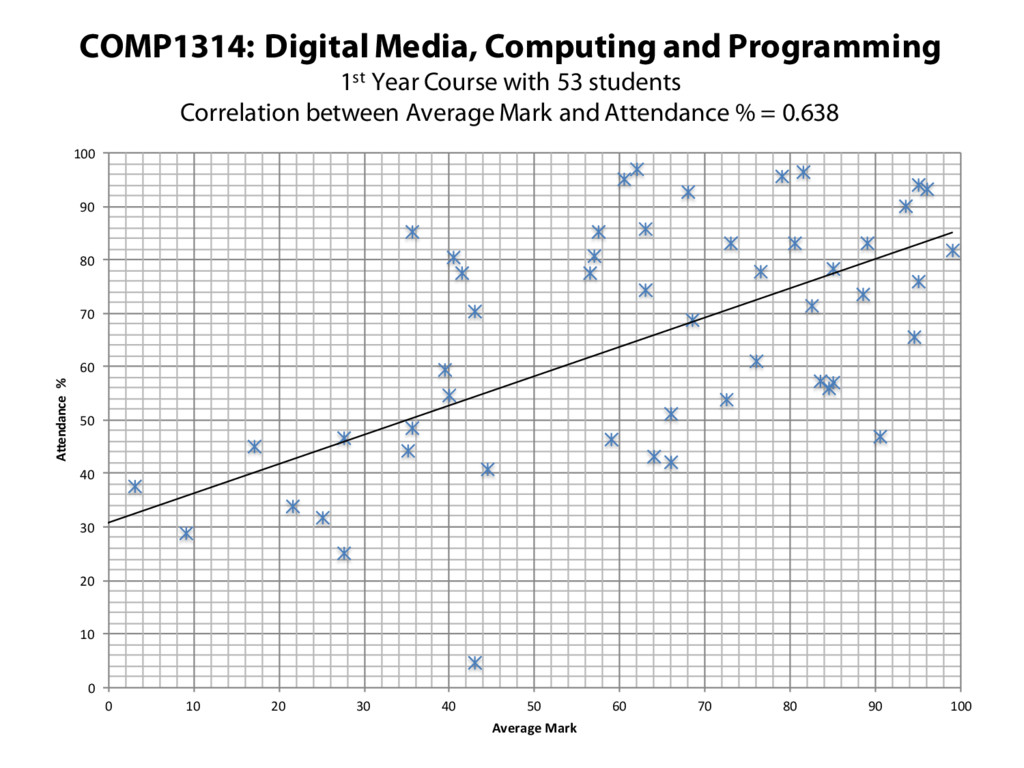
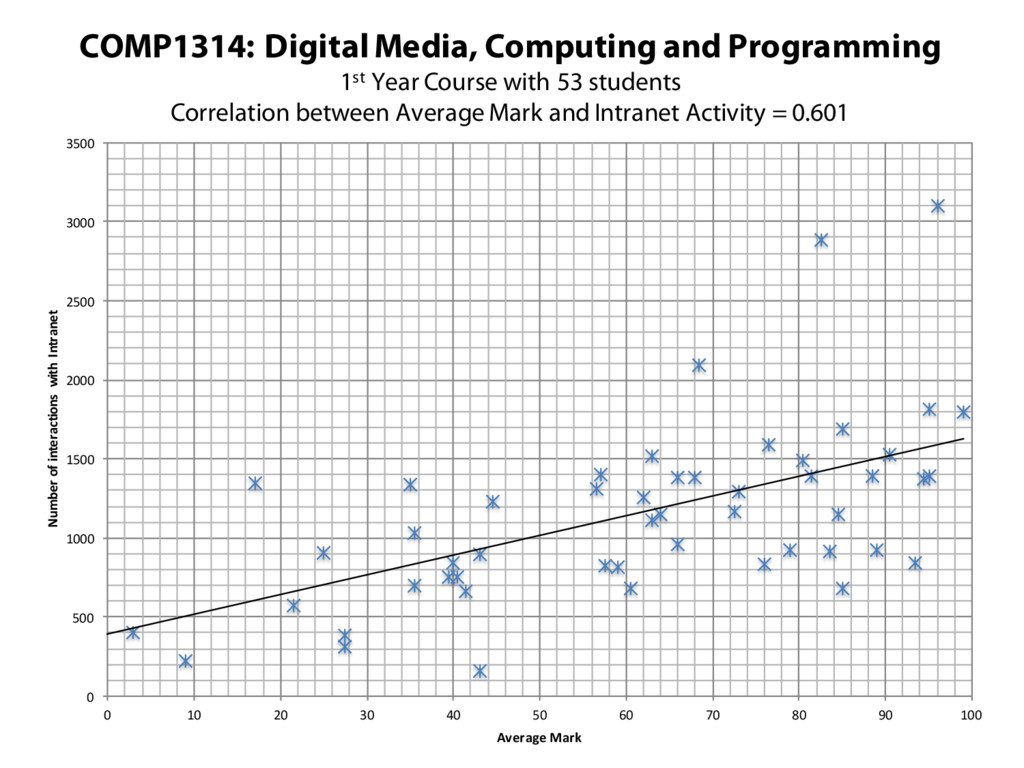
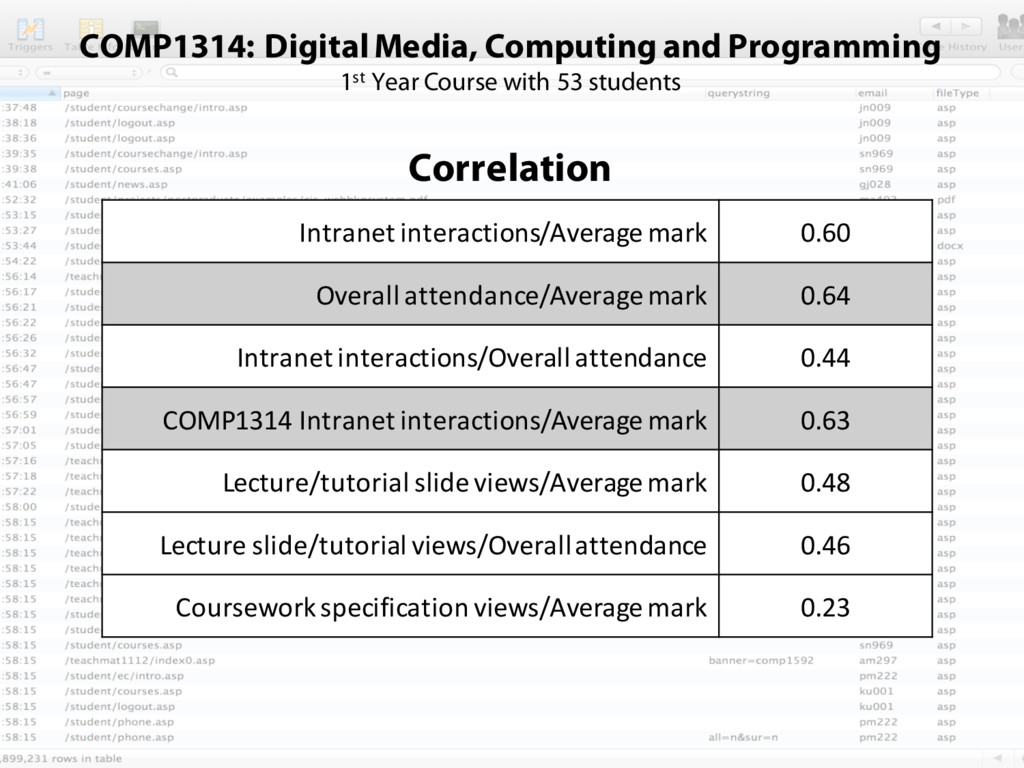
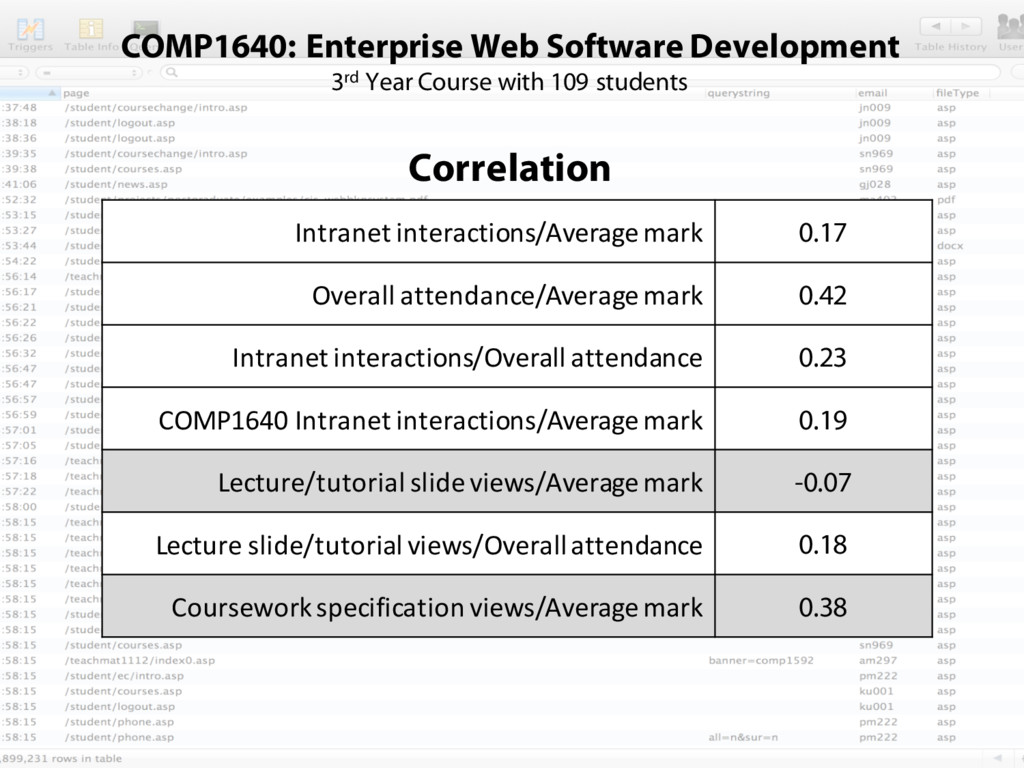
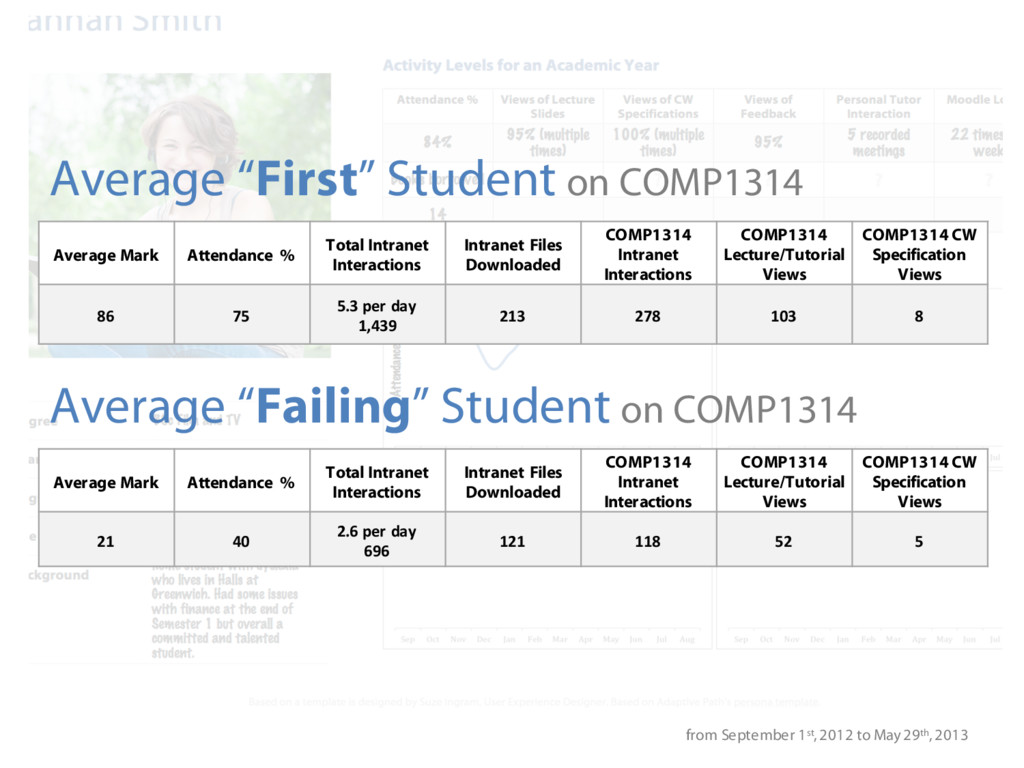
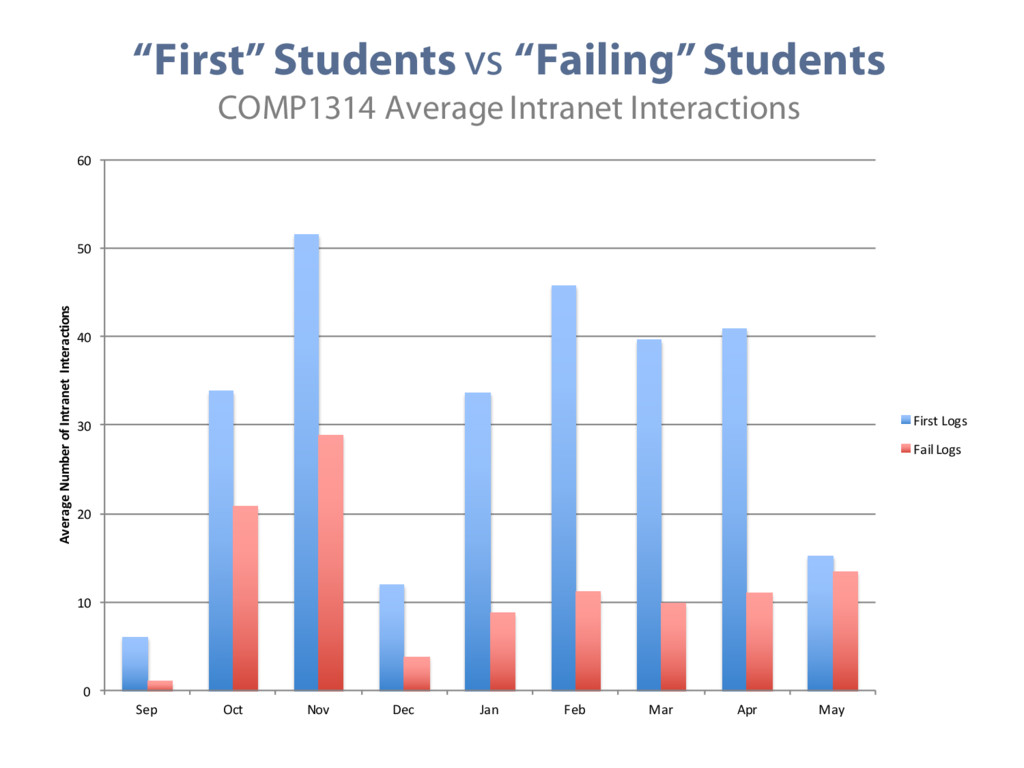
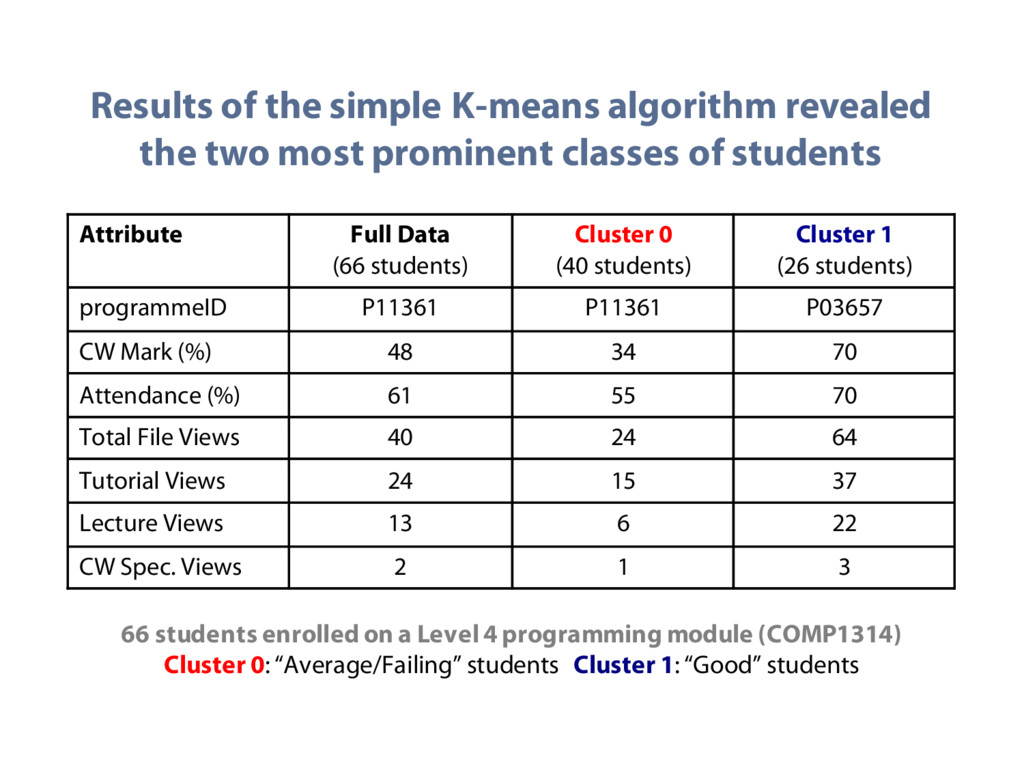
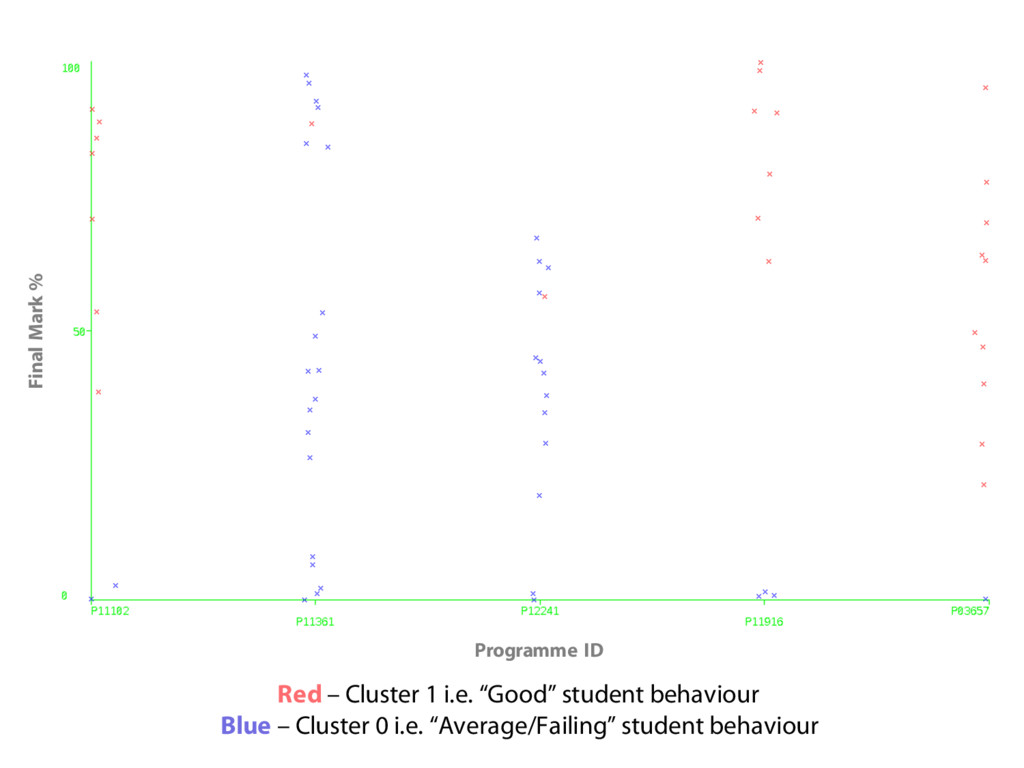
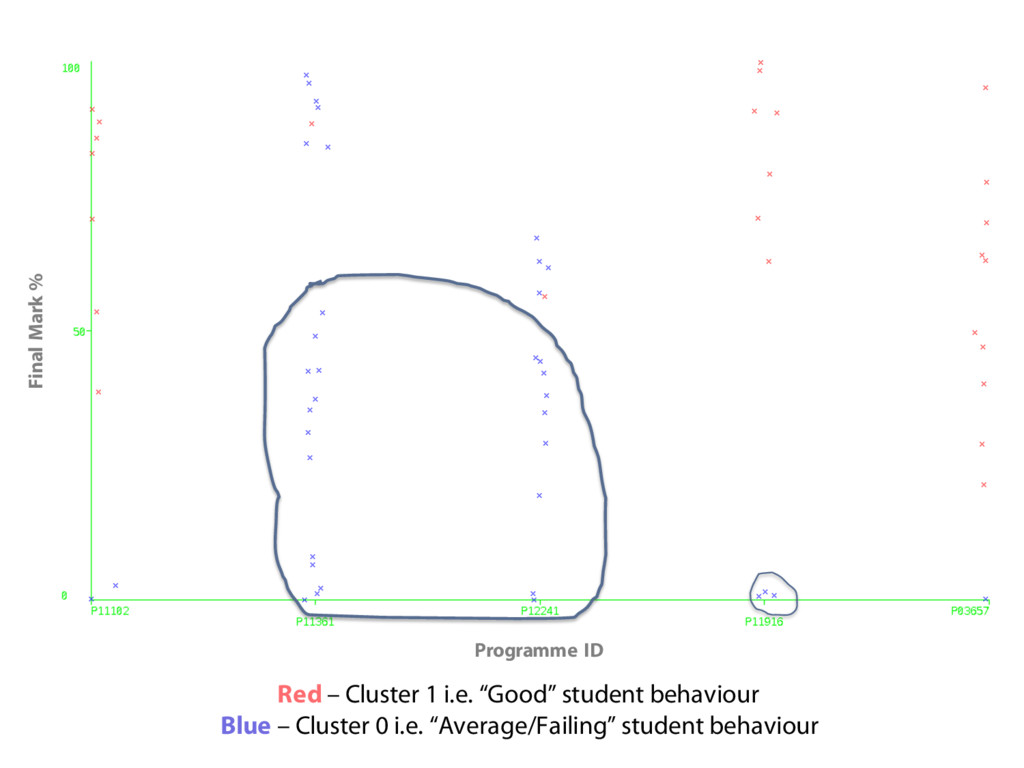
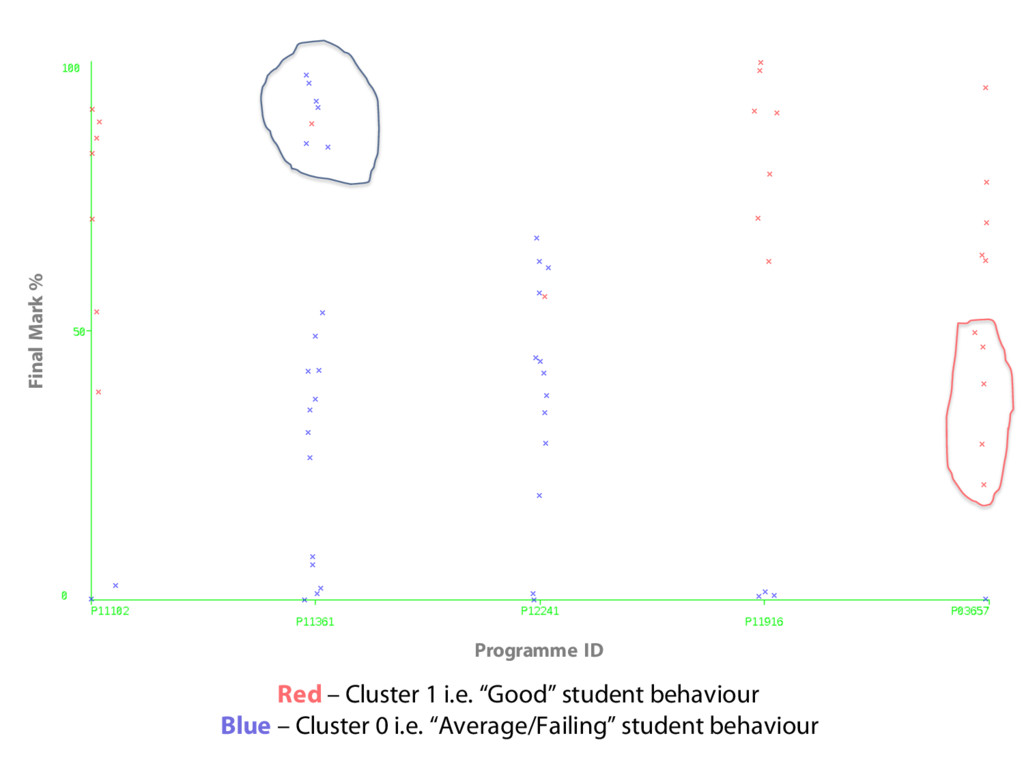
This presentation will include a statistical analysis of the usage data of a bespoke Managed Learning Environment (MLE). Server log data generated by 2,634 students has been collected with 2,544,374 interactions being recorded. Previous analysis (de Quincey and Stoneham, 2013) has suggested significant correlations between pairs of attributes such as views of lecture materials and final coursework mark. A clustering algorithm has now been applied to a subset of the data in order to identify the behaviours of the most prominent clusters of students. These characteristics will be discussed along with exceptions to the expected behaviours of successful students. Implications for LA usage at Keele will also be considered and initial findings from an ongoing TIPs funded project into LA.

Ed de Quincey

January 19, 2016
Tweet

More Decks by Ed de Quincey

Other Decks in Education

Transcript

  1. Factors for Consideration in Learning
    Analytics; An Investigation into Student
    Activity on an MLE
    Dr Ed de Quincey & Dr Theo Kyriacou, Keele University
    Many thanks to Dr Ray Stoneham, University of Greenwich Photo by GotCredit
    www.gotcredit.com

    View Slide

  2. Dr Ed de Quincey @eddequincey
    Postgraduate Course Director
    School of Computing and Mathematics, KeeleUniversity
    Lead of the Software Engineering Research Cluster
    instagram.com/eddequincey

    View Slide

  3. Dr Ed de Quincey @eddequincey
    Principal Lecturer
    School of Computing and Mathematical Science, University of Greenwich
    Head of the Web 2.0/Social Web for Learning Research Group, eCentre
    instagram.com/eddequincey

    View Slide

  4. TRADITIONALLY A STUDENT’S PROGRESS AND LEVEL OF
    ENGAGEMENT HAS BEEN MEASURED BY ASSESSMENT
    Photo by Alberto G.
    https://www.flickr.com/photos/albertogp123/5843577306

    View Slide

  5. HOW ELSE CAN WE MEASURE ENGAGEMENT
    AND PROGRESS IN REAL-TIME?
    Photos by
    Cropbot https://en.wikipedia.org/wiki/Lecture_hall#/media/File:5th_Floor_Lecture_Hall.jpg
    See-ming Lee https://www.flickr.com/photos/seeminglee/4556156477

    View Slide

  6. Learning Analytics
    has been defined as a method for
    “deciphering trends
    and patterns from
    educational big data
    … to further the
    advancement of a
    personalized,
    supportive system
    of higher education.”
    (Johnson et al., 2013)
    Co-authorship network map of physicians publishing on hepatitis C (detail)
    Source: http://www.flickr.com/photos/speedoflife/82749 93170/

    View Slide

  7. View Slide

  8. NTU student dashboard:
    Learning analytics to improve retention

    View Slide

  9. Blackboard Analytics

    View Slide

  10. Blackboard Analytics

    View Slide

  11. Blackboard Analytics

    View Slide

  12. View Slide

  13. PRESENTING STUDENT DATA BACK TO STUDENTS and LECTURERS,
    USING USER CENTRIC QUERIES, FORMATS and METAPHORS

    View Slide

  14. OVERVIEW of the CMS INTRANET
    WHAT DATA did we COLLECT?

    View Slide

  15. View Slide

  16. View Slide

  17. We have collected the usage data
    of 3,576 students across the
    School (UG and PG) since
    September 2011. During
    this time there have been
    7,899,231 interactions
    with the student intranet.

    View Slide

  18. We also have stored in our
    systems, detailed attendance
    data, programme and
    course information and
    coursework marks.

    View Slide

  19. Distribution of activity on the Intranet per day
    during the Academic year 2012 to 2013

    View Slide

  20. PERIOD UNDER STUDY: September 1st 2012 to May 29th 2013
    2,544,374 interactions with
    65 different file typesfrom 2,634 students.
    2,131,278
    18,974
    157,607
    128,676
    6,368
    66,129
    1,851
    19,561

    View Slide

  21. COMPARISON OF MEASURES
    Two Computing Undergraduate modules:
    • A First year module: COMP1314 Digital Media,
    Computing and Programming
    • 30 credit introductory course assessed by 2
    pieces of coursework and an exam.
    • A Third year module: COMP1640 Enterprise
    Web Software Development
    • a 15 credit final year course assessed by a
    piece of group coursework.

    View Slide

  22. For both of these modules,
    comparisons between the
    student attendance, final mark
    and intranet activity, categorized
    into various resource types, have
    been made.
    COMPARISON OF MEASURES

    View Slide

  23. COMP1314: Digital Media, Computing and Programming
    1st Year Course with 53 students
    Correlation between Average Mark and Attendance % = 0.638
    0
    10
    20
    30
    40
    50
    60
    70
    80
    90
    100
    0 10 20 30 40 50 60 70 80 90 100
    Attendance %
    Average Mark

    View Slide

  24. COMP1314: Digital Media, Computing and Programming
    1st Year Course with 53 students
    Correlation between Average Mark and Intranet Activity = 0.601
    0
    500
    1000
    1500
    2000
    2500
    3000
    3500
    0 10 20 30 40 50 60 70 80 90 100
    Number of interactions with Intranet
    Average Mark

    View Slide

  25. COMP1314: Digital Media, Computing and Programming
    1st Year Course with 53 students
    Correlation
    Intranet interactions/Average mark 0.60
    Overall attendance/Average mark 0.64
    Intranet interactions/Overall attendance 0.44
    COMP1314 Intranet interactions/Average mark 0.63
    Lecture/tutorial slide views/Average mark 0.48
    Lecture slide/tutorial views/Overall attendance 0.46
    Coursework specification views/Average mark 0.23

    View Slide

  26. COMP1640: Enterprise Web Software Development
    3rd Year Course with 109 students
    Correlation
    Intranet interactions/Average mark 0.17
    Overall attendance/Average mark 0.42
    Intranet interactions/Overall attendance 0.23
    COMP1640 Intranet interactions/Average mark 0.19
    Lecture/tutorial slide views/Average mark -0.07
    Lecture slide/tutorial views/Overall attendance 0.18
    Coursework specification views/Average mark 0.38

    View Slide

  27. Average Mark Attendance %
    Total Intranet
    Interactions
    Intranet Files
    Downloaded
    COMP1314
    Intranet
    Interactions
    COMP1314
    Lecture/Tutorial
    Views
    COMP1314 CW
    Specification
    Views
    86 75
    5.3 per day
    1,439
    213 278 103 8
    Average “First” Student on COMP1314
    Average Mark Attendance %
    Total Intranet
    Interactions
    Intranet Files
    Downloaded
    COMP1314
    Intranet
    Interactions
    COMP1314
    Lecture/Tutorial
    Views
    COMP1314 CW
    Specification
    Views
    21 40
    2.6 per day
    696
    121 118 52 5
    Average “Failing” Student on COMP1314
    from September 1st, 2012 to May 29th, 2013

    View Slide

  28. “First” Students vs “Failing” Students
    COMP1314 Average Intranet Interactions
    0
    10
    20
    30
    40
    50
    60
    Sep Oct Nov Dec Jan Feb Mar Apr May
    Average Number of Intranet Interactions
    First Logs
    Fail Logs

    View Slide

  29. Attribute Full Data
    (66 students)
    Cluster 0
    (40 students)
    Cluster 1
    (26 students)
    programmeID P11361 P11361 P03657
    CW Mark (%) 48 34 70
    Attendance (%) 61 55 70
    Total File Views 40 24 64
    Tutorial Views 24 15 37
    Lecture Views 13 6 22
    CW Spec. Views 2 1 3
    66 students enrolled on a Level 4 programming module (COMP1314)
    Cluster 0: “Average/Failing” students Cluster 1: “Good” students
    Results of the simple K-means algorithm revealed
    the two most prominent classes of students

    View Slide

  30. Final Mark %
    Programme ID
    Red – Cluster 1 i.e. “Good” student behaviour
    Blue – Cluster 0 i.e. “Average/Failing” student behaviour

    View Slide

  31. Final Mark %
    Programme ID
    Red – Cluster 1 i.e. “Good” student behaviour
    Blue – Cluster 0 i.e. “Average/Failing” student behaviour

    View Slide

  32. Final Mark %
    Programme ID
    Red – Cluster 1 i.e. “Good” student behaviour
    Blue – Cluster 0 i.e. “Average/Failing” student behaviour

    View Slide

  33. Final Mark %
    Programme ID
    Red – Cluster 1 i.e. “Good” student behaviour
    Blue – Cluster 0 i.e. “Average/Failing” student behaviour

    View Slide

  34. View Slide

  35. WP1. KLE Data Review
    A review of activity log data that are
    currently available via the KLE.


    View Slide


  36. View Slide

  37. WP1. KLE Data Review
    A review of activity log data that are
    currently available via the KLE.


    Around 10 “reports” available
    Inconsistent formats
    Reports take a long time to run
    No way to bulk download all “raw” data
    Single Course User Participation Report is the most
    useful BUT have to run for each student

    View Slide

  38. WP1. KLE Data Review (and WP2. LA Pilot Study)
    A set of log files, generated from
    previous KLE module activity.


    Data Persistence
    Logs deleted after 6 months
    Data Protection/Usage Policy
    Current policies do not cover usage for Learning
    Analytics

    View Slide

  39. Identified and Reviewed 18 Learning Analytics “Dashboards”
    No student facing systems found

    View Slide

  40. WP3. Requirements Gathering
    Set as Coursework Case Study
    Undertaking Contextual Interviews with staff
    2nd Year Computing Module
    84 students in 14 groups
    Currently analysing data
    Asked questions as they complete tasks on the KLE
    2 completed

    View Slide

  41. WP3. Requirements Gathering
    Undertaking Contextual Interviews with staff
    • Accesses does not necessarily mean engagement.
    • Only interested in low values e.g. not accessed for a long time.
    • Current inaccurate Dashboard and the Retention Centre alerts
    makes people feel less trustful of the data.
    • Information in current reports interestingrather than being
    useful.
    • Comparison against average values (for a module/class) is
    important as it provides context to the data, otherwise it is
    not clear what is 'good' or 'bad'.
    • The reports need to be easy and quick to run/use.

    View Slide

  42. WP4. Implementation of Prototype LA Dashboard
    WP5. Pilot Study into uses of LA Dashboard within a Module
    Developing “Bookmarklet” to produce last access and files not viewed reports

    View Slide

  43. Good morning
    class…
    Do you prefer lecturing in the dark?

    View Slide