Upgrade to Pro — share decks privately, control downloads, hide ads and more …

Architecting for Sustainability

Avatar for Eoin Woods Eoin Woods
November 08, 2025

Architecting for Sustainability

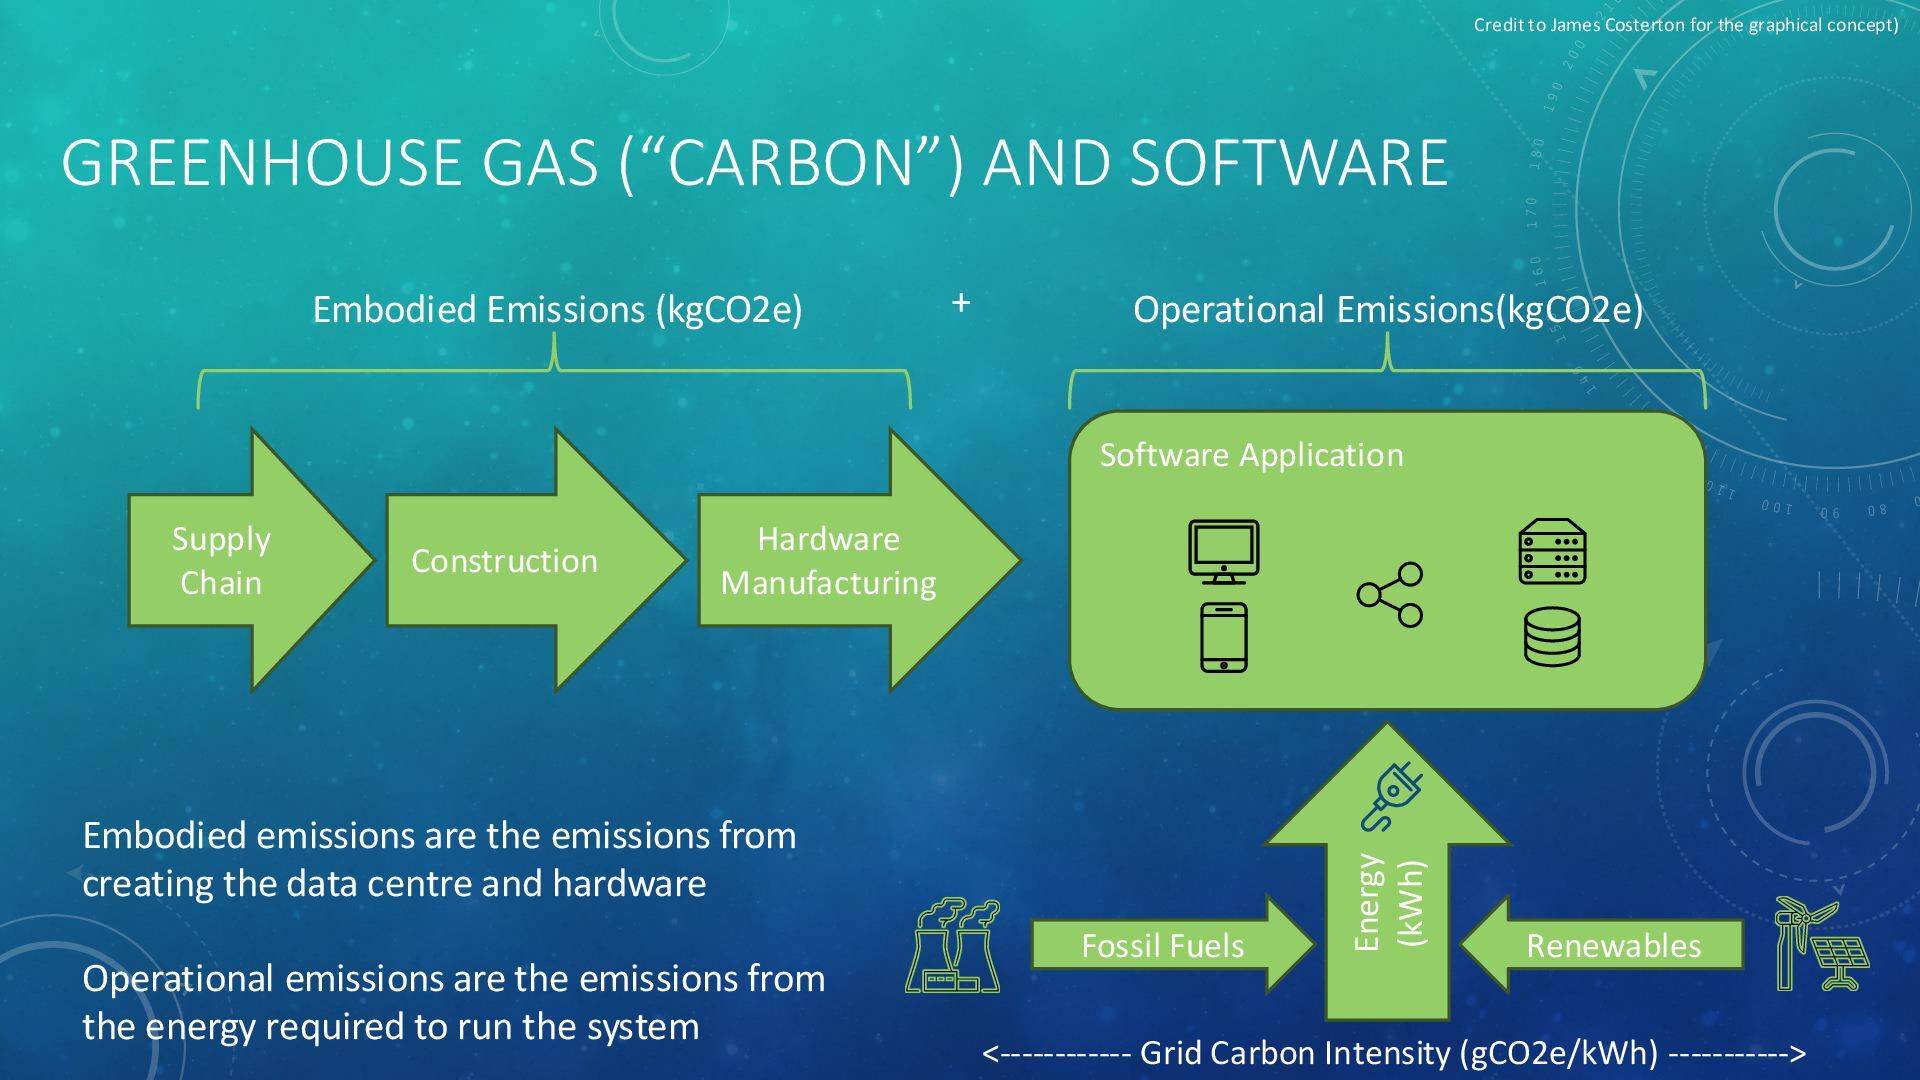
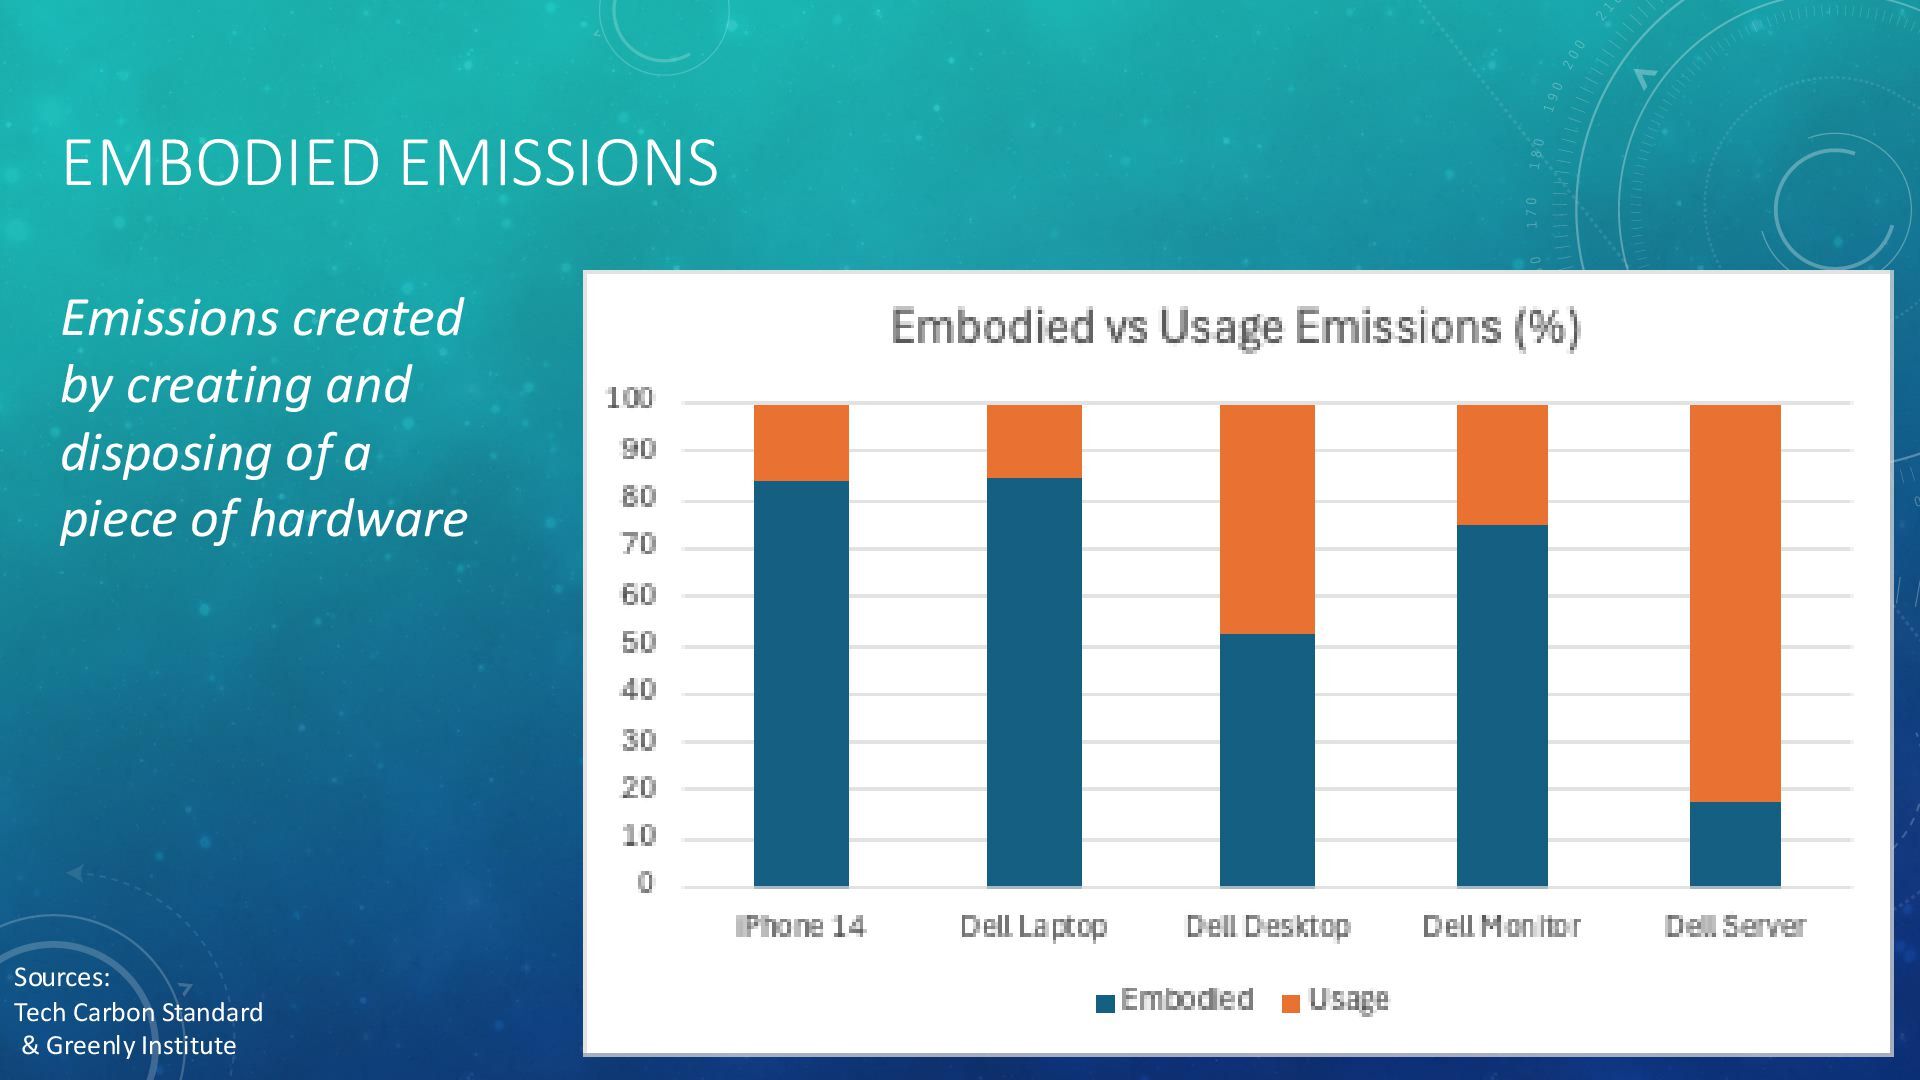
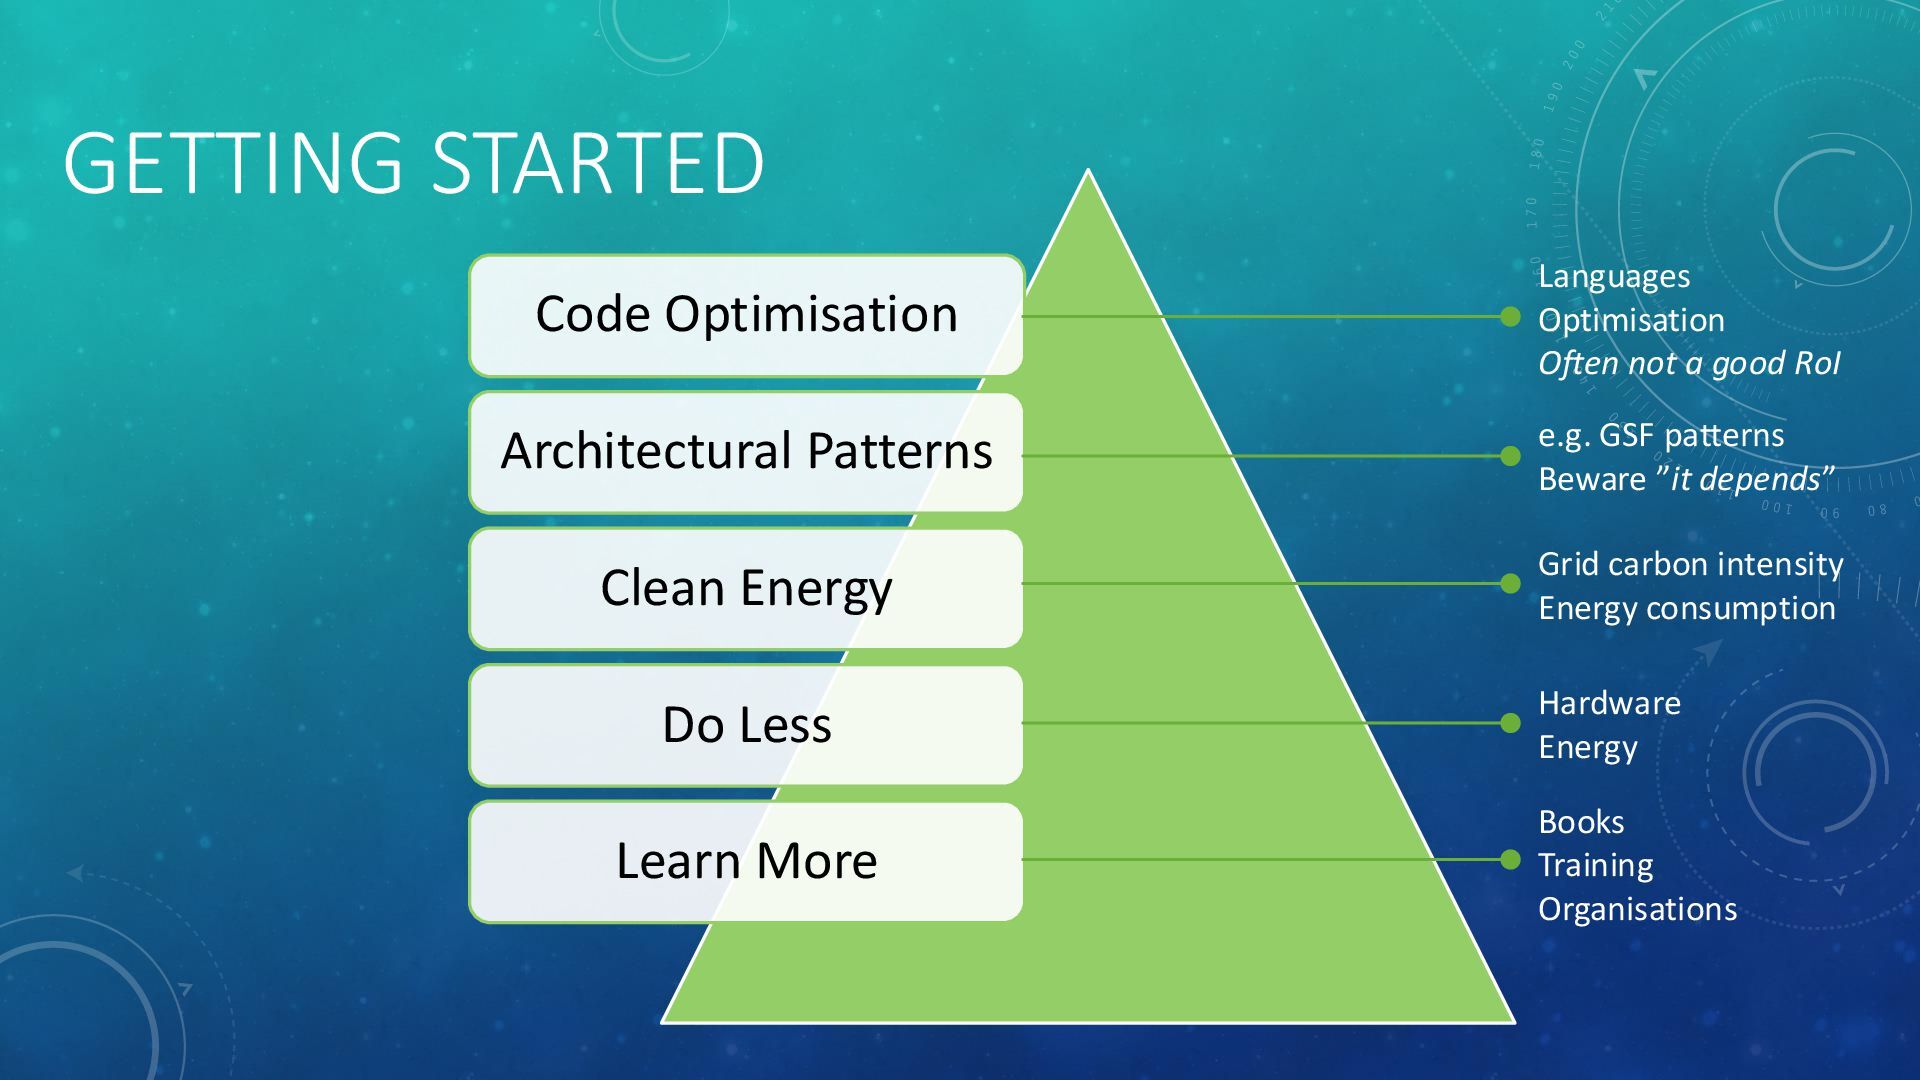
This talk examines software sustainability from an architect’s perspective, highlighting why software systems impact the environment. It covers practical strategies and design patterns to minimize environmental footprint—especially for AI features—and introduces methods for measuring system “carbon intensity” to help reduce overall environmental impact.

Avatar for Eoin Woods

Eoin Woods

November 08, 2025
Tweet

More Decks by Eoin Woods

Other Decks in Technology

Transcript

  1. Image by Markus Kammermann from Pixabay Climate change is one

    of the most urgent and serious problems facing humanity
  2. WHAT DOES SOFTWARE HAVE TO DO WITH CLIMATE CHANGE? •

    Anything to do with measuring climate change impact is complicated, but … • Estimates for ICT are 2-4% of global emissions • By comparison aviation is about 3% ! • And it is growing, at least in part due to AI • Data centres were 1.5% of global electricity in 2024 , it could be 3-4.5% by 2030 (IEA)1 • Microsoft’s GHG emissions up 30% in 20232 Image by István from Pixabay 1: IEA: https://tinyurl.com/iea-ds-demand 2: The Verge: https://tinyurl.com/ms-emissions
  3. Eoin Woods • Independent consultant • 2015- 2025, Chief Engineer

    at Endava • 2003 - 2014 in capital markets - UBS and BGI • 1990 – 2003 in products - Bull, Sybase, InterTrust • PhD in Software Architecture & Energy Efficiency1 (2019) 1 https://repository.uel.ac.uk/item/8459v
  4. • Green Software Concepts • Architectural Principles & Tactics •

    Dealing with AI • Case Study • Beginning Your Journey Agenda
  5. GREENHOUSE GAS (“CARBON”) AND SOFTWARE Supply Chain Construction Hardware Manufacturing

    Fossil Fuels Embodied Emissions (kgCO2e) Operational Emissions(kgCO2e) Renewables Software Application Energy (kWh) Embodied emissions are the emissions from creating the data centre and hardware Operational emissions are the emissions from the energy required to run the system Credit to James Costerton for the graphical concept) <------------ Grid Carbon Intensity (gCO2e/kWh) -----------> +
  6. EMBODIED EMISSIONS Emissions created by creating and disposing of a

    piece of hardware Sources: Tech Carbon Standard & Greenly Institute
  7. OPERATIONAL EMISSIONS Emissions created during operation Source: electricitymaps.com 6 September

    2024 GHG intensity of energy X Amount of energy used • Demand • Efficiency
  8. WHAT CAN SOFTWARE ARCHITECTS DO? • Principles? • Tactics? •

    Design patterns? • Software tools? Let’s consider some principles and tactics …
  9. GSF PRINCIPLES OF GREEN SOFTWARE 1. Emit the least amount

    of carbon possible. 2. Use the least amount of energy possible. 3. Do more when the electricity is cleaner and do less when the electricity is dirtier. 4. Use the least amount of embodied carbon possible. 5. What you can't measure, you can't improve. 6. Understand the exact mechanism of carbon reduction. https://learn.greensoftware.foundation
  10. TACTIC 1: DEMAND SHIFTING • We often have flexibility over

    when and where we do our processing • Run batches at different times • Execute workload in locations Electricity grids vary in their GHG intensity https://www.freepik.com/free-vector /clocks-with-different-hand-times-set_263632366.htm
  11. TACTIC 1: DEMAND SHIFTING • Move workload to times or

    places with lower grid carbon intensity • Move your workload in time to when your local grid is ”greener” • Move some of your workload to another grid which is “greener” • Trade offs: • complexity • hidden emissions (e.g. data movement) • driving cloud vendor behaviour
  12. TACTIC 2: DEMAND SHAPING • We can often vary intensity

    of processing in our system • Less precision, less graphics, reduced features, … We already know the grid varies in GHG intensity …
  13. TACTIC 2: DEMAND SHAPING • Do less processing when the

    grid has high GHG intensity, more when it has less • Trade-offs: complexity, reduced service may not be acceptable
  14. TACTIC 3: MOVE WORK TO CLIENT DEVICES • Desktops and

    mobile devices are almost idle for most of their lives • High embodied carbon footprints • Nearly zero emissions from additional workload • Moving work to clients reduces server workload and so environmental cost
  15. TACTIC 3: MOVE WORK TO CLIENT DEVICES Examples: • Consider

    passing raw results to the client for intensive compute tasks • Cache data on the client and process there to avoid server compute and memory • Move resilience mechanism to the client to simplify server-side resilience Trade-offs: • Complexity, dependencies on client devices, security, data movement
  16. TACTIC 4: MEASUREMENT • All emissions measurement is difficult and

    tends to be via estimation • Measuring helps to motivate and direct action • Cloud vendor dashboards provide some assistance • Check you are getting location-based data • Cloud Carbon Footprint may be OSS alternative • Data: Climatiq, Watt Time, Electricity Maps
  17. OTHER TACTICS • Provision only what is needed when it

    is needed • e.g. dynamically increase compute when needed • Consider compression for large data sets (at rest and in motion) • Cache static data • Minimise stored data (e.g. retention policies) • Turn off test and dev environments when not in use Some more ideas at https://patterns.greensoftware.foundation, but … it depends! You will notice that a lot of this is efficient and cost effective too
  18. SUSTAINABILITY FOR AI • AI-based systems require huge amounts of

    computing resources • processor, storage, memory • No surprise they are a sustainability disaster • Why Microsoft’s emissions grew 30% in 20241 • Model size and amount of training and inference (querying) are key determinants 1: The Verge: https://tinyurl.com/ms-emissions
  19. SUSTAINABILITY IN THE AI-SYSTEM LIFECYCLE Business & Data Understanding Evaluation

    Emissions as a quality attribute Use existing data sets Minimise collection Minimise storage Minimise processing Consider pre-trained models Minimise model size Shrink models (quantisation) Demand shift training & eval Specialised hardware Consider shrinking models Deploy to lowest GHG intensity location Specialised hardware Demand shift usage Demand shape usage Monitor GHG emissions Emission level reduction CRISP-ML(Q)
  20. CASE STUDY – DEMAND SHIFTING AI WORKLOAD • Machine learning

    workloads are resource intensive so can be emissions intensive • This team wanted to minimise the GHG emissions from their ML batches • Example workload chosen was classifying cursive Hiranya (Japanese) characters • Typical execution time of 10 minutes, required many times per day Goal: move workload in time or across regions to minimise GHG emissions
  21. CASE STUDY – DEMAND SHIFTING AI WORKLOAD • For example,

    on one specific measured day … • Running at 20:00 in Western-Europe results in estimated emissions of 125g CO2e • Shifting region estimated to save 29g CO2e (~25%) • Shifting time estimated to save 17g CO2E (~15%) • Total possible savings ~40% This is clearly worth exploring !
  22. CASE STUDY – DEMAND SHIFTING AI WORKLOAD Scheduler Electricity Metrics

    Retriever GSF Carbon-Aware SDK Electricity Maps Region 1 ML Workload GMT runner.py ML Pipeline Green Metrics Tool (UI & API) Electricity Metrics DB Consumption Metrics DB Invocation API Call Region 2 ML Workload GMT runner.py • CO2 emissions from Electricity Maps via Carbon-Aware SDK • Green Metrics Tool used to collect electricity usage • Pipeline invoked via scheduler or manually (for ”urgent” option) • Pipeline can choose region to schedule ML workload • Pipeline can reschedule if not “urgent”
  23. CASE STUDY – DEMAND SHIFTING AI WORKLOAD • Automatic demand

    shifting across time and geographies, with manual bypass for urgent work • Near real time data-based decision using Electricity Maps to understand grid carbon intensity • Measurement of electricity usage via Green Metrics Tool to allow estimation of emissions
  24. GETTING STARTED Code Optimisation Architectural Patterns Clean Energy Do Less

    Learn More Books Training Organisations Hardware Energy Grid carbon intensity Energy consumption e.g. GSF patterns Beware ”it depends” Languages Optimisation Often not a good RoI