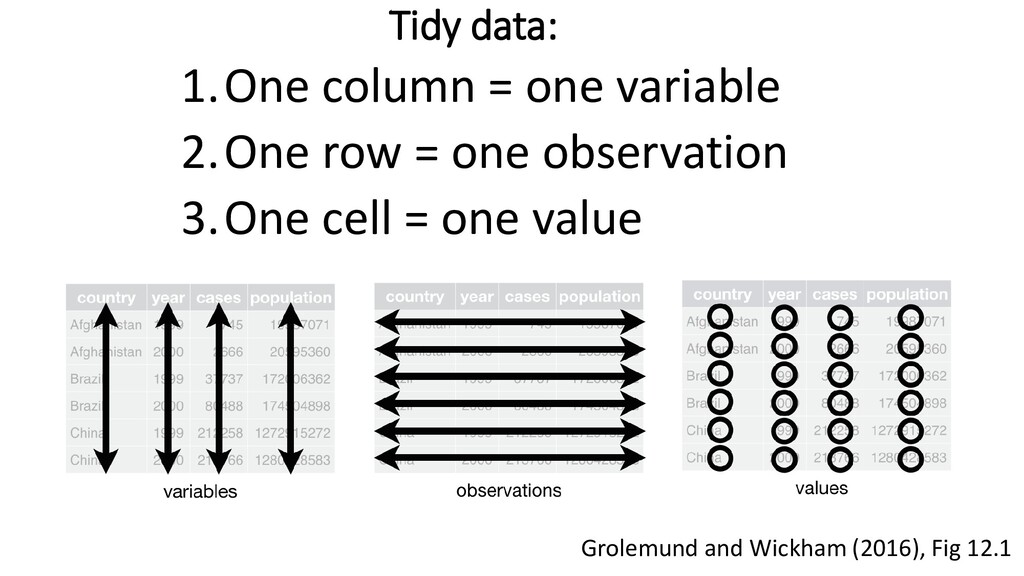
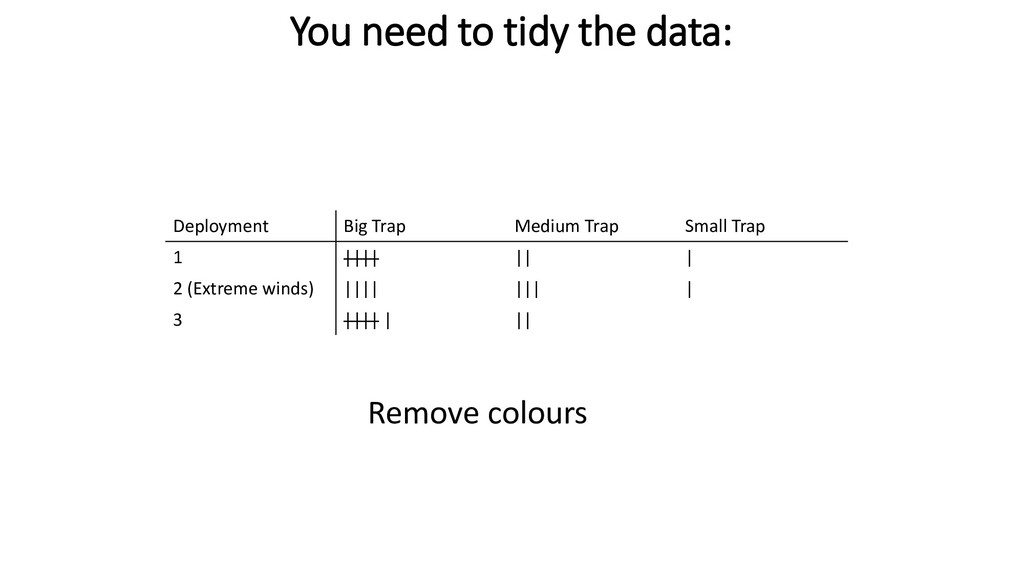
tidy Imagine a study… You tested three types of crab trap: Big, Medium, Small You deployed each trap three times (24 hr soak) and counted how many crabs you caught Deployment Big Trap Medium Trap Small Trap 1 |||| || | 2 (Extreme winds) |||| ||| | 3 |||| | || Makes sense to people. Nonsense to a computer Into your data booklet, you write:
| 2 (Extreme winds) |||| ||| | 3 |||| | || What does highlighting mean? Mixing two types of information Tallies aren’t machine readable Does the blank mean ZERO, or does it mean we didn’t count it (i.e. missing data)?
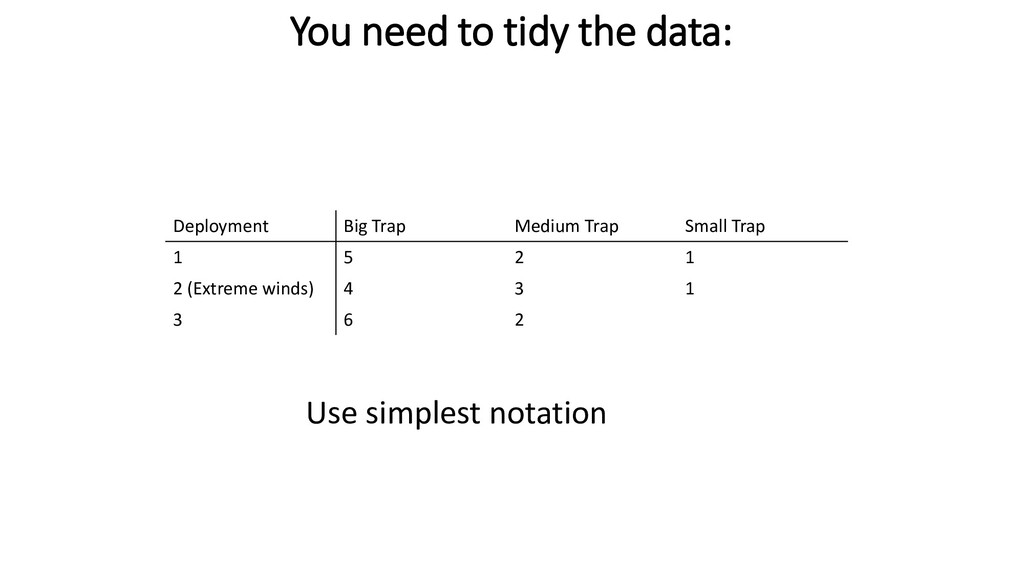
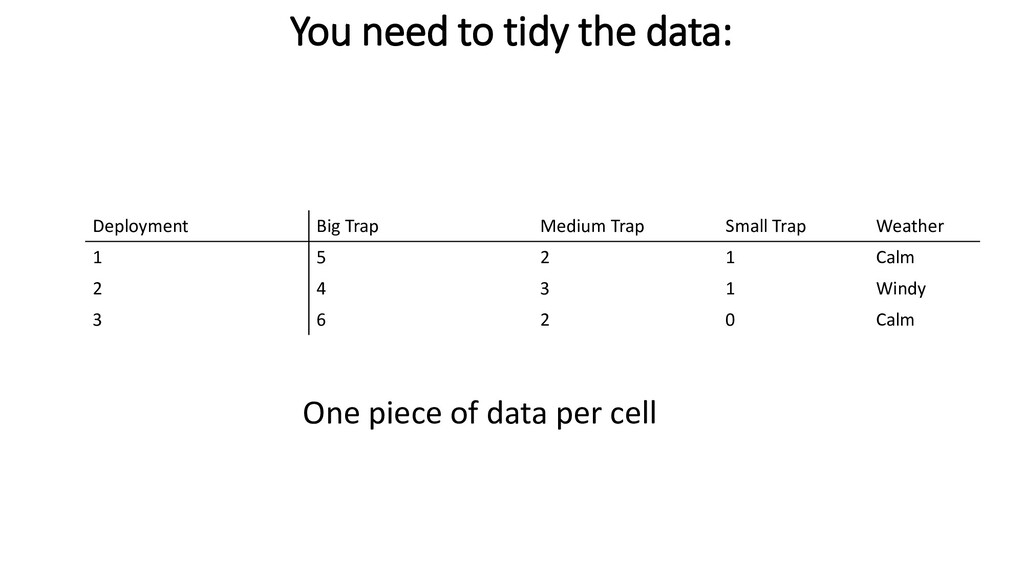
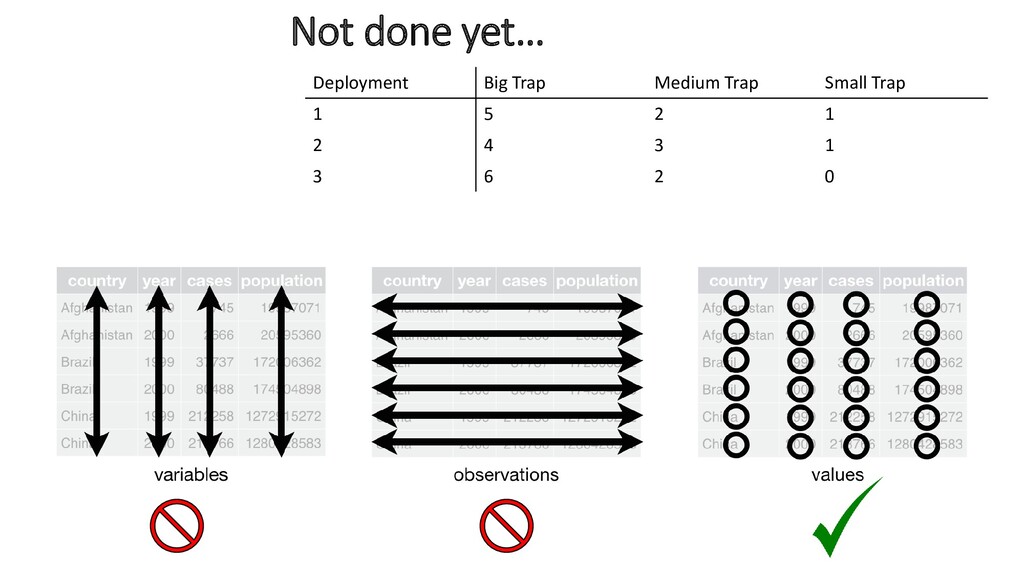
1 2 4 3 1 3 6 2 0 Not done yet… (We’ll ignore weather, for simplicity) What do these numbers indicate? Number of crabs caught in a trap. Number of crabs caught is ONE VARIABLE Number of crabs caught should be ONE COLUMN
quantities. Best for everything to be *observed* and derive quantities in R with your script. • E.g. Deployment Cod Haddock Total 1 1 2 3 2 2 3 5 3 1 1 2 Deployment Cod Haddock 1 1 2 2 2 3 3 1 1 Deployment Species Catch 1 Cod 1 1 Haddock 2 2 Cod 2 …
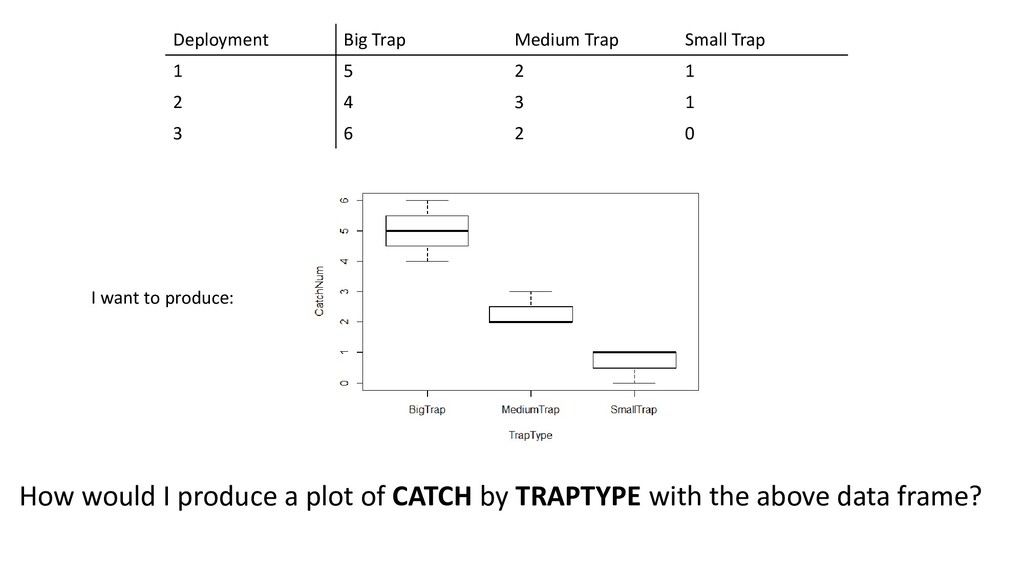
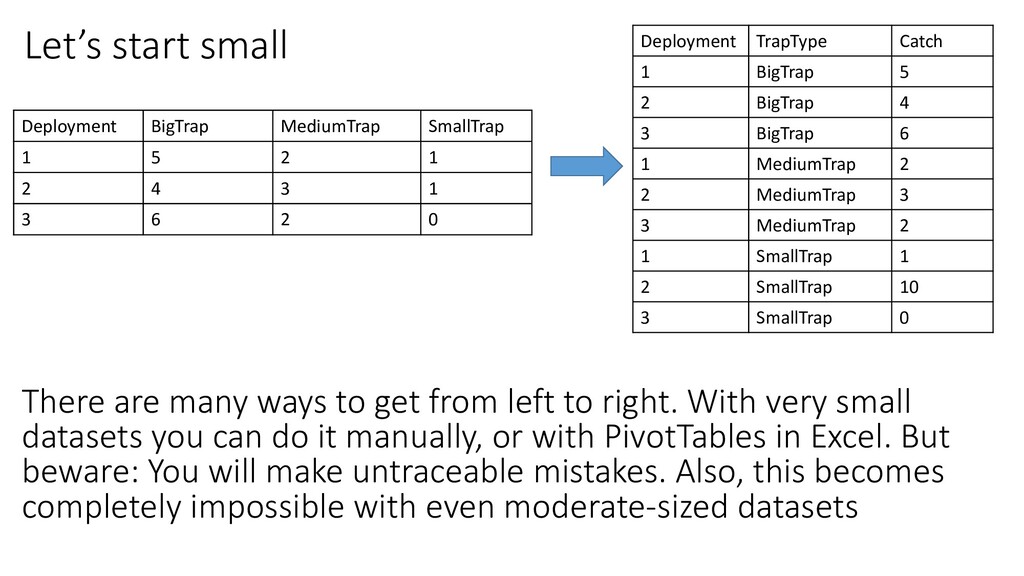
BigTrap 6 1 MediumTrap 2 2 MediumTrap 3 3 MediumTrap 2 1 SmallTrap 1 2 SmallTrap 10 3 SmallTrap 0 Deployment BigTrap MediumTrap SmallTrap 1 5 2 1 2 4 3 1 3 6 2 0 Let’s start small There are many ways to get from left to right. With very small datasets you can do it manually, or with PivotTables in Excel. But beware: You will make untraceable mistakes. Also, this becomes completely impossible with even moderate-sized datasets
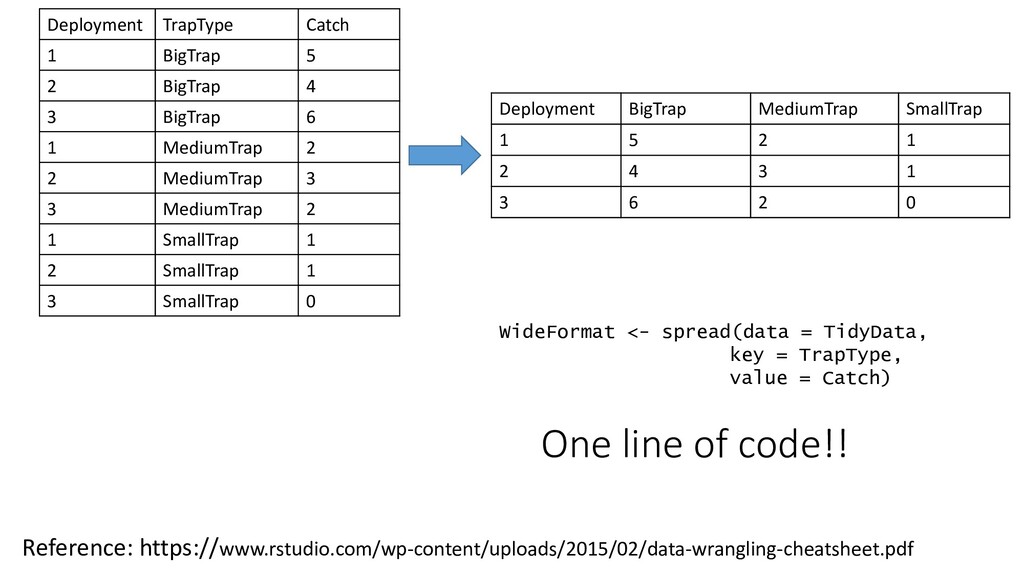
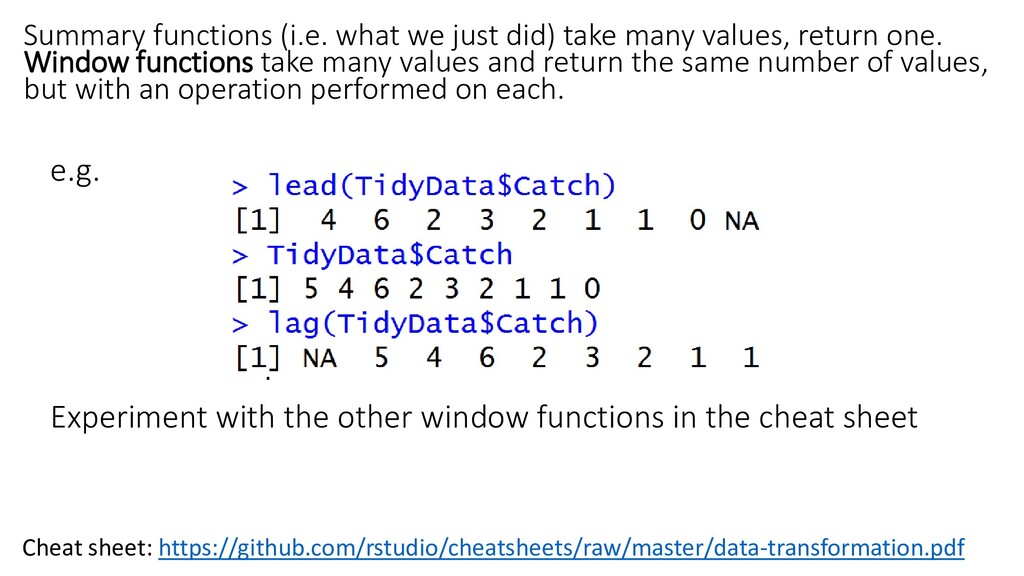
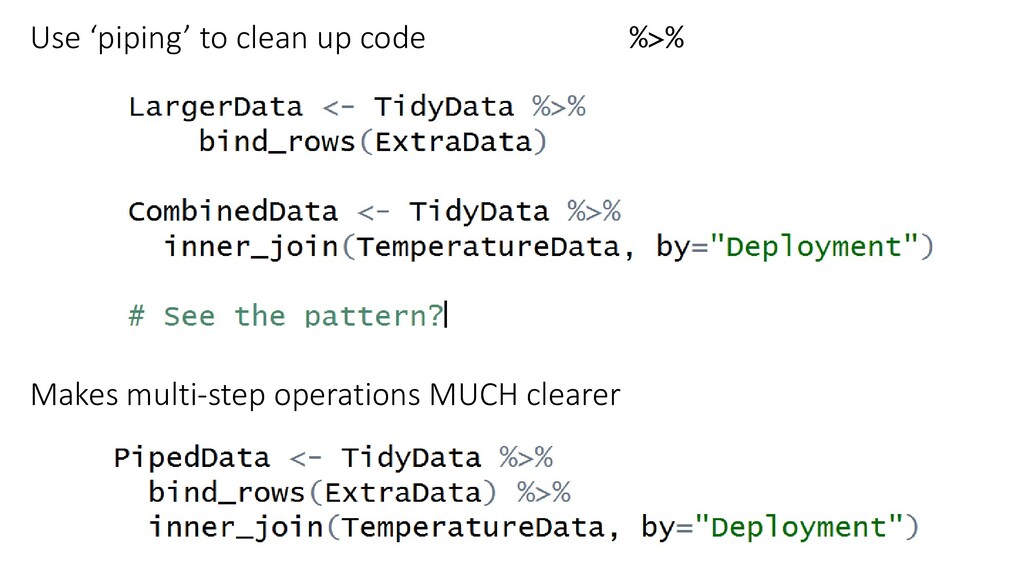
return one. Window functions take many values and return the same number of values, but with an operation performed on each. Experiment with the other window functions in the cheat sheet e.g. Cheat sheet: https://github.com/rstudio/cheatsheets/raw/master/data-transformation.pdf
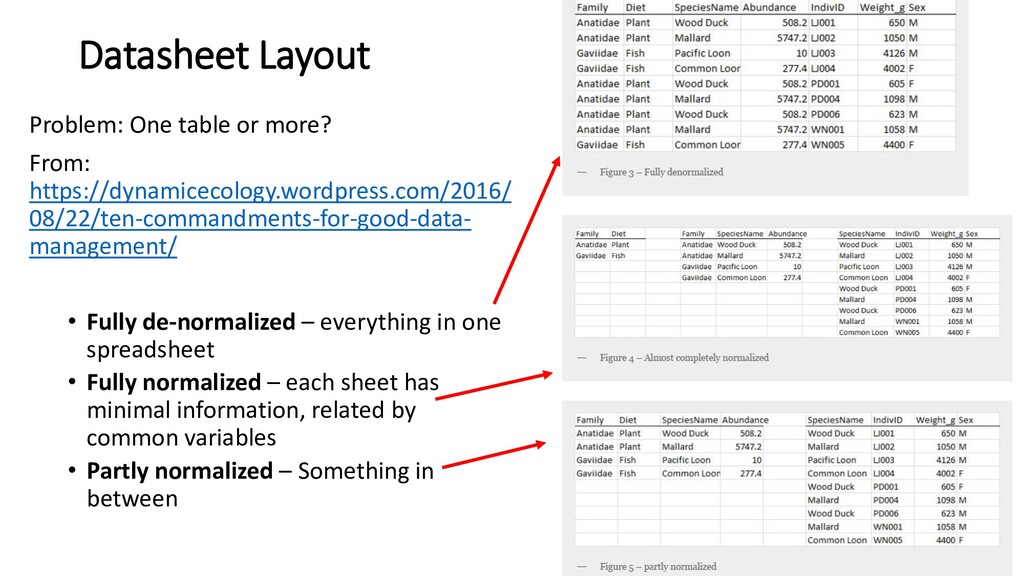
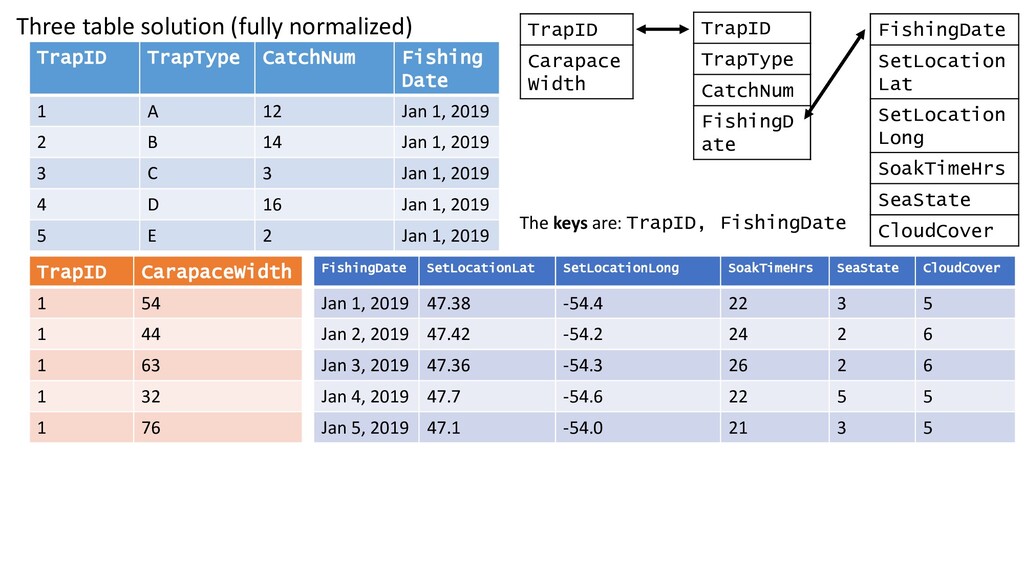
management/ • Fully de-normalized – everything in one spreadsheet • Fully normalized – each sheet has minimal information, related by common variables • Partly normalized – Something in between
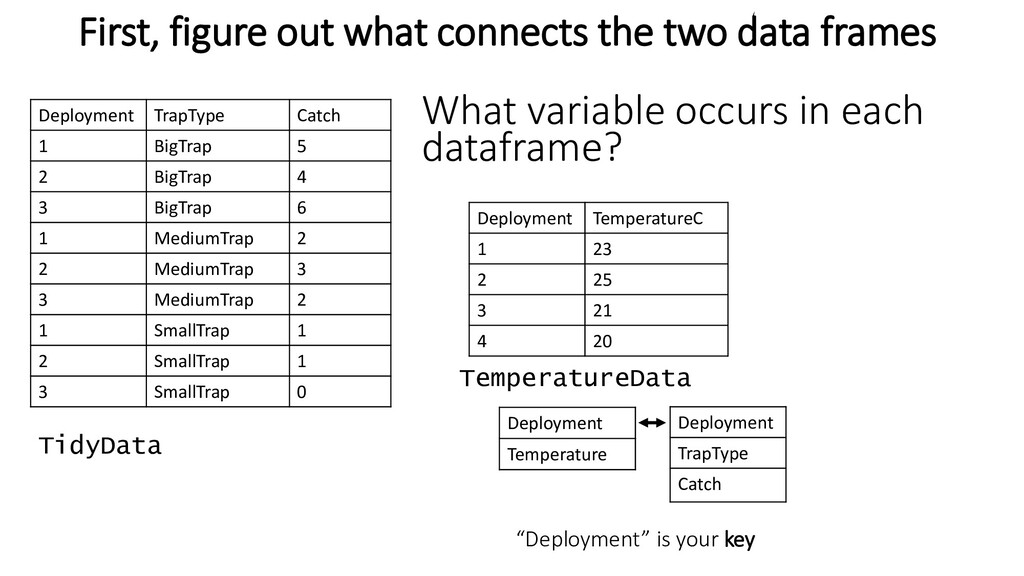
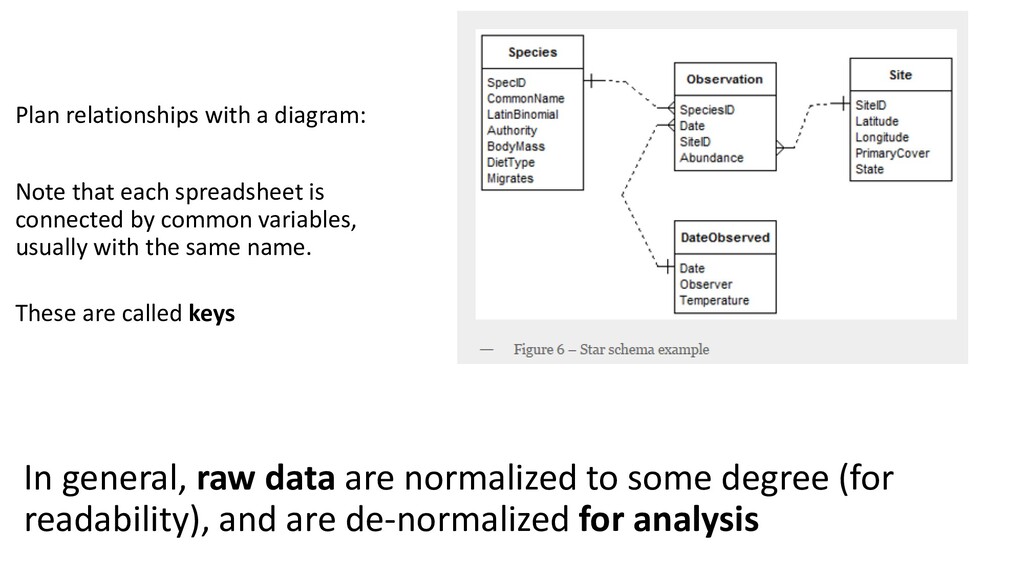
connected by common variables, usually with the same name. These are called keys In general, raw data are normalized to some degree (for readability), and are de-normalized for analysis
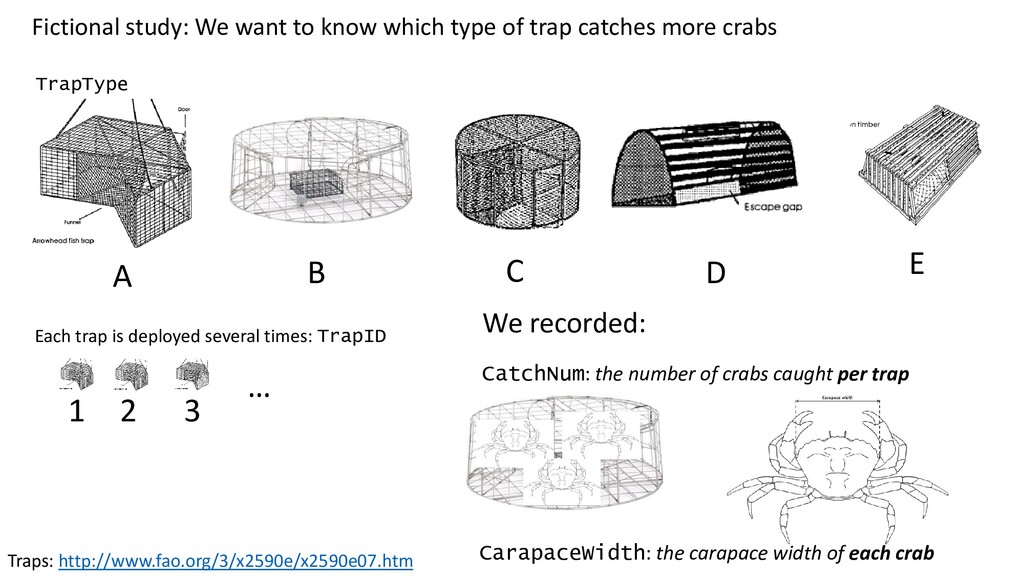
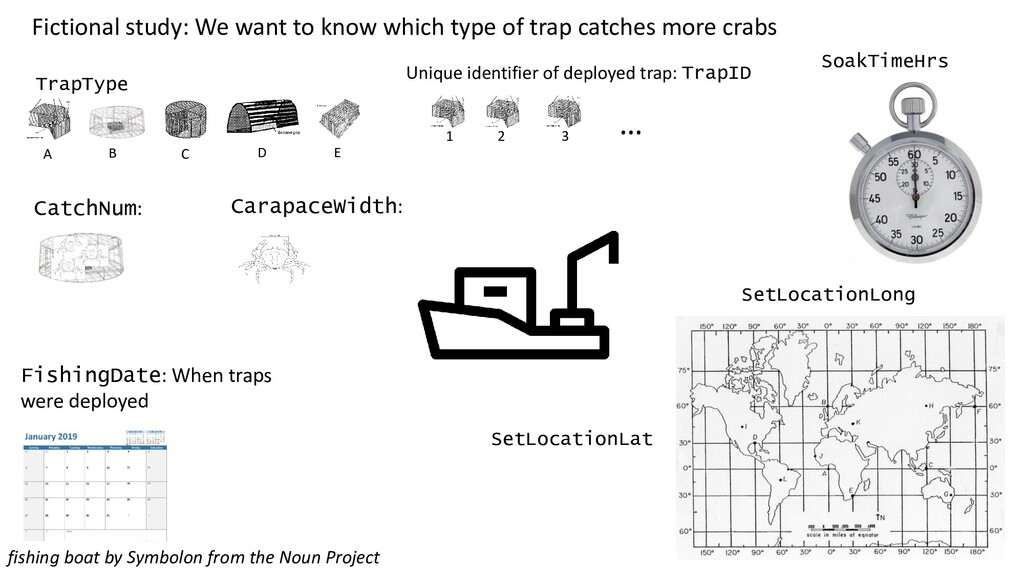
catches more crabs Traps: http://www.fao.org/3/x2590e/x2590e07.htm TrapType A B C D E Each trap is deployed several times: TrapID 1 2 3 … We recorded: CatchNum: the number of crabs caught per trap CarapaceWidth: the carapace width of each crab
catches more crabs TrapType A B C D E Unique identifier of deployed trap: TrapID 1 2 3 … CatchNum: CarapaceWidth: fishing boat by Symbolon from the Noun Project FishingDate: When traps were deployed SetLocationLat SetLocationLong SoakTimeHrs
(0 ft) Calm (glassy) 1 0 to 0.1 metres (0.00 to 0.33 ft) Calm (rippled) 2 0.1 to 0.5 metres (3.9 in to 1 ft 7.7 in) Smooth (wavelets) 3 0.5 to 1.25 metres (1 ft 8 in to 4 ft 1 in) Slight 4 1.25 to 2.5 metres (4 ft 1 in to 8 ft 2 in) Moderate 5 2.5 to 4 metres (8 ft 2 in to 13 ft 1 in) Rough 6 4 to 6 metres (13 to 20 ft) Very rough 7 6 to 9 metres (20 to 30 ft) High 8 9 to 14 metres (30 to 46 ft) Very high 9 Over 14 metres (46 ft) Phenomenal SeaState CloudCover More on cloud cover measurements: https://rmets.onlinelibrary.wiley.com/doi/full/10.1002/met.1542
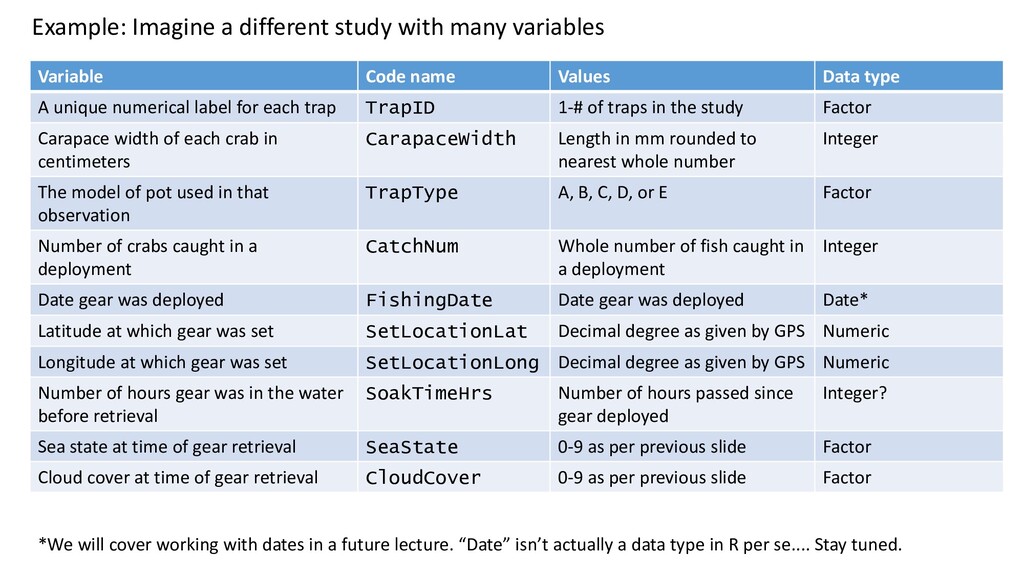
for each trap TrapID 1-# of traps in the study Factor Carapace width of each crab in centimeters CarapaceWidth Length in mm rounded to nearest whole number Integer The model of pot used in that observation TrapType A, B, C, D, or E Factor Number of crabs caught in a deployment CatchNum Whole number of fish caught in a deployment Integer Date gear was deployed FishingDate Date gear was deployed Date* Latitude at which gear was set SetLocationLat Decimal degree as given by GPS Numeric Longitude at which gear was set SetLocationLong Decimal degree as given by GPS Numeric Number of hours gear was in the water before retrieval SoakTimeHrs Number of hours passed since gear deployed Integer? Sea state at time of gear retrieval SeaState 0-9 as per previous slide Factor Cloud cover at time of gear retrieval CloudCover 0-9 as per previous slide Factor Example: Imagine a different study with many variables *We will cover working with dates in a future lecture. “Date” isn’t actually a data type in R per se.... Stay tuned.
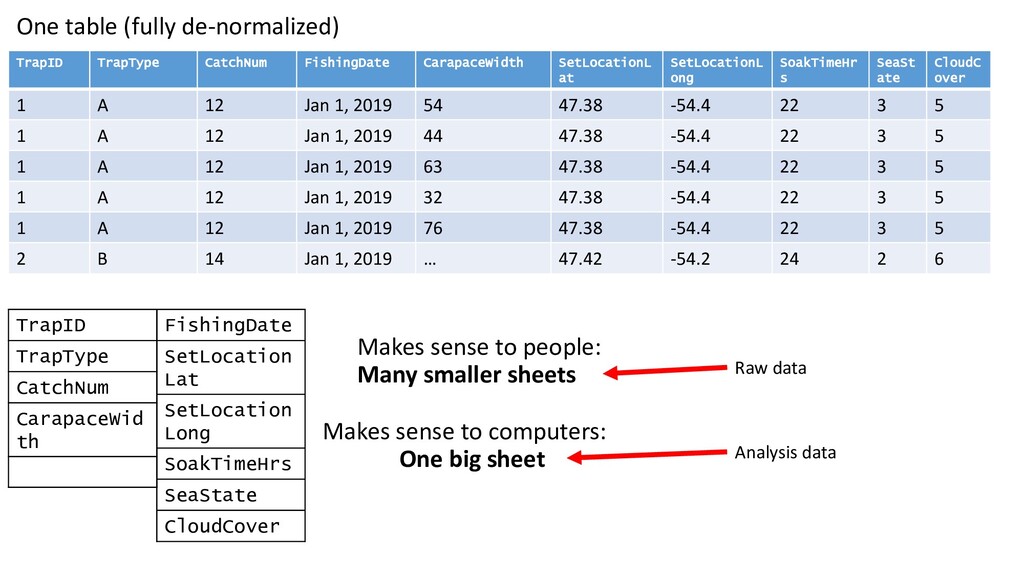
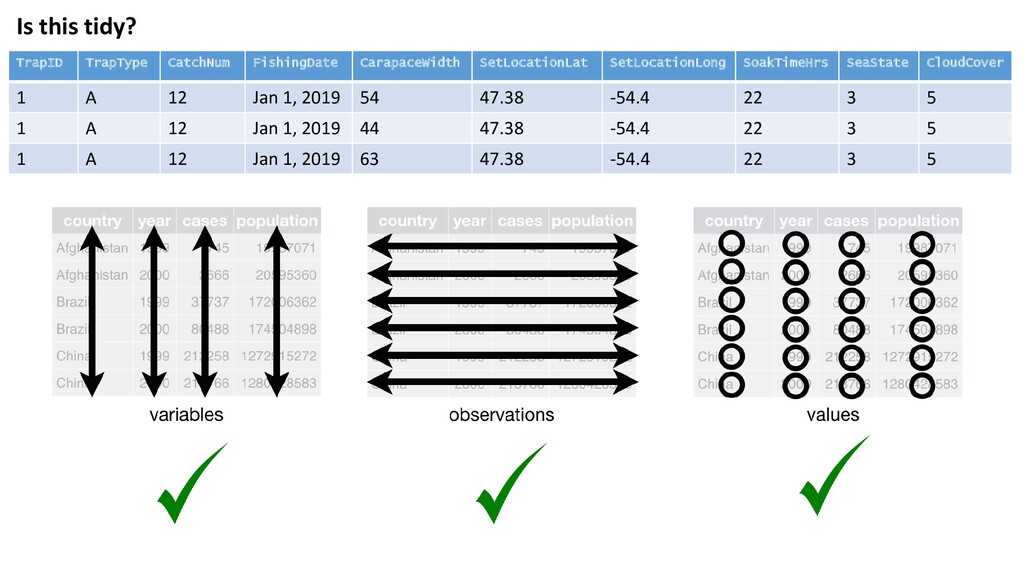
s SeaSt ate CloudC over 1 A 12 Jan 1, 2019 54 47.38 -54.4 22 3 5 1 A 12 Jan 1, 2019 44 47.38 -54.4 22 3 5 1 A 12 Jan 1, 2019 63 47.38 -54.4 22 3 5 1 A 12 Jan 1, 2019 32 47.38 -54.4 22 3 5 1 A 12 Jan 1, 2019 76 47.38 -54.4 22 3 5 2 B 14 Jan 1, 2019 … 47.42 -54.2 24 2 6 One table (fully de-normalized) FishingDate SetLocation Lat SetLocation Long SoakTimeHrs SeaState CloudCover TrapID TrapType CatchNum CarapaceWid th Makes sense to people: Many smaller sheets Makes sense to computers: One big sheet Raw data Analysis data
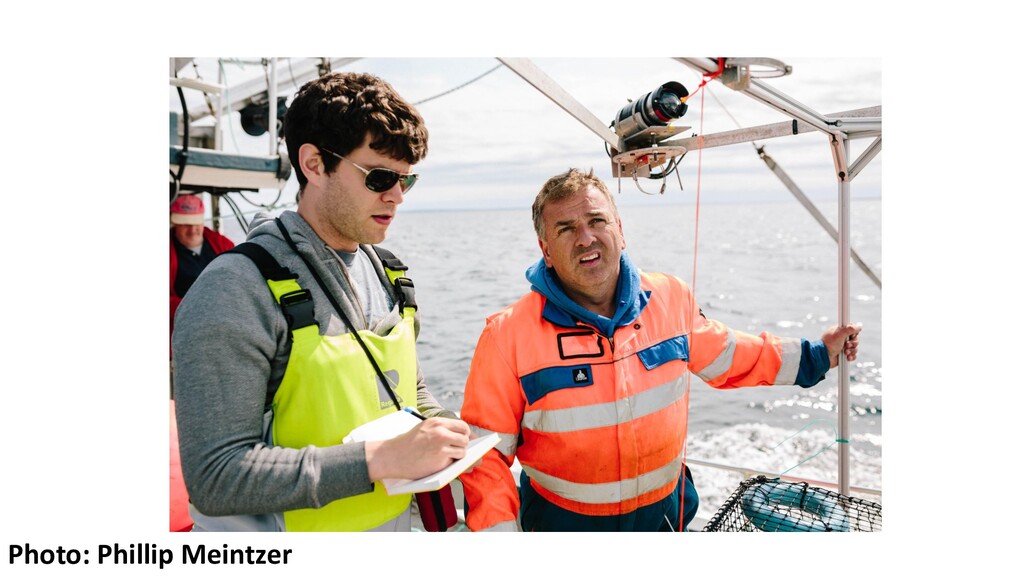
the field How will you record data? What will you record it on? How will you lay out your records? How will you make sure you don’t lose them? How will they be inputted into the computer?
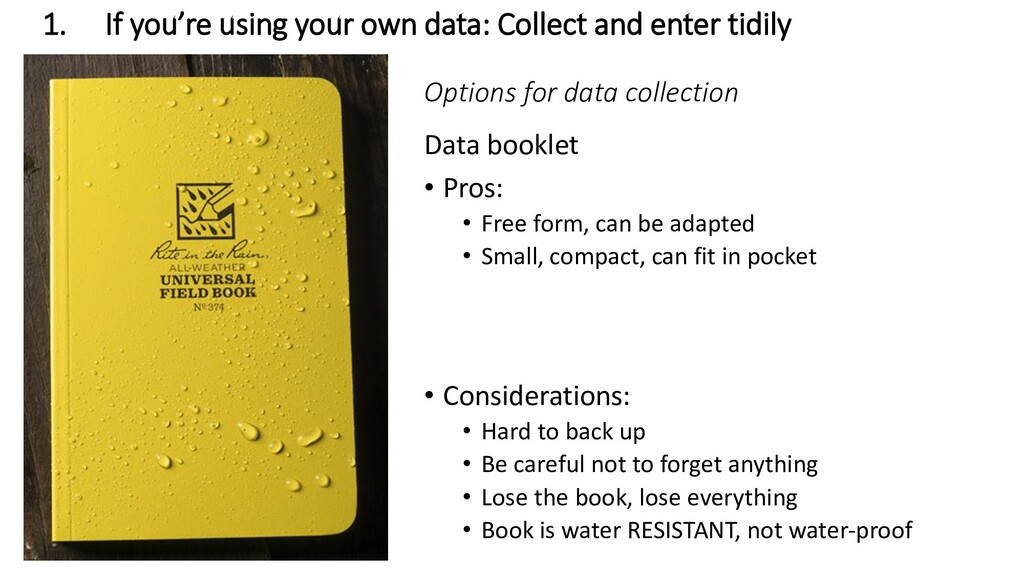
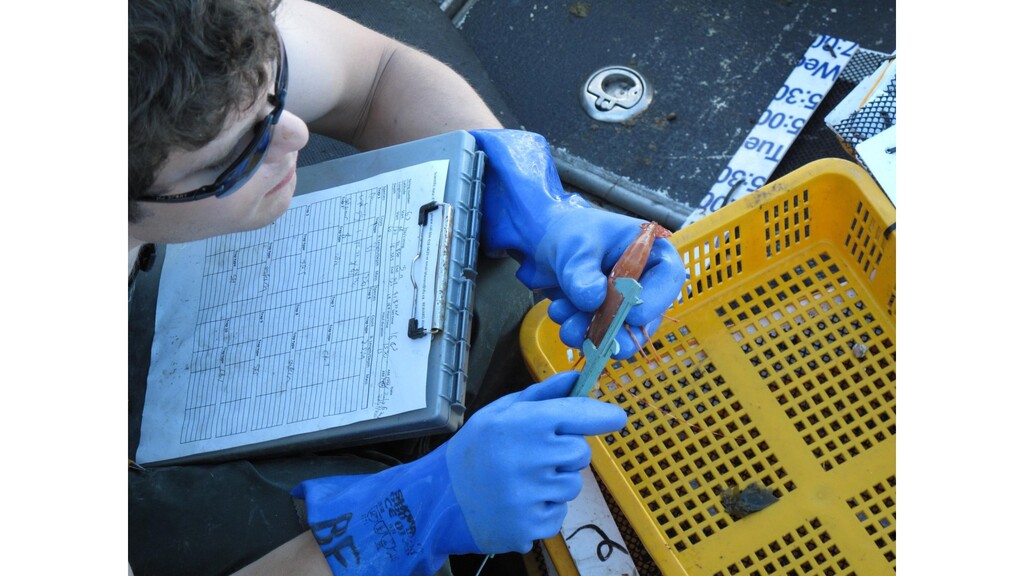
form, can be adapted • Small, compact, can fit in pocket • Considerations: • Hard to back up • Be careful not to forget anything • Lose the book, lose everything • Book is water RESISTANT, not water-proof 1. If you’re using your own data: Collect and enter tidily
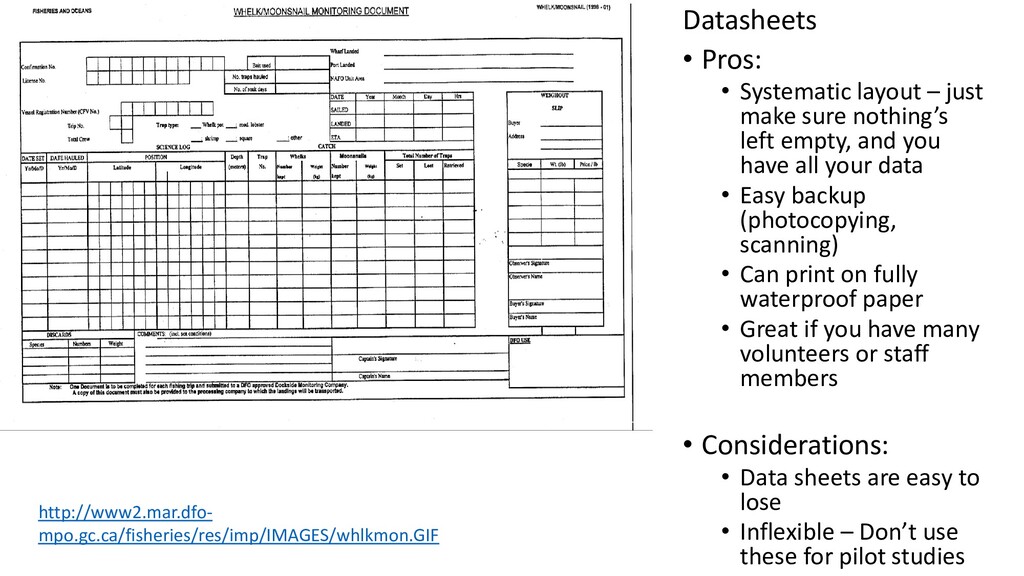
nothing’s left empty, and you have all your data • Easy backup (photocopying, scanning) • Can print on fully waterproof paper • Great if you have many volunteers or staff members • Considerations: • Data sheets are easy to lose • Inflexible – Don’t use these for pilot studies http://www2.mar.dfo- mpo.gc.ca/fisheries/res/imp/IMAGES/whlkmon.GIF
Backup can be automatic • No transcription error from tablet → computer • Can be good for administering forms to people (e.g. in data collection for social science) • Considerations: • Dead battery = no data collection • Possible to completely lose datasets due to technical error https://zapier.com/learn/forms-surveys/best-data- collection-apps/
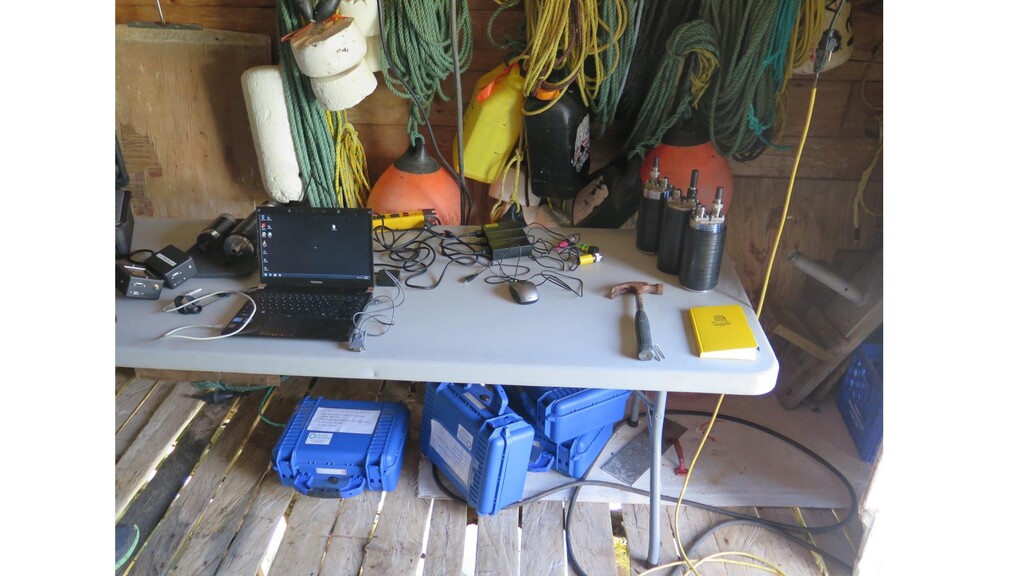
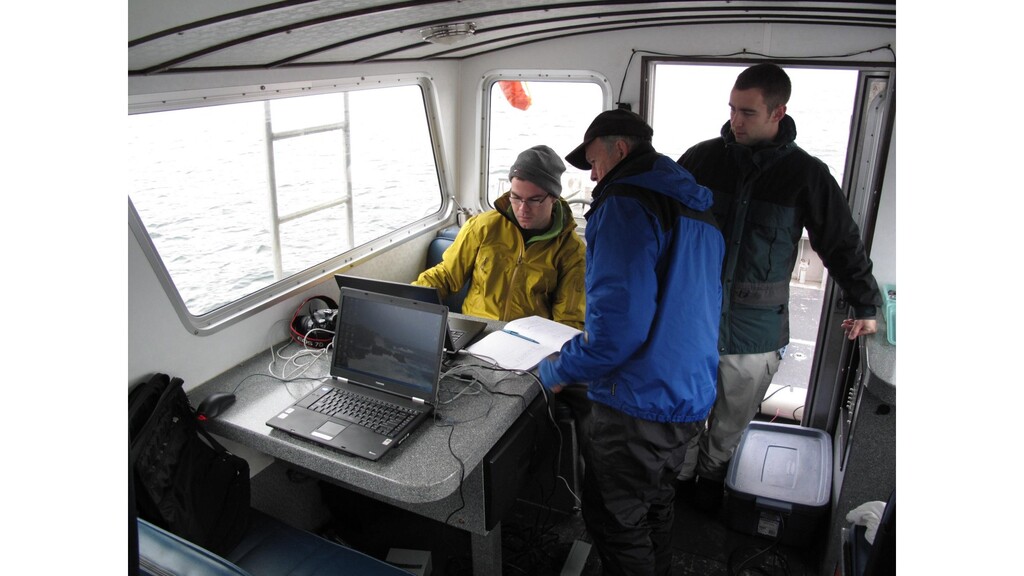
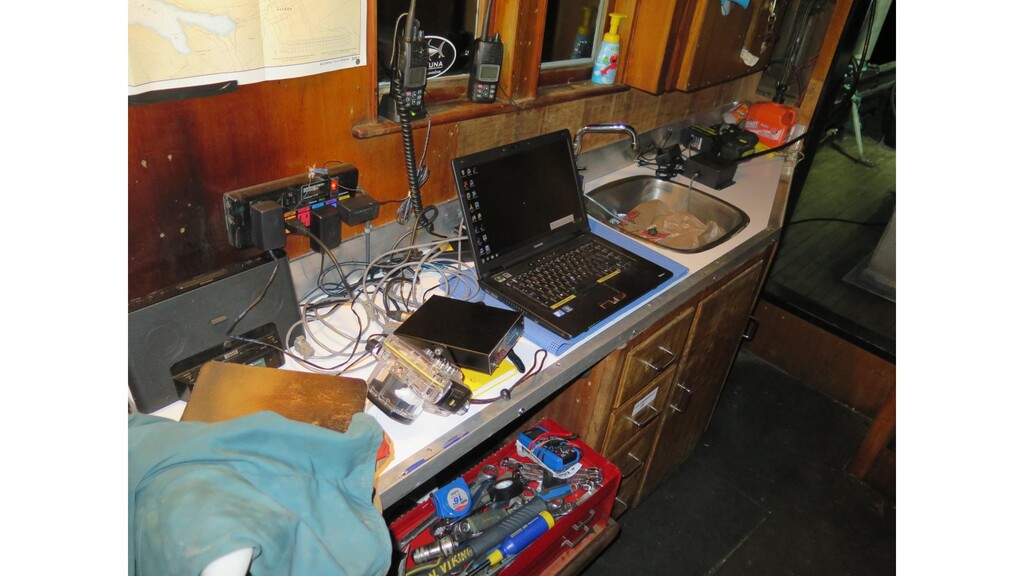
spreadsheet – complete control over data entry • Skip a step • Considerations: • Will you REALLY be able to operate a laptop while doing fieldwork? • Anything short of a Toughbook (seen left) is fragile
of how you enter it • Could be: Photos of field book. Photocopies of data sheets. Offsite backup of CSV file • If possible, store the backup physically off-site. If not, put on two portable HDs, or one HD and one laptop • When you get back to MI, store on internal infrastructure • Make sure you understand all your tools before you go into the field • Remember: Every piece of data costs time and money to collect! Treat it like solid gold! • Don’t leave stuff blank. Write zeroes. • Include enough detail in “notes” so that you can remember their point Digital security: How to secure your laptop before crossing the border: https://www.cba.org/Publications-Resources/CBA-Practice-Link/Young-Lawyers/2008/How-to- secure-your-laptop-before-crossing-the-bord Data Collection Tips