Upgrade to Pro — share decks privately, control downloads, hide ads and more …

Construction and Operation of Observability Platform using Istio

id
May 17, 2021

Construction and Operation of Observability Platform using Istio

Original Slide

Movie (in Japanese)

---

CloudNative Days Spring 2021 ONLINE

Observability is important to operate Cloud Native applications.

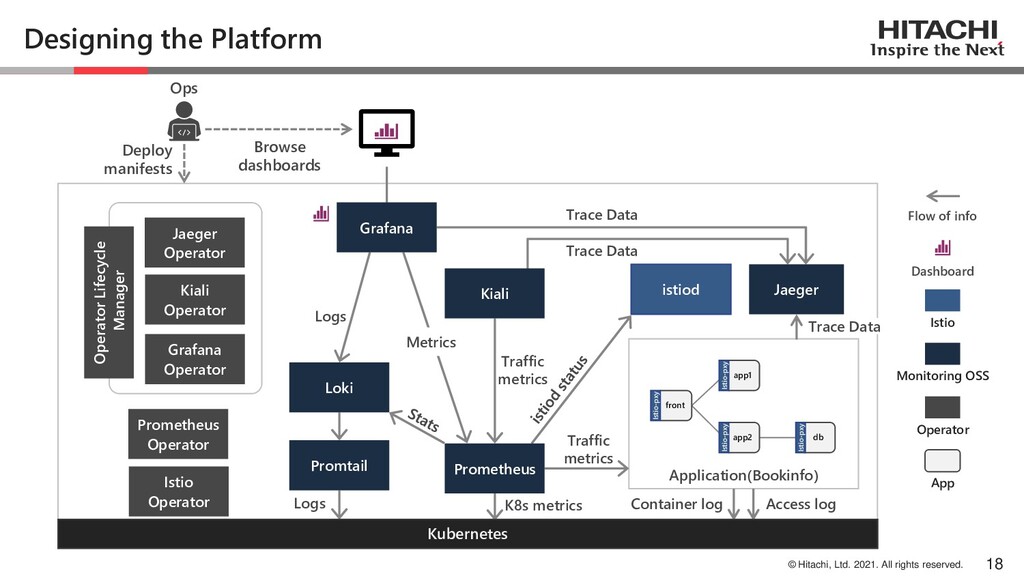
Currently, there are a variety of OSS and their operators to achieve observability. Integrating those OSS into Istio enables us to construct a platform to acquire metrics related to user experience, such as latency and error rate, without modifying the application.

However, there is not much information about the case studies of constructing and operating the platform. Each user is working on constructing the environment by trial and error.

In this session, we will introduce the knowledge we have gained while constructing an Observability platform integrating Istio and observability OSS (Prometheus, Loki, Jaeger, Grafana) and operating it using Operator.

id

May 17, 2021
Tweet

More Decks by id

Other Decks in Technology

Transcript

  1. © Hitachi, Ltd. 2021. All rights reserved.
    Construction and Operation of
    Observability Platform using Istio
    CloudNative Days Spring 2021 ONLINE
    2021.03.11
    Hitachi, Ltd. R&D Group
    Takaya Ide

    View Slide

  2. © Hitachi, Ltd. 2021. All rights reserved.
    Introduction
    ◇ How to determine SLI/SLO
    ◇ Manage alerts and incidents
    ◇ Improving operations
    based on monitoring results
    1
    This session shares the knowledge of an observability platform that
    uses Istio and OSS to transparently monitor service levels from apps
    ◇ What is observability?
    ◇ Istio’s observability features
    ◇ Tips to integrate Istio and
    monitoring OSS
    In Scope Out of scope

    View Slide

  3. © Hitachi, Ltd. 2021. All rights reserved.
    Contents
    2
    1. Background
    2. Observability Features of Istio
    3. How to Integrate Monitoring OSS and Istio
    4. Tips through Construction and Operation
    5. Conclusion

    View Slide

  4. © Hitachi, Ltd. 2021. All rights reserved.
    1. Background
    3

    View Slide

  5. © Hitachi, Ltd. 2021. All rights reserved.
    What is Observability ?
    4
    Testing
    Debugging
    Monitoring
    State Means
    Observability
    Tracing
    Logging
    Metrics
    Profiling
    Test
    Events Analyzing
    Chaos Eng.
    Simulating
    etc.
    Ref. John Porcaro, “Observability (re)defined”, https://www.humio.com/whats-new/blog/observability-redefined, 2019
    ▪ How well can you answer questions about the system with the data you have?
    ▪ Monitoring, debugging, etc. are the means to realize observability
    The state understanding what is happening inside your system and why, from data

    View Slide

  6. © Hitachi, Ltd. 2021. All rights reserved.
    Why Observability ?
    To deal with unknown phenomena
    5
    ▪ We need to grow our system quickly and exploratively as our business demands
    ◇ Distributed architecture
    ◇ Frequent code updating
    ◇ Dynamic scaling
    → Complex, interdependent, and constantly changing distributed system🤢
    ▪ Nothing can predict everything that will happen
    ▪ In order to make decisions in such situations,
    a mechanism is needed to notice and understand unknown phenomena
    → Observability

    View Slide

  7. © Hitachi, Ltd. 2021. All rights reserved.
    Service Level Monitoring
    ▪ Service level is a measurable value indicates the quality of service. E.g.) latency
    ▪ Service level monitoring can detect failures that can’t be detected by system monitoring
    ▪ However, Service level monitoring often requires help from the application
    ◇ Kubernetes also cannot monitor service level by itself
    6
    Operator
    User
    Too slow
    Kubernetes
    ・ No CPU saturation
    ・ No error log
    → Missing the issue
    App.
    Latency
    monitor
    System Monitoring
    Operator
    Notice the
    latency issue.
    !!
    Monitor
    Monitor ??
    Access
    Service Level Mon.
    Run on
    a single thread

    View Slide

  8. © Hitachi, Ltd. 2021. All rights reserved.
    Service Level Monitoring
    ▪ Service level is a measurable value indicates the quality of service. E.g.) latency
    ▪ Service level monitoring can detect failures that can’t be detected by system monitoring
    ▪ However, Service level monitoring often requires help from the application
    ◇ Kubernetes also cannot monitor service level by itself
    7
    Operator
    User
    Too slow
    Kubernetes
    ・ No CPU saturation
    ・ No error log
    → Missing the issue
    App.
    Latency
    monitor
    System Monitoring
    Operator
    Notice the
    latency issue.
    !!
    Monitor
    Monitor
    Run on
    a single thread
    ??
    Access
    Service Level Mon.

    View Slide

  9. © Hitachi, Ltd. 2021. All rights reserved.
    Service Level Monitoring
    ▪ Service level is a measurable value indicates the quality of service. E.g.) latency
    ▪ Service level monitoring can detect failures that can’t be detected by system monitoring
    ▪ However, Service level monitoring often requires help from the application
    ◇ Kubernetes also cannot monitor service level by itself
    8
    Operator
    User
    Too slow
    Kubernetes
    ・ No CPU saturation
    ・ No error log
    → Missing the issue
    App.
    Latency
    monitor
    System Monitoring
    Operator
    Notice the
    latency issue.
    !!
    Monitor
    Monitor
    Run on
    a single thread
    ??
    Access
    Service Level Mon.
    Often, it is a big constraint
    ✓ Not all apps can monitor service level
    ✓ Each apps have each metrics spec
    ✓ Other companies' products cannot be modified
    What should we do?
    requires help from the application

    View Slide

  10. © Hitachi, Ltd. 2021. All rights reserved. 9
    I s t i o

    View Slide

  11. © Hitachi, Ltd. 2021. All rights reserved.
    Service Level Monitoring using Istio
    ▪ Istio is software that manages inter-app traffic by proxies in front of each apps
    ▪ Collecting service level metrics from relay traffic
    ▪ Apps using HTTP can be monitored for service level regardless of their specs.
    10
    ▪ Throughput
    ▪ Latency
    ▪ Error rate
    ▪ Access log
    ▪ Tracing
    ▪ etc.

    Kubernetes
    App
    Monitoring tools
    (e.g., Prometheus)
    App
    Istio-proxy Istio-proxy
    Response
    Request
    (Res time) – (Req time)
    → Latency

    View Slide

  12. © Hitachi, Ltd. 2021. All rights reserved.
    Monitoring OSS bundle function was discontinued from v1.8 1
    because the full functionality of each OSS cannot be provided
    ▪ This change gave us significantly improved flexibility
    ▪ But users is required to integrate these themselves
    → Need some practices
    Monitoring
    OSS
    Status of Istio’s Observability Feature
    11
    1 “Reworking our Addon Integrations” https://istio.io/latest/blog/2020/addon-rework/
    Istio Istio
    Monitoring
    OSS
    Bundle
    Integrate
    as you like
    Before After

    View Slide

  13. © Hitachi, Ltd. 2021. All rights reserved.
    Implementation of Observability Platform using Istio
    ▪ Investigate know-how and notices about integration
    based on practice
    ▪ Collect data of the three pillars of Observability:
    metrics, tracing, and logging
    ▪ Utilize Operator to make monitoring OSS have
    operability and manageability that can be used in
    production env. 1
    12
    1. Data persistence and mTLS were omitted due to time constraints

    View Slide

  14. © Hitachi, Ltd. 2021. All rights reserved.
    2. Observability Features of Istio
    13

    View Slide

  15. © Hitachi, Ltd. 2021. All rights reserved.
    Data Obtainable in Istio (partial)
    ▪ Create a map of data that Istio can retrieve
    based on the official docs
    ▪ HTTP has many important metrics,
    including service level values
    14
    1. It is called service-level in the official docs
    Metrics
    App level 1
    Proxy level
    HTTP
    Tracing
    Logging
    TCP
    istio-proxy
    istiod
    Throughput
    Latency
    Request error rate
    Data size
    Connections
    Stats of each proxy(e.g., retries)
    Status of Istio’s control plane
    Tracing data
    Access log

    View Slide

  16. © Hitachi, Ltd. 2021. All rights reserved.
    Data collected by the Platform
    ▪ Get all data without “Stats of each proxy”
    ▪ Because it produces a huge amount of
    small grained data
    15
    1. It is called service-level in the official docs
    Metrics
    App level 1
    Proxy level
    HTTP
    Tracing
    Logging
    TCP
    istio-proxy
    istiod
    Throughput
    Latency
    Request error rate
    Data size
    Connections
    Stats of each proxy(e.g., retries)
    Status of Istio’s control plane
    Tracing data
    Access log

    View Slide

  17. © Hitachi, Ltd. 2021. All rights reserved.
    Monitoring OSS that can be integrated with Istio
    ▪ Monitoring OSS that can be integrated with Istio, and their relationship
    ▪ Many software can be integrated with Grafana
    16
    has own
    dashboard
    Logging
    Metrics
    Tracing
    Dashboard
    Istio
    Logstash
    fluentbit
    Promtail
    Elastic
    search
    Grafana
    Loki
    Kibana
    Prome
    theus
    Jaeger
    Zipkin
    Open
    Sensus
    Kiali
    Istio-proxy
    Istiod
    Grafana
    Grafana
    Tempo
    Istio also supports DataDog, Lightstep, and StackDriver
    as tracing, but omitted because they are not OSS.

    View Slide

  18. © Hitachi, Ltd. 2021. All rights reserved.
    OSS used in the Platform
    ▪ Use Grafana as the main dashboard
    ▪ Select OSS with strong integration with Grafana
    17
    Logstash
    fluentbit
    Promtail
    Elastic
    search
    Grafana
    Loki
    Kibana
    Prome
    theus
    Jaeger
    Zipkin
    Open
    Sensus
    Kiali
    Istio-proxy
    Istiod
    Grafana
    Grafana
    Tempo
    has own
    dashboard
    Logging
    Metrics
    Tracing
    Dashboard
    Istio
    Istio also supports DataDog, Lightstep, and StackDriver
    as tracing, but omitted because they are not OSS.

    View Slide

  19. © Hitachi, Ltd. 2021. All rights reserved.
    K8s metrics
    Designing the Platform
    18
    Prometheus
    Operator
    Jaeger
    Operator
    Kiali
    Operator
    Application(Bookinfo)
    front
    app1
    db
    app2
    Istio-pxy
    Istio-pxy
    Istio-pxy
    Istio-pxy
    Access log
    Container log
    Traffic
    metrics
    Logs
    Metrics
    Logs
    istiod
    Traffic
    metrics
    Istio
    Operator
    Operator Lifecycle
    Manager
    Kubernetes
    Deploy
    manifests
    Ops
    Browse
    dashboards
    Monitoring OSS
    Istio
    Operator
    Flow of info
    Dashboard
    App
    Grafana
    Operator
    Trace Data
    Trace Data
    Trace Data
    Grafana
    Jaeger
    Kiali
    Prometheus
    Loki
    Promtail

    View Slide

  20. © Hitachi, Ltd. 2021. All rights reserved.
    3. How to Integrate Monitoring OSS and Istio
    19

    View Slide

  21. © Hitachi, Ltd. 2021. All rights reserved.
    Map
    20
    K8s metrics
    Prometheus
    Operator
    Jaeger
    Operator
    Kiali
    Operator
    Grafana
    Jaeger
    Kiali
    Prometheus Sample App(Bookinfo)
    Loki
    front
    app1
    db
    app2
    Istio-pxy
    Istio-pxy
    Istio-pxy
    Istio-pxy
    Access log
    Container log
    Traffic
    metrics
    Logs
    Metrics
    Logs
    istiod
    Traffic
    metrics
    Istio
    Operator
    Operator Lifecycle
    Manager
    Kubernetes
    Grafana
    Operator
    Promtail
    Trace Data
    Trace Data
    Tracing Data
    Loki・
    Promtail
    p.23
    Grafana
    p.25
    Jaeger
    p.24
    Prometheus
    p.21
    Omitted because it is under construction
    Browse
    dashboards
    Monitoring OSS
    Istio
    Operator
    Flow of info
    Dashboard
    App
    Deploy
    manifests
    Ops

    View Slide

  22. © Hitachi, Ltd. 2021. All rights reserved.
    Integrate with Prometheus 1/2
    ▪ Whether Prometheus should be composed as Shared or Hierarchical1
    → Adopted a Shared composition, prioritizing the reduction of manage cost
    21
    Hierarchical composition Shared composition
    Istio
    Prometheus
    Production
    Prometheus
    Production
    Prometheus
    Gathering data
    Gathering
    data
    Pros
    ▪ Distributed loads
    ▪ Clear demarcation point
    ▪ Official recommended 2
    ----
    Cons
    ▪ Complex
    ▪ More manage cost
    ▪ More resource usage
    Pros
    ▪ Simple
    ▪ Less manage cost
    ▪ Less resource usage
    ----
    Cons
    ▪ Load concentration
    to prod. Prometheus
    ▪ Ambiguous
    demarcation point
    1. in-house jargon
    2. Observability Best Practices https://istio.io/latest/docs/ops/best-practices/observability/#using-prometheus-for-production-scale-monitoring
    Aggre-
    gating
    Gathering data

    View Slide

  23. © Hitachi, Ltd. 2021. All rights reserved.
    Integrate with Prometheus 2/2
    ▪ Building Prometheus based on “kube-prometheus”
    ◇ Package of monitoring OSS provided by the Prometheus-Operator
    ◇ It can build pre-configured Prometheus, Grafana, and Alert Manager
    ▪ To get Istio’s metrics, the following settings are required for Prometheus
    Prometheus Operator is recommended to ease management
    ◇ istio-proxy : Scrape “/stats/prometheus” of each proxy by PodMonitor
    ◇ istiod:Scrape http-monitoring port in istiod Service by ServiceMonitor
    ◇ NOTE : “spec.namespaceSeletor.any = true” setting in
    Pod/ServiceMonitor didn’t work in my env.
    22

    View Slide

  24. © Hitachi, Ltd. 2021. All rights reserved.
    Integrate with Loki and Promtail
    ▪ Deploy with Helm or Tanka (officially
    recommended)
    ◇ Loki and Promtail do not currently
    have an operator (2021.3)
    ◇ Helm works fine in my environment
    ▪ To output the access log, the setting must
    be made when deploying Istio
    ◇ Set spec.meshConfig.accessLogFile
    in IstioOperator
    ◇ The Istio of this platform performs the
    right settings
    23
    # Config of Istio in the platform
    apiVersion: install.istio.io/v1alpha1
    kind: IstioOperator
    metadata:
    namespace: istio-system
    name: istio
    spec:
    profile: default
    meshConfig:
    accessLogFile: /dev/stdout
    enableTracing: true
    defaultConfig:
    tracing:
    sampling: 1
    zipkin:
    address:
    :9411
    For Jaeger
    For Loki

    View Slide

  25. © Hitachi, Ltd. 2021. All rights reserved.
    Integrate with Jaeger
    ▪ Jaeger can be easily deployed using the Jaeger Operator
    ▪ Each Istio-proxy generates trace span and sends data to Jaeger
    ◇ Specify the Jaeger endpoint in IstioOperator. See previous page
    ◇ IstioOperator also can set sampling rate1 (default 1%)
    ◇ NOTE: A restart of all istio-proxies is required to apply the trace settings.
    ▪ But Distributed tracing also requires “Trace-Context Propagation”
    on each APPLICATION 2
    ◇ istio-proxy cannot determine the correspondence between RX and TX
    ◇ This is only point that needs to be handled by the application
    24
    1. It can also be specified in the proxy.istio.io/config annotation of the Pod, and different values can be set per Pod
    2. https://istio.io/latest/docs/tasks/observability/distributed-tracing/overview/#trace-context-propagation

    View Slide

  26. © Hitachi, Ltd. 2021. All rights reserved.
    Integrate with Grafana
    ▪ Grafana Operator is recommended to manage dashboards
    ◇ It can also be deployed via kube-prometheus as mentioned above
    ◇ kube-prometheus has good dashboards. You can transplant them as needed
    ▪ Integration
    ◇ Import data source of Prometheus, Loki, Jaeger by GrafanaDataSource
    ◇ Import Istio official dashboards by GrafanaDashboard (5+1 type)1、2
    ✓ GrafanaDashboard resource can assign data sources and
    retrieve plugins with declarative
    ◇ NOTE : Dashboard editing from GUI disappears by restarting the container
    25
    1 https://istio.io/latest/docs/ops/integrations/grafana/ … 5 dashboards listed on the official website
    2 https://grafana.com/grafana/dashboards/13277 ... Dashboard for WASM in Grafana's Istio repository

    View Slide

  27. © Hitachi, Ltd. 2021. All rights reserved.
    Running the Observability Platform
    ▪ With the above configuration, the Observability platform run successfully
    ▪ Confirmed to be able to get service level metrics such as latency, error rate
    26
    Metrics
    Logging Tracing
    Throughput Error Rate Latency

    View Slide

  28. © Hitachi, Ltd. 2021. All rights reserved.
    4. Tips through Construction and Operation
    27

    View Slide

  29. © Hitachi, Ltd. 2021. All rights reserved.
    Keep it Simple
    Small Start
    ▪ You only need metrics at first. After that, logging → tracing
    ▪ Tracing can be added as you feel the need to do so
    ▪ Compare the benefits and the operational cost
    Separation of Istio and Monitoring OSS
    ▪ To avoid complexity, monitoring OSS should be deployed outside the Istio mesh
    ▪ If monitoring OSS is involved in Istio failure, it is impossible to analyze the cause
    ▪ But be careful not to isolate monitoring OSS when mTLS is applied
    Centralized Dashboard
    ▪ Grafana is useful for viewing metrics, logging, and tracing in a single GUI
    28

    View Slide

  30. © Hitachi, Ltd. 2021. All rights reserved.
    Configuration Management
    Configuration becomes more complex because it handles multiple OSS and Operators.
    Consistent management is needed
    Single Source of Truth
    ▪ Manage various configurations in Git with Kubernetes manifests
    ▪ Prometheus and Grafana's Operator work well with Git
    ▪ Changing the configuration via GUI or CLI will break the consistency of SSOT.
    Changes should be reflected in the manifest.
    Managing Deployment Methods
    ▪ Each OSS has a different deployment method: Helm, Operator, OLM, CLI, GUI
    ▪ Manage the manifest generation method
    29

    View Slide

  31. © Hitachi, Ltd. 2021. All rights reserved.
    Using Istio or Not
    ▪ Istio is a huge layer. Cannot be easily added or removed
    ▪ Do the Pros exceed the Cons? Do you have a good use case? 1
    30
    ▪ Consistently enforce policies
    across the entire system
    without app modification
    ▪ Many features
    ◇ Observability
    ◇ Dynamic traffic control
    ◇ mTLS, AuthN/AuthZ
    ▪ Active communities, etc.
    ▪ System complexity due to
    additional Service Mesh layer
    ▪ Learning costs
    ▪ Management cost
    ▪ Increased resources usage
    ▪ 2-10ms latency per hop
    ▪ Kubernetes lock in
    ▪ Update every 3-6 months, etc.
    1 Collection of Use Cases
    ▪ Megan O’Keefe, “Istio by Example!”, https://www.istiobyexample.dev/ , (Japanese version https://istiobyexample-ja.github.io/istiobyexample/ )
    ▪ Istio official docs, https://istio.io/latest/docs/tasks/
    Pros Cons

    View Slide

  32. © Hitachi, Ltd. 2021. All rights reserved.
    5. Conclusion
    31

    View Slide

  33. © Hitachi, Ltd. 2021. All rights reserved.
    Conclusion
    Observability means "The state understanding what is happening
    inside the system and why, from data"
    ▪ To deal with unknown phenomena
    Combining Istio and monitoring OSS, we built a platform to
    transparently monitor service levels from applications
    ▪ Using Prometheus, Jaeger, Loki, and Grafana
    Knowledge gained from construction and operation
    ▪ Keep it simple and manage the configuration
    ▪ Decide whether to use Istio considering both its benefits and
    concerns
    32

    View Slide

  34. © Hitachi, Ltd. 2021. All rights reserved.
    In Future
    ▪ Observability in Practice
    ◇ Improve stability and usability
    ◇ retrieve challenges through operation
    ◇ hopefully release to the public
    ▪ mTLS support
    ◇ Designing authorization to obtain monitoring data
    ▪ Data persistence
    ◇ Establish the PV applying method
    ◇ Verify the disk usage of monitoring data
    ▪ Control metrics acquisition methods
    ◇ Next page
    33

    View Slide

  35. © Hitachi, Ltd. 2021. All rights reserved.
    Control the Metrics Acquisition Methods
    ▪ Metrics may have different name, function and collecting methods by environments
    ◇ E.g., CPU usage is normalized by cores or not
    ◇ E.g., Platform can collect the metrics or not
    ▪ Mapping individual metrics to improve portability to multiple environments
    34
    On Premise
    Cloud A
    App
    Monitoring service
    App
    Side
    Car
    function composition
    Cloud A $val*$cores -
    On Premise $val add $sidecar
    Deploy
    Convert
    $val * $cores $val
    DB
    Metrics map
    Metrics converter
    Operator
    CPU usage
    800%
    300%
    50%
    CPU usage
    300%
    CPU usage
    vCPUx16

    View Slide

  36. © Hitachi, Ltd. 2021. All rights reserved.
    References
    ▪ John Porcaro, “Observability (re)defined”, https://www.humio.com/whats-new/blog/observability-redefined, 2019
    ▪ Betsy Beyer, Chris Jones, Niall Richard Murphy, Jennifer Petoff, “Site Reliability Engineering”, O'Reilly Media, Inc., 2017
    ▪ Mike Julian, “Practical Monitoring”, O'Reilly Media, Inc., 2017
    ▪ Cindy Sridharan, “Distributed Systems Observability”, O'Reilly Media, Inc., 2018
    ▪ Charity Majors, Liz Fong-Jones, George Miranda, “Observability Engineering”, O'Reilly Media, Inc., 2022(Early Release)
    ▪ Cindy Sridharan, “Monitoring in the time of Cloud Native”, https://copyconstruct.medium.com/monitoring-in-the-time-of-
    cloud-native-c87c7a5bfa3e, 2017
    ▪ “Istio”, https://istio.io/latest/, Istio Authors, 2021
    ▪ Megan O’Keefe, “Istio by Example!”, https://www.istiobyexample.dev/, 2021
    ▪ “kube-prometheus”, https://github.com/prometheus-operator/kube-prometheus, prometheus-operator, 2021
    ▪ “grafana-operator”, https://github.com/integr8ly/grafana-operator, integr8ly, 2021
    ▪ “Tempo Documentation”, https://grafana.com/docs/tempo/latest/, Grafana Labs, 2021
    ▪ “jaeger-operator”, https://github.com/jaegertracing/jaeger-operator, jaegertracing, 2021
    ▪ “Installation Guide”, https://kiali.io/documentation/latest/installation-guide/, Kiali, 2021
    ▪ “operator-lifecycle-manager”, https://github.com/operator-framework/operator-lifecycle-manager, operator-framework, 2021
    ▪ Benjamin H. Sigelman, etc., “Dapper, a Large-Scale Distributed Systems Tracing Infrastructure”, Google Technical Report (2010)
    35

    View Slide

  37. © Hitachi, Ltd. 2021. All rights reserved.
    Trademarks
    ▪ Istio is a registered trademark of Google LLC
    ▪ Envoy Proxy is a registered trademark of
    The Linux Foundation
    ▪ Kubernetes is a registered trademark of
    The Linux Foundation
    ▪ Prometheus is a registered trademark of
    The Linux Foundation
    ▪ Grafana is a registered trademark of Grafana
    Labs
    ▪ Grafana Loki is a registered trademark of
    Grafana Labs
    ▪ Jaeger is a registered trademark of
    The Linux Foundation
    ▪ Kiali is a registered trademark of Red Hat, Inc.
    ▪ Datadog is a registered trademark of Datadog,
    Inc.
    ▪ StackDriver is a registered trademark of Google
    LLC
    ▪ Dynatrace is a registered trademark of
    Dynatrace LLC
    ▪ OpenTracing is a registered trademark of
    The Linux Foundation
    ▪ All other company names, product names,
    service names, and other proper nouns
    mentioned herein are trademarks or registered
    trademarks of their respective companies
    ▪ TM and 🄬 marks are not indicated in the text
    and figures in this presentation
    36

    View Slide

  38. © Hitachi, Ltd. 2021. All rights reserved.
    Appendix

    View Slide

  39. © Hitachi, Ltd. 2021. All rights reserved.
    Observability from Different Perspectives
    38
    ▪ The goal of observability is “dealing with unknown phenomena”
    ▪ There are other perspectives besides collecting data to achieve the goal
    Gaining Insights from Data
    Data Mining、Profiling、
    Dependency Analyzing
    Narrowing the possible range
    of unknown phenomena
    System Design、Testing
    Chaos Engineering
    Getting the data
    Monitoring、Tracing、Logging
    System
    Pheno
    mena
    Data
    Insight
    Deal with

    View Slide

  40. © Hitachi, Ltd. 2021. All rights reserved.
    Classifying Metrics Based on Request or Response
    ▪ Adding URL and HTTP Header attributes to the monitored data (Istio-1.8 ~)
    ▪ It is very powerful because it can increase the resolution of metrics from L4 to L7
    ▪ E.g., Calculate the error rate per URL path, user, and browser type
    39
    Front
    Service
    1. Deploy plugin
    Prometheus
    Request
    Response
    Original Info
    Metrics
    2. Set classifying rule
    ユーザ
    3. Classify
    metrics
    User
    Access
    Assign attributes to
    metrics based on rule
    4. Store metrics

    View Slide

  41. © Hitachi, Ltd. 2021. All rights reserved.
    Google
    Trends in Tracing Standards
    40
    OpenTracing
    OpenCensus
    OpenTelemetry
    W3C Distributed
    Tracing WG
    Refine
    CNCF
    W3C
    Dapper
    Zipkin
    Jaeger
    A paper of distributed
    tracing system in Google
    Dynatrace
    2010
    Standardization of distributed
    tracing (except for data details)
    2016 2019
    Spec and libraries integrated
    OpenCensus and OpenTracing
    Various OSS/Products
    Stan-
    dardize
    Derive
    Integrate
    Integrate
    2020
    Standardization of
    tracing data structures
    Standardize Feedback
    A library of distributed
    tracing and monitoring

    View Slide

  42. View Slide