Upgrade to Pro — share decks privately, control downloads, hide ads and more …

Drawing the Performance of Your Web App

Jeanette
November 20, 2015

Drawing the Performance of Your Web App

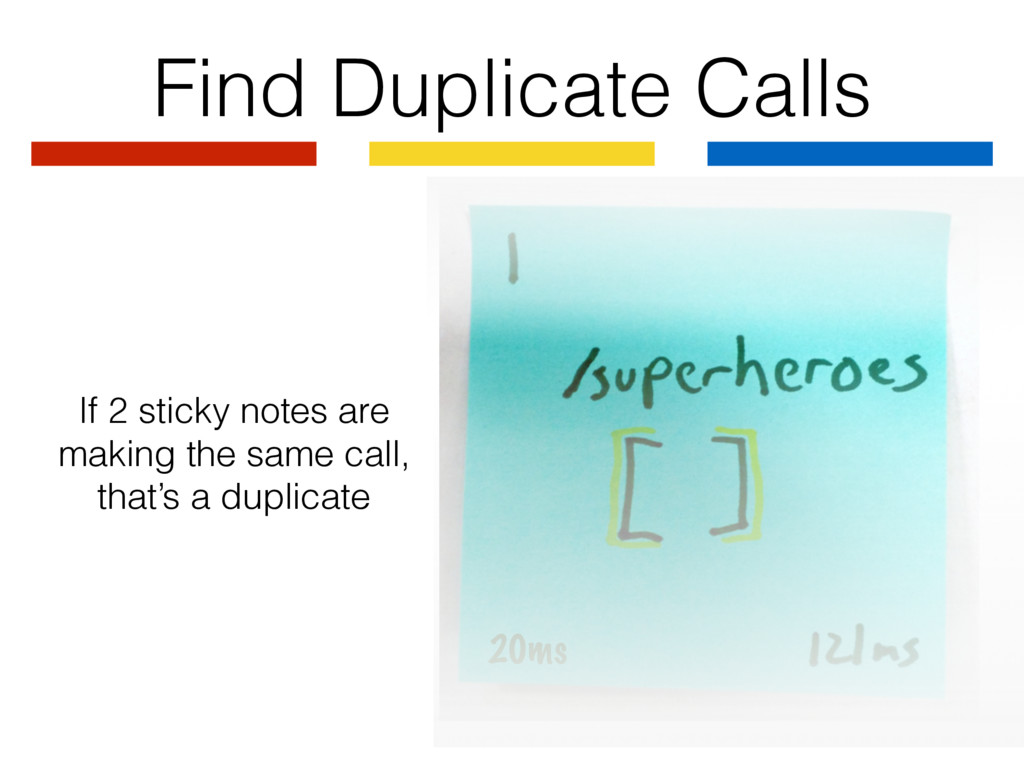
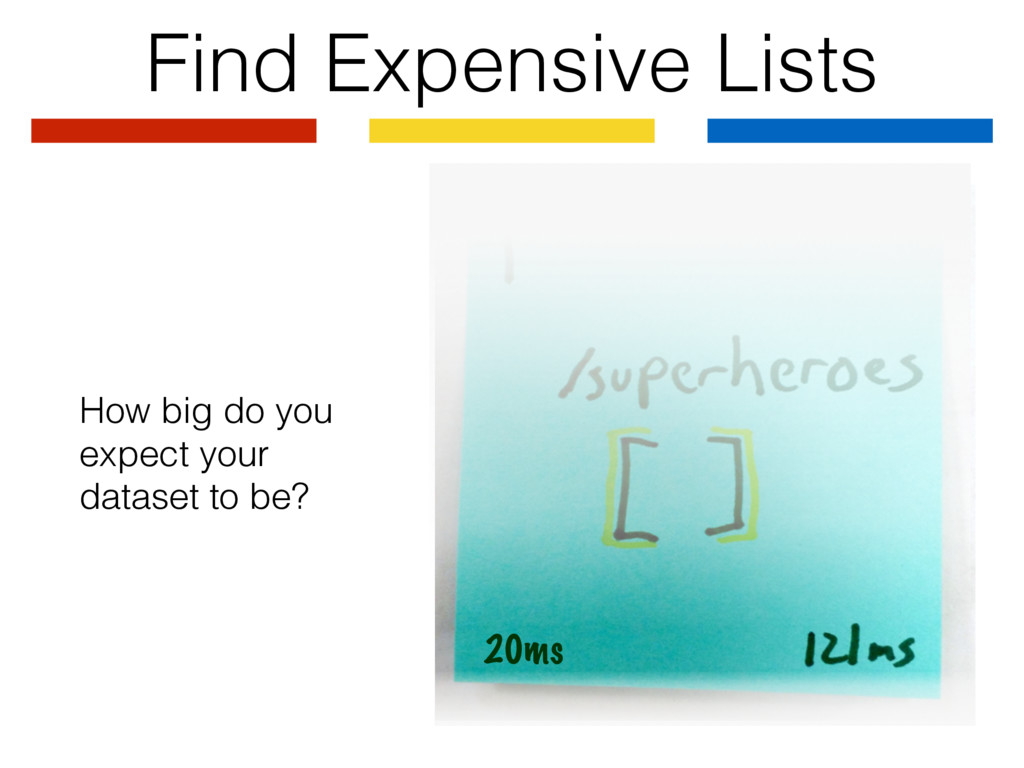
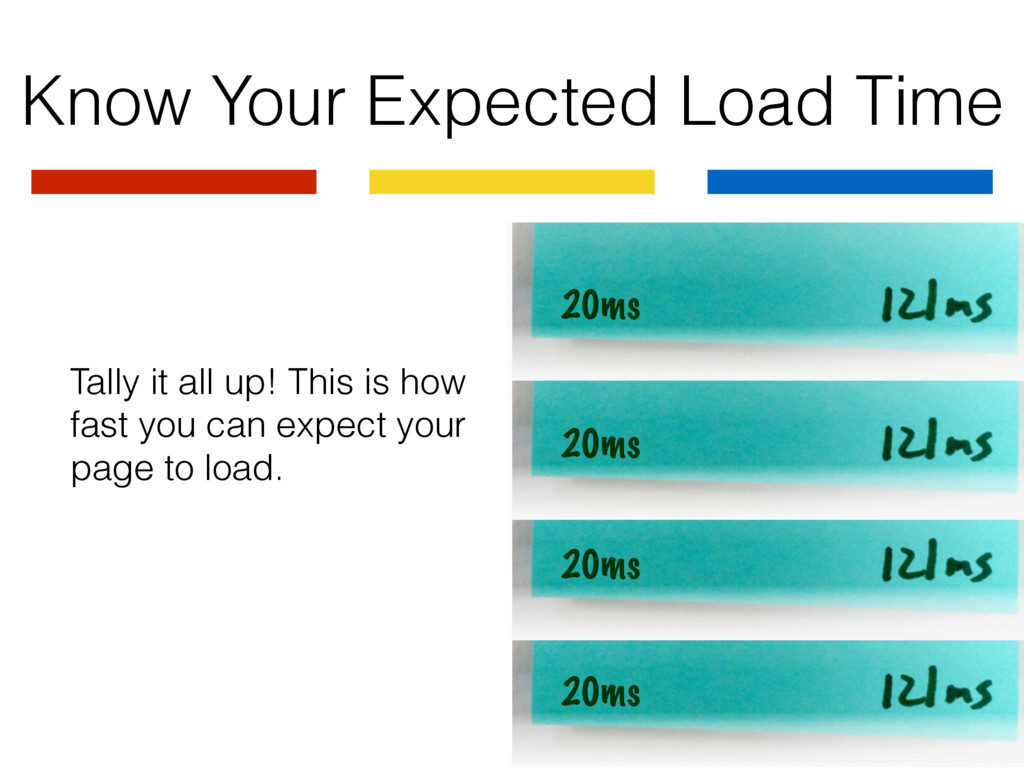
Lightning talk presented at SEM.js about how to visualize and implement better web app performance. https://spin.atomicobject.com/2015/09/01/optimize-web-app-performance/

Jeanette

November 20, 2015
Tweet

More Decks by Jeanette

Other Decks in Technology

Transcript

  1. Drawing the
    Performance of Your
    Web App
    Jeanette Head from Atomic Object
    @JeanetteHead17

    View Slide

  2. View Slide

  3. Materials List
    • Big Paper or Whiteboard
    • Post Its
    • Colorful Markers (not required, but nice)

    View Slide

  4. Step 1: Draw It
    Draw…
    All visible pieces of data
    Buttons that load more data
    Modals

    View Slide

  5. Step 2: Load It
    With the network tab open, load
    the page you just drew

    View Slide

  6. Step 3: Record it
    What call was made?
    When was the
    call made? (1st)
    Did it return a list
    of data? (yes)
    How long did it take?
    How much longer does it
    take if 1 item is added? 20ms

    View Slide

  7. Step 4: Stick It

    View Slide

  8. Analysis

    View Slide

  9. 20ms
    Find Duplicate Calls
    If 2 sticky notes are
    making the same call,
    that’s a duplicate

    View Slide

  10. Find Expensive Calls
    20ms
    Compare the times
    each request takes
    to complete

    View Slide

  11. Find Expensive Lists
    How big do you
    expect your
    dataset to be?
    20ms

    View Slide

  12. Tally it all up! This is how
    fast you can expect your
    page to load.
    20ms
    20ms
    20ms
    20ms
    Know Your Expected Load Time

    View Slide

  13. Diagram Full of Sticky Notes
    but No Unneeded Calls?
    Re think your API
    Re think your design

    View Slide

  14. That’s All, Folks!
    Jeanette Head from Atomic Object
    @JeanetteHead17

    View Slide