of publicly available codes 3. An information theoretic approach to making robust predictions 4. Minimal working example: single field axion monodromy title page image by Eric Nyquist for Quanta Magazine How can we make predictions when the inflation model is not simple?
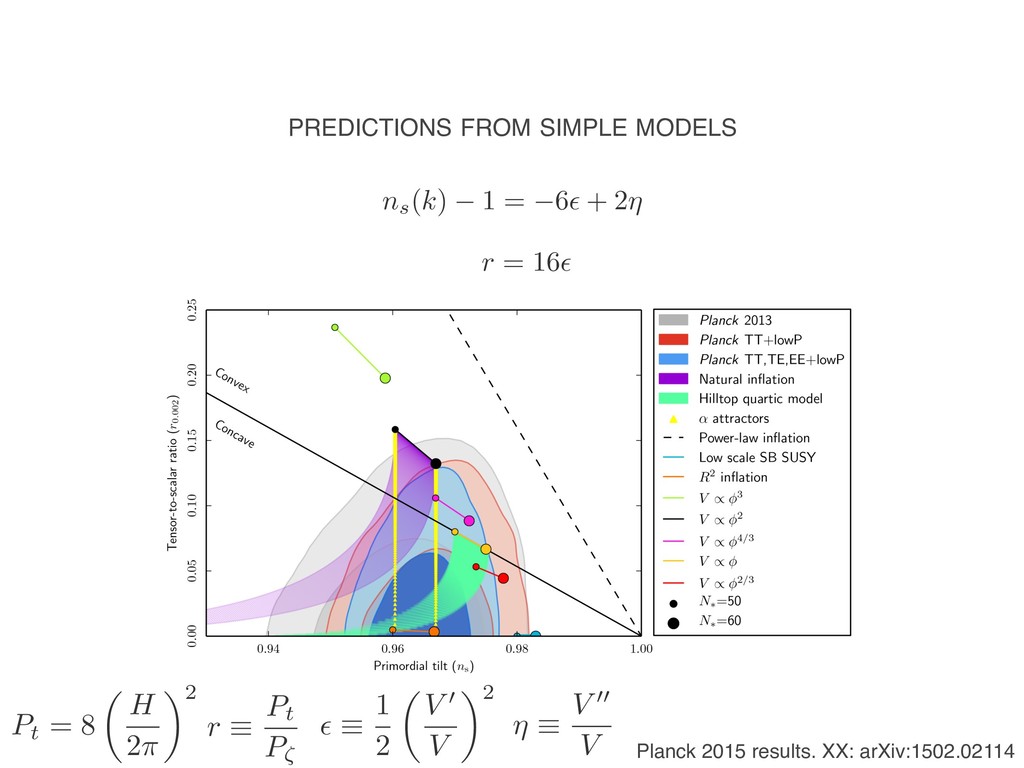
regions for (✏1 , ✏2 , ✏3 ) (top panels) and (✏V , ⌘V , ⇠2 V ) (bottom panels) for Planck TT+lowP (red contours), Planck TT,TE,EE+lowP (blue contours), and compared with the Planck 2013 results (grey contours). Fig. 12. Marginalized joint 68 % and 95 % CL regions for ns and r0.002 from Planck in combination with other data sets, compared to the theoretical predictions of selected inflationary models. Planck 2015 results. XX: arXiv:1502.02114 ns(k) 1 = 6✏ + 2⌘ r = 16✏ PREDICTIONS FROM SIMPLE MODELS r ⌘ Pt P⇣ Pt = 8 ✓ H 2⇡ ◆2 ⌘ ⌘ V 00 V ✏ ⌘ 1 2 ✓ V 0 V ◆2
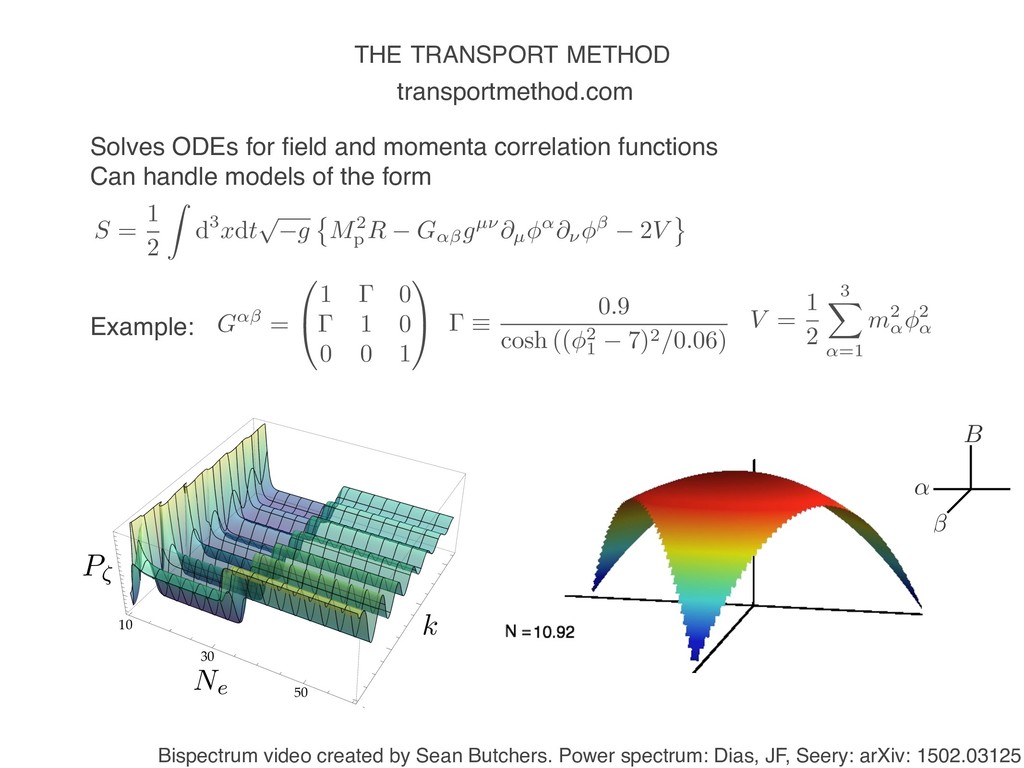
field models may require a numerical approach if • Model has multiple parameters • There are deviations from slow-roll when relevant scales exit the horizon Models with more than than one “active” field (multifield) typically require numerics as dynamics are much richer e.g. • Sensitivity to initial conditions • Super-horizon evolution of observables due to isocurvature • Particle production • Non-Gaussianity
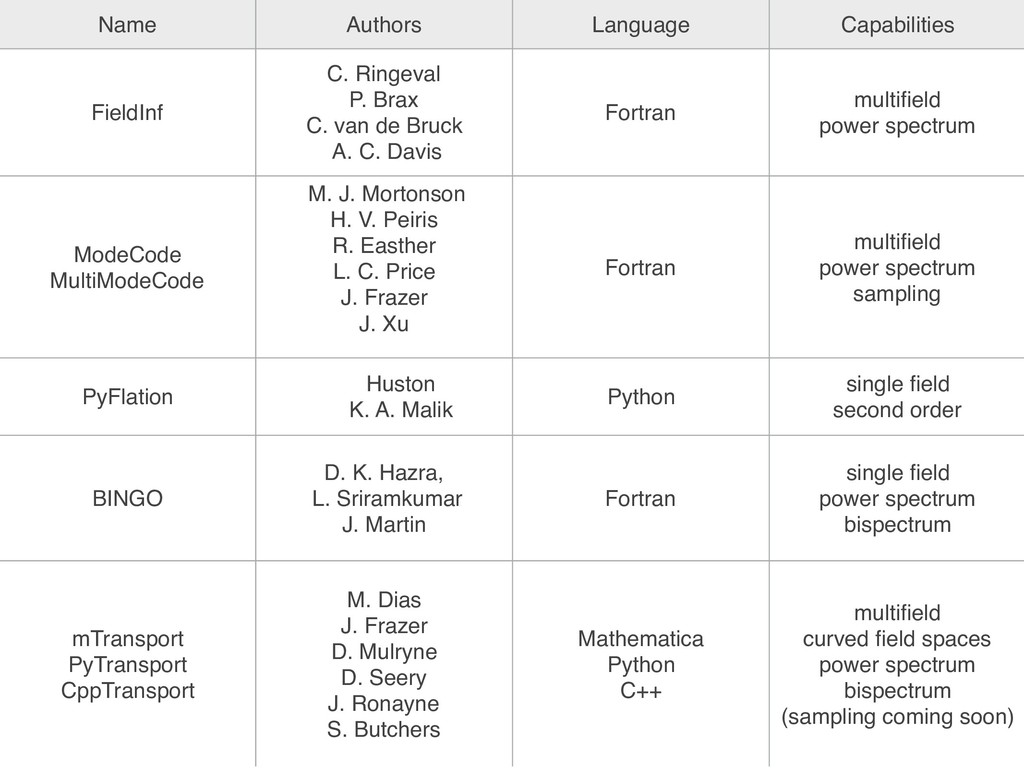
van de Bruck A. C. Davis Fortran multifield power spectrum ModeCode MultiModeCode M. J. Mortonson H. V. Peiris R. Easther L. C. Price J. Frazer J. Xu Fortran multifield power spectrum sampling PyFlation Huston K. A. Malik Python single field second order BINGO D. K. Hazra, L. Sriramkumar J. Martin Fortran single field power spectrum bispectrum mTransport PyTransport CppTransport M. Dias J. Frazer D. Mulryne D. Seery J. Ronayne S. Butchers Mathematica Python C++ multifield curved field spaces power spectrum bispectrum (sampling coming soon)
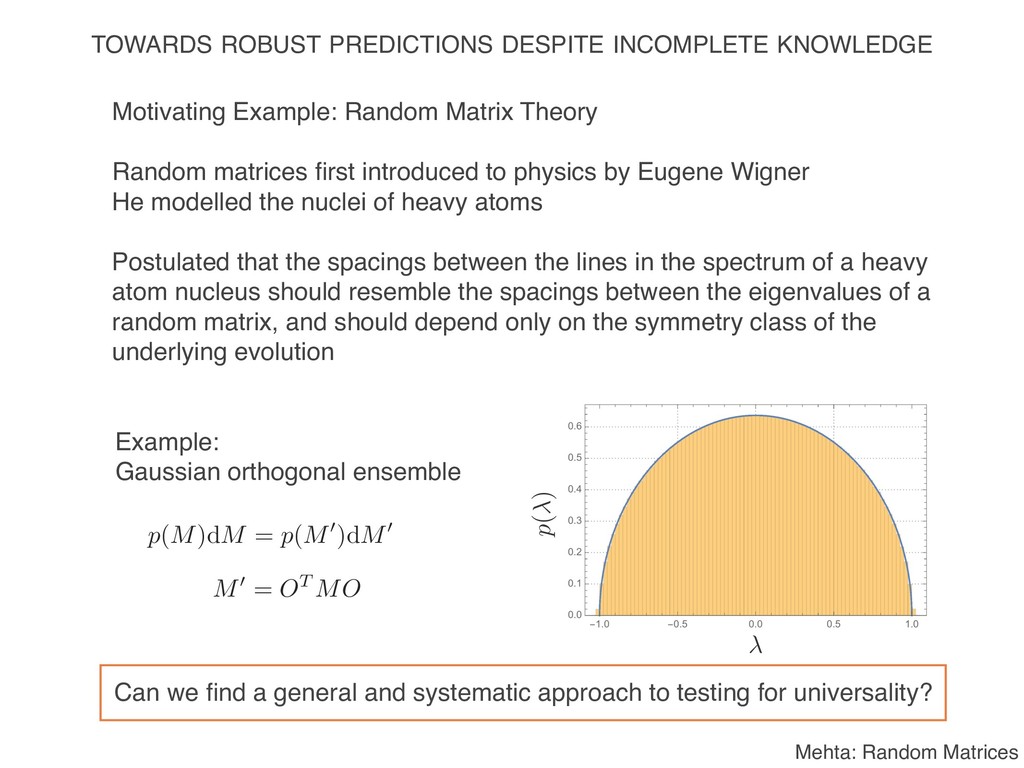
physics by Eugene Wigner He modelled the nuclei of heavy atoms Postulated that the spacings between the lines in the spectrum of a heavy atom nucleus should resemble the spacings between the eigenvalues of a random matrix, and should depend only on the symmetry class of the underlying evolution M 0 = O T MO TOWARDS ROBUST PREDICTIONS DESPITE INCOMPLETE KNOWLEDGE Example: Gaussian orthogonal ensemble Mehta: Random Matrices p( ) <latexit sha1_base64="UTDVACEQOwmRjs0o+TvCPSa3FHA=">AAAB8HicdVDLSsNAFL2pr1pfVZduBotQNyEpBe2u4MZlBWOLbSiTyaQdOpmEmYlQQv/CjQsVt36OO//GSVvB54VhDuecy733BClnSjvOu1VaWV1b3yhvVra2d3b3qvsHNyrJJKEeSXgiewFWlDNBPc00p71UUhwHnHaDyUWhd++oVCwR13qaUj/GI8EiRrA21G1aH3BjDvHpsFpz7IZTFPoNXHv+OzVYVmdYfRuECcliKjThWKm+66Taz7HUjHA6qwwyRVNMJnhE+wYKHFPl5/ONZ+jEMCGKEmme0GjOfu3IcazUNA6MM8Z6rH5qBfmX1s90dO7nTKSZpoIsBkUZRzpBxfkoZJISzacGYCKZ2RWRMZaYaBNSxYTweSn6H3gNu2W7V81au7VMowxHcAx1cOEM2nAJHfCAgIB7eIQnS1kP1rP1srCWrGXPIXwr6/UDSXWQLQ==</latexit> <latexit sha1_base64="UTDVACEQOwmRjs0o+TvCPSa3FHA=">AAAB8HicdVDLSsNAFL2pr1pfVZduBotQNyEpBe2u4MZlBWOLbSiTyaQdOpmEmYlQQv/CjQsVt36OO//GSVvB54VhDuecy733BClnSjvOu1VaWV1b3yhvVra2d3b3qvsHNyrJJKEeSXgiewFWlDNBPc00p71UUhwHnHaDyUWhd++oVCwR13qaUj/GI8EiRrA21G1aH3BjDvHpsFpz7IZTFPoNXHv+OzVYVmdYfRuECcliKjThWKm+66Taz7HUjHA6qwwyRVNMJnhE+wYKHFPl5/ONZ+jEMCGKEmme0GjOfu3IcazUNA6MM8Z6rH5qBfmX1s90dO7nTKSZpoIsBkUZRzpBxfkoZJISzacGYCKZ2RWRMZaYaBNSxYTweSn6H3gNu2W7V81au7VMowxHcAx1cOEM2nAJHfCAgIB7eIQnS1kP1rP1srCWrGXPIXwr6/UDSXWQLQ==</latexit> <latexit sha1_base64="UTDVACEQOwmRjs0o+TvCPSa3FHA=">AAAB8HicdVDLSsNAFL2pr1pfVZduBotQNyEpBe2u4MZlBWOLbSiTyaQdOpmEmYlQQv/CjQsVt36OO//GSVvB54VhDuecy733BClnSjvOu1VaWV1b3yhvVra2d3b3qvsHNyrJJKEeSXgiewFWlDNBPc00p71UUhwHnHaDyUWhd++oVCwR13qaUj/GI8EiRrA21G1aH3BjDvHpsFpz7IZTFPoNXHv+OzVYVmdYfRuECcliKjThWKm+66Taz7HUjHA6qwwyRVNMJnhE+wYKHFPl5/ONZ+jEMCGKEmme0GjOfu3IcazUNA6MM8Z6rH5qBfmX1s90dO7nTKSZpoIsBkUZRzpBxfkoZJISzacGYCKZ2RWRMZaYaBNSxYTweSn6H3gNu2W7V81au7VMowxHcAx1cOEM2nAJHfCAgIB7eIQnS1kP1rP1srCWrGXPIXwr6/UDSXWQLQ==</latexit> <latexit sha1_base64="UTDVACEQOwmRjs0o+TvCPSa3FHA=">AAAB8HicdVDLSsNAFL2pr1pfVZduBotQNyEpBe2u4MZlBWOLbSiTyaQdOpmEmYlQQv/CjQsVt36OO//GSVvB54VhDuecy733BClnSjvOu1VaWV1b3yhvVra2d3b3qvsHNyrJJKEeSXgiewFWlDNBPc00p71UUhwHnHaDyUWhd++oVCwR13qaUj/GI8EiRrA21G1aH3BjDvHpsFpz7IZTFPoNXHv+OzVYVmdYfRuECcliKjThWKm+66Taz7HUjHA6qwwyRVNMJnhE+wYKHFPl5/ONZ+jEMCGKEmme0GjOfu3IcazUNA6MM8Z6rH5qBfmX1s90dO7nTKSZpoIsBkUZRzpBxfkoZJISzacGYCKZ2RWRMZaYaBNSxYTweSn6H3gNu2W7V81au7VMowxHcAx1cOEM2nAJHfCAgIB7eIQnS1kP1rP1srCWrGXPIXwr6/UDSXWQLQ==</latexit> <latexit sha1_base64="5d1GLQCQdgCCSOGikYh9KiXG2F8=">AAAB7XicdVDLSgMxFL2pr1pfVZdugkVwNcwUQbsruHFZwbGFdiiZTKYNzWSGJCOUoR/hxoWKW//HnX9jpq3g80LI4ZxzufeeMBNcG9d9R5WV1bX1jepmbWt7Z3evvn9wq9NcUebTVKSqFxLNBJfMN9wI1ssUI0koWDecXJZ6944pzVN5Y6YZCxIykjzmlBhLdQfCWiMyrDdcp+mWhX8Dz5n/bgOW1RnW3wZRSvOESUMF0brvuZkJCqIMp4LNaoNcs4zQCRmxvoWSJEwHxXzdGT6xTITjVNknDZ6zXzsKkmg9TULrTIgZ659aSf6l9XMTXwQFl1lumKSLQXEusElxeTuOuGLUiKkFhCpud8V0TBShxiZUsyF8Xor/B37TaTne9Vmj3VqmUYUjOIZT8OAc2nAFHfCBwgTu4RGeUIYe0DN6WVgraNlzCN8KvX4ArtSPTg==</latexit> <latexit sha1_base64="5d1GLQCQdgCCSOGikYh9KiXG2F8=">AAAB7XicdVDLSgMxFL2pr1pfVZdugkVwNcwUQbsruHFZwbGFdiiZTKYNzWSGJCOUoR/hxoWKW//HnX9jpq3g80LI4ZxzufeeMBNcG9d9R5WV1bX1jepmbWt7Z3evvn9wq9NcUebTVKSqFxLNBJfMN9wI1ssUI0koWDecXJZ6944pzVN5Y6YZCxIykjzmlBhLdQfCWiMyrDdcp+mWhX8Dz5n/bgOW1RnW3wZRSvOESUMF0brvuZkJCqIMp4LNaoNcs4zQCRmxvoWSJEwHxXzdGT6xTITjVNknDZ6zXzsKkmg9TULrTIgZ659aSf6l9XMTXwQFl1lumKSLQXEusElxeTuOuGLUiKkFhCpud8V0TBShxiZUsyF8Xor/B37TaTne9Vmj3VqmUYUjOIZT8OAc2nAFHfCBwgTu4RGeUIYe0DN6WVgraNlzCN8KvX4ArtSPTg==</latexit> <latexit sha1_base64="5d1GLQCQdgCCSOGikYh9KiXG2F8=">AAAB7XicdVDLSgMxFL2pr1pfVZdugkVwNcwUQbsruHFZwbGFdiiZTKYNzWSGJCOUoR/hxoWKW//HnX9jpq3g80LI4ZxzufeeMBNcG9d9R5WV1bX1jepmbWt7Z3evvn9wq9NcUebTVKSqFxLNBJfMN9wI1ssUI0koWDecXJZ6944pzVN5Y6YZCxIykjzmlBhLdQfCWiMyrDdcp+mWhX8Dz5n/bgOW1RnW3wZRSvOESUMF0brvuZkJCqIMp4LNaoNcs4zQCRmxvoWSJEwHxXzdGT6xTITjVNknDZ6zXzsKkmg9TULrTIgZ659aSf6l9XMTXwQFl1lumKSLQXEusElxeTuOuGLUiKkFhCpud8V0TBShxiZUsyF8Xor/B37TaTne9Vmj3VqmUYUjOIZT8OAc2nAFHfCBwgTu4RGeUIYe0DN6WVgraNlzCN8KvX4ArtSPTg==</latexit> <latexit sha1_base64="5d1GLQCQdgCCSOGikYh9KiXG2F8=">AAAB7XicdVDLSgMxFL2pr1pfVZdugkVwNcwUQbsruHFZwbGFdiiZTKYNzWSGJCOUoR/hxoWKW//HnX9jpq3g80LI4ZxzufeeMBNcG9d9R5WV1bX1jepmbWt7Z3evvn9wq9NcUebTVKSqFxLNBJfMN9wI1ssUI0koWDecXJZ6944pzVN5Y6YZCxIykjzmlBhLdQfCWiMyrDdcp+mWhX8Dz5n/bgOW1RnW3wZRSvOESUMF0brvuZkJCqIMp4LNaoNcs4zQCRmxvoWSJEwHxXzdGT6xTITjVNknDZ6zXzsKkmg9TULrTIgZ659aSf6l9XMTXwQFl1lumKSLQXEusElxeTuOuGLUiKkFhCpud8V0TBShxiZUsyF8Xor/B37TaTne9Vmj3VqmUYUjOIZT8OAc2nAFHfCBwgTu4RGeUIYe0DN6WVgraNlzCN8KvX4ArtSPTg==</latexit> Can we find a general and systematic approach to testing for universality? p(M)dM = p(M0)dM0 <latexit sha1_base64="uOb2TmhkyBK1UGdPHxwDNsR2jmQ=">AAACB3icdVBNS0JBFJ3Xp9mX1bJFQxLaRt4zzVwEQps2gkGmoA+ZN446OO+Dmfsiebhs019p06KibX+hXf+mUV/0QR24cOace5l7jxMIrsA03425+YXFpeXESnJ1bX1jM7W1faX8UFJWp77wZdMhignusTpwEKwZSEZcR7CGMzyb+I1rJhX3vUsYBcx2Sd/jPU4JaKmT2guy1cM2sBuIuuMqPsX6nfkSMp1U2sxZhaN8oYg1KZr5YzMm+RK2cuYUaRSj1km9tbs+DV3mARVEqZZlBmBHRAKngo2T7VCxgNAh6bOWph5xmbKj6SFjfKCVLu75UpcHeKp+n4iIq9TIdXSnS2CgfnsT8S+vFULvxI64F4TAPDr7qBcKDD6epIK7XDIKYqQJoZLrXTEdEEko6OySOoTPS/H/pJ7PlXPWRSFdKcdpJNAu2kdZZKESqqBzVEN1RNEtukeP6Mm4Mx6MZ+Nl1jpnxDM76AeM1w8pLJhZ</latexit> <latexit sha1_base64="uOb2TmhkyBK1UGdPHxwDNsR2jmQ=">AAACB3icdVBNS0JBFJ3Xp9mX1bJFQxLaRt4zzVwEQps2gkGmoA+ZN446OO+Dmfsiebhs019p06KibX+hXf+mUV/0QR24cOace5l7jxMIrsA03425+YXFpeXESnJ1bX1jM7W1faX8UFJWp77wZdMhignusTpwEKwZSEZcR7CGMzyb+I1rJhX3vUsYBcx2Sd/jPU4JaKmT2guy1cM2sBuIuuMqPsX6nfkSMp1U2sxZhaN8oYg1KZr5YzMm+RK2cuYUaRSj1km9tbs+DV3mARVEqZZlBmBHRAKngo2T7VCxgNAh6bOWph5xmbKj6SFjfKCVLu75UpcHeKp+n4iIq9TIdXSnS2CgfnsT8S+vFULvxI64F4TAPDr7qBcKDD6epIK7XDIKYqQJoZLrXTEdEEko6OySOoTPS/H/pJ7PlXPWRSFdKcdpJNAu2kdZZKESqqBzVEN1RNEtukeP6Mm4Mx6MZ+Nl1jpnxDM76AeM1w8pLJhZ</latexit> <latexit sha1_base64="uOb2TmhkyBK1UGdPHxwDNsR2jmQ=">AAACB3icdVBNS0JBFJ3Xp9mX1bJFQxLaRt4zzVwEQps2gkGmoA+ZN446OO+Dmfsiebhs019p06KibX+hXf+mUV/0QR24cOace5l7jxMIrsA03425+YXFpeXESnJ1bX1jM7W1faX8UFJWp77wZdMhignusTpwEKwZSEZcR7CGMzyb+I1rJhX3vUsYBcx2Sd/jPU4JaKmT2guy1cM2sBuIuuMqPsX6nfkSMp1U2sxZhaN8oYg1KZr5YzMm+RK2cuYUaRSj1km9tbs+DV3mARVEqZZlBmBHRAKngo2T7VCxgNAh6bOWph5xmbKj6SFjfKCVLu75UpcHeKp+n4iIq9TIdXSnS2CgfnsT8S+vFULvxI64F4TAPDr7qBcKDD6epIK7XDIKYqQJoZLrXTEdEEko6OySOoTPS/H/pJ7PlXPWRSFdKcdpJNAu2kdZZKESqqBzVEN1RNEtukeP6Mm4Mx6MZ+Nl1jpnxDM76AeM1w8pLJhZ</latexit> <latexit sha1_base64="uOb2TmhkyBK1UGdPHxwDNsR2jmQ=">AAACB3icdVBNS0JBFJ3Xp9mX1bJFQxLaRt4zzVwEQps2gkGmoA+ZN446OO+Dmfsiebhs019p06KibX+hXf+mUV/0QR24cOace5l7jxMIrsA03425+YXFpeXESnJ1bX1jM7W1faX8UFJWp77wZdMhignusTpwEKwZSEZcR7CGMzyb+I1rJhX3vUsYBcx2Sd/jPU4JaKmT2guy1cM2sBuIuuMqPsX6nfkSMp1U2sxZhaN8oYg1KZr5YzMm+RK2cuYUaRSj1km9tbs+DV3mARVEqZZlBmBHRAKngo2T7VCxgNAh6bOWph5xmbKj6SFjfKCVLu75UpcHeKp+n4iIq9TIdXSnS2CgfnsT8S+vFULvxI64F4TAPDr7qBcKDD6epIK7XDIKYqQJoZLrXTEdEEko6OySOoTPS/H/pJ7PlXPWRSFdKcdpJNAu2kdZZKESqqBzVEN1RNEtukeP6Mm4Mx6MZ+Nl1jpnxDM76AeM1w8pLJhZ</latexit>
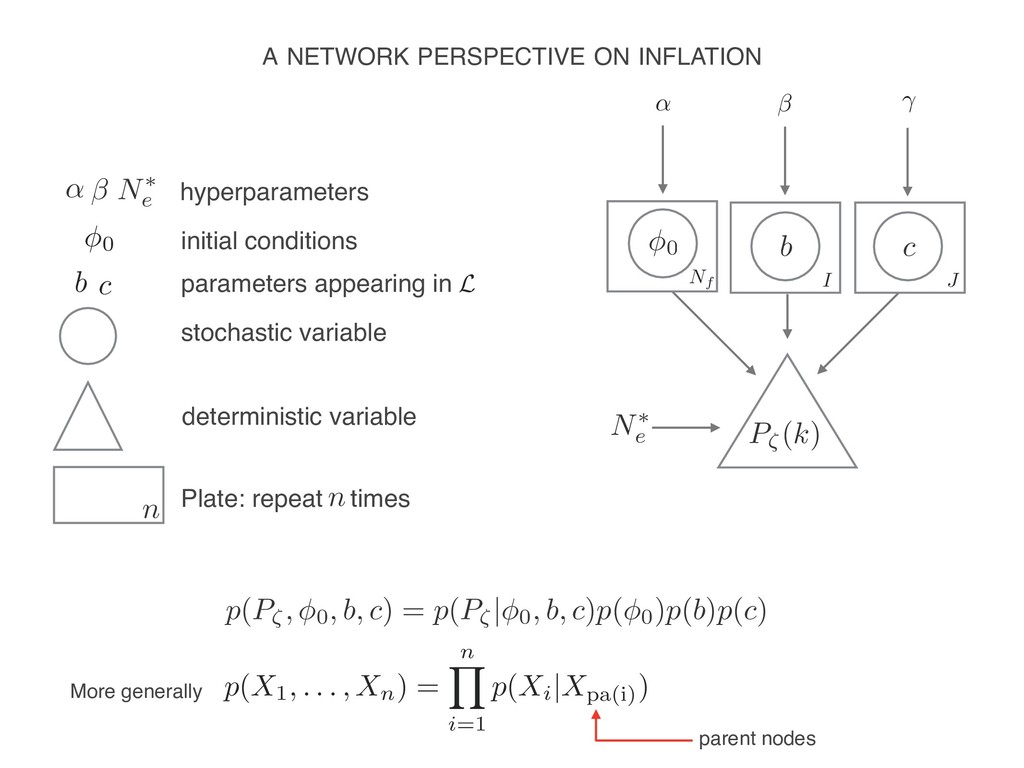
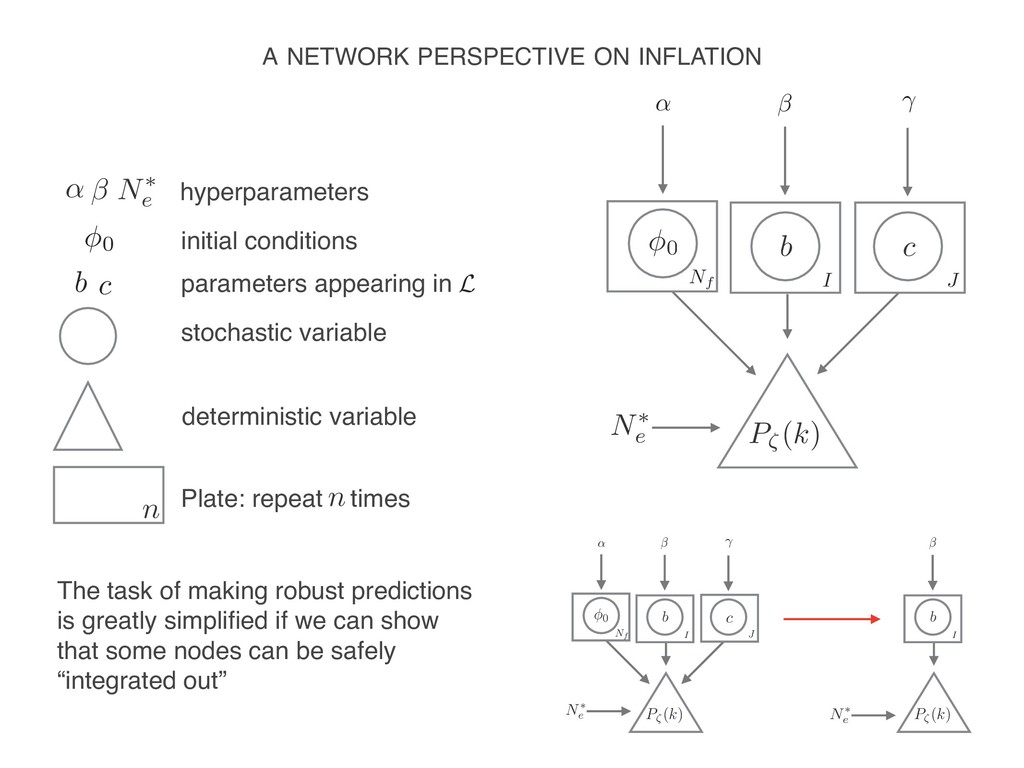
p(P⇣ | 0, b, c)p( 0)p(b)p(c) 0 P⇣(k) N⇤ e c b Nf J I ↵ ↵ hyperparameters stochastic variable deterministic variable Plate: repeat times n n N⇤ e 0 b c parameters appearing in initial conditions L p(X1, . . . , Xn) = n Y i=1 p(Xi |Xpa(i) ) <latexit sha1_base64="F3D1EpgQpHSPkwV+aWxuZuRztoo=">AAACI3icdVDLSgMxFM34rPVVdekmWIQWSpmprVWkUnDjsoK1hbYOmTRtQzOZkGSEMs7HuPFX3LjQ4saF/2L6EFT0QMLJuedyc48nGFXatt+thcWl5ZXVxFpyfWNzazu1s3ujglBiUscBC2TTQ4owykldU81IU0iCfI+Rhje8mNQbd0QqGvBrPRKk46M+pz2KkTaSmzoTmaYbOXGu3Q20gjnz4HG20hYy6LoRrTjxrRGmJhrfm7stfShQhmbjrJtK23mneFQolqAhJbtwbM9JoQydvD1FGsxRc1NjMwWHPuEaM6RUy7GF7kRIaooZiZPtUBGB8BD1SctQjnyiOtF0yRgeGqULe4E0h2s4Vb93RMhXauR7xukjPVC/axPxr1or1L2TTkS5CDXheDaoFzKoAzhJDHapJFizkSEIS2r+CvEASYS1yTVpQvjaFP5P6oX8ad65Kqar5/M0EmAfHIAMcEAZVMElqIE6wOABPIEX8Go9Ws/W2HqbWResec8e+AHr4xOrTaRx</latexit> <latexit sha1_base64="F3D1EpgQpHSPkwV+aWxuZuRztoo=">AAACI3icdVDLSgMxFM34rPVVdekmWIQWSpmprVWkUnDjsoK1hbYOmTRtQzOZkGSEMs7HuPFX3LjQ4saF/2L6EFT0QMLJuedyc48nGFXatt+thcWl5ZXVxFpyfWNzazu1s3ujglBiUscBC2TTQ4owykldU81IU0iCfI+Rhje8mNQbd0QqGvBrPRKk46M+pz2KkTaSmzoTmaYbOXGu3Q20gjnz4HG20hYy6LoRrTjxrRGmJhrfm7stfShQhmbjrJtK23mneFQolqAhJbtwbM9JoQydvD1FGsxRc1NjMwWHPuEaM6RUy7GF7kRIaooZiZPtUBGB8BD1SctQjnyiOtF0yRgeGqULe4E0h2s4Vb93RMhXauR7xukjPVC/axPxr1or1L2TTkS5CDXheDaoFzKoAzhJDHapJFizkSEIS2r+CvEASYS1yTVpQvjaFP5P6oX8ad65Kqar5/M0EmAfHIAMcEAZVMElqIE6wOABPIEX8Go9Ws/W2HqbWResec8e+AHr4xOrTaRx</latexit> <latexit sha1_base64="F3D1EpgQpHSPkwV+aWxuZuRztoo=">AAACI3icdVDLSgMxFM34rPVVdekmWIQWSpmprVWkUnDjsoK1hbYOmTRtQzOZkGSEMs7HuPFX3LjQ4saF/2L6EFT0QMLJuedyc48nGFXatt+thcWl5ZXVxFpyfWNzazu1s3ujglBiUscBC2TTQ4owykldU81IU0iCfI+Rhje8mNQbd0QqGvBrPRKk46M+pz2KkTaSmzoTmaYbOXGu3Q20gjnz4HG20hYy6LoRrTjxrRGmJhrfm7stfShQhmbjrJtK23mneFQolqAhJbtwbM9JoQydvD1FGsxRc1NjMwWHPuEaM6RUy7GF7kRIaooZiZPtUBGB8BD1SctQjnyiOtF0yRgeGqULe4E0h2s4Vb93RMhXauR7xukjPVC/axPxr1or1L2TTkS5CDXheDaoFzKoAzhJDHapJFizkSEIS2r+CvEASYS1yTVpQvjaFP5P6oX8ad65Kqar5/M0EmAfHIAMcEAZVMElqIE6wOABPIEX8Go9Ws/W2HqbWResec8e+AHr4xOrTaRx</latexit> <latexit sha1_base64="F3D1EpgQpHSPkwV+aWxuZuRztoo=">AAACI3icdVDLSgMxFM34rPVVdekmWIQWSpmprVWkUnDjsoK1hbYOmTRtQzOZkGSEMs7HuPFX3LjQ4saF/2L6EFT0QMLJuedyc48nGFXatt+thcWl5ZXVxFpyfWNzazu1s3ujglBiUscBC2TTQ4owykldU81IU0iCfI+Rhje8mNQbd0QqGvBrPRKk46M+pz2KkTaSmzoTmaYbOXGu3Q20gjnz4HG20hYy6LoRrTjxrRGmJhrfm7stfShQhmbjrJtK23mneFQolqAhJbtwbM9JoQydvD1FGsxRc1NjMwWHPuEaM6RUy7GF7kRIaooZiZPtUBGB8BD1SctQjnyiOtF0yRgeGqULe4E0h2s4Vb93RMhXauR7xukjPVC/axPxr1or1L2TTkS5CDXheDaoFzKoAzhJDHapJFizkSEIS2r+CvEASYS1yTVpQvjaFP5P6oX8ad65Kqar5/M0EmAfHIAMcEAZVMElqIE6wOABPIEX8Go9Ws/W2HqbWResec8e+AHr4xOrTaRx</latexit> parent nodes More generally
variable Plate: repeat times n n N⇤ e 0 P⇣(k) N⇤ e c b Nf J I ↵ 0 P⇣(k) N⇤ e c b Nf J I ↵ P⇣(k) b I N⇤ e The task of making robust predictions is greatly simplified if we can show that some nodes can be safely “integrated out” 0 b c parameters appearing in initial conditions L
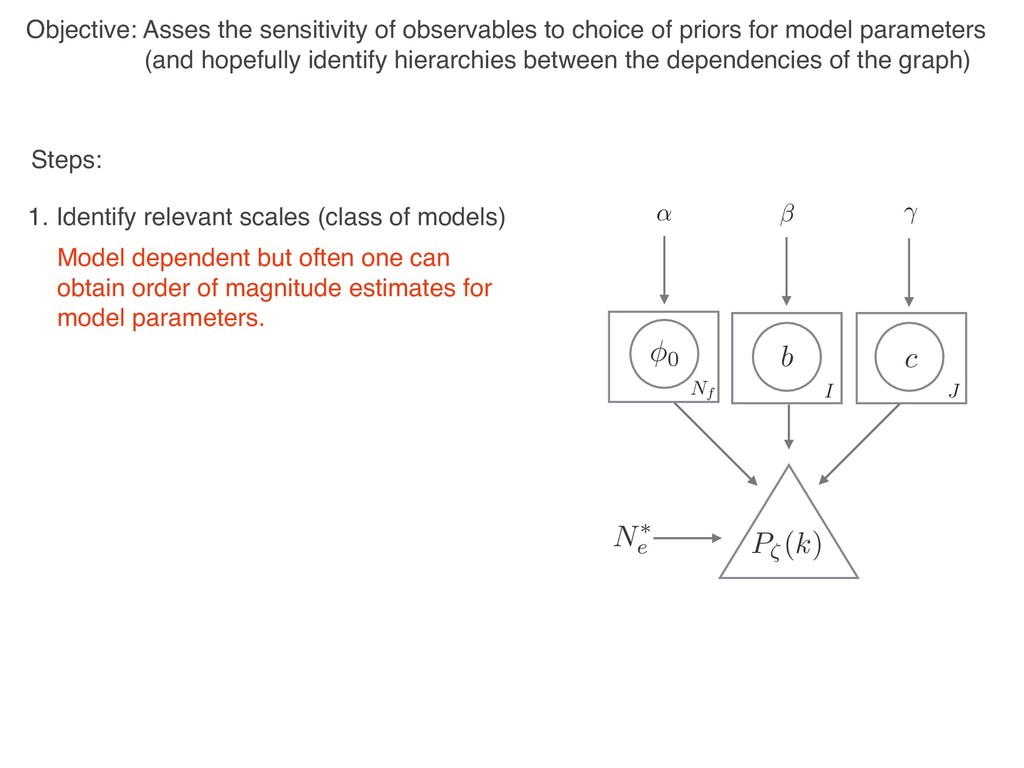
but often one can obtain order of magnitude estimates for model parameters. Objective: Asses the sensitivity of observables to choice of priors for model parameters (and hopefully identify hierarchies between the dependencies of the graph) 0 P⇣(k) N⇤ e c b Nf J I ↵
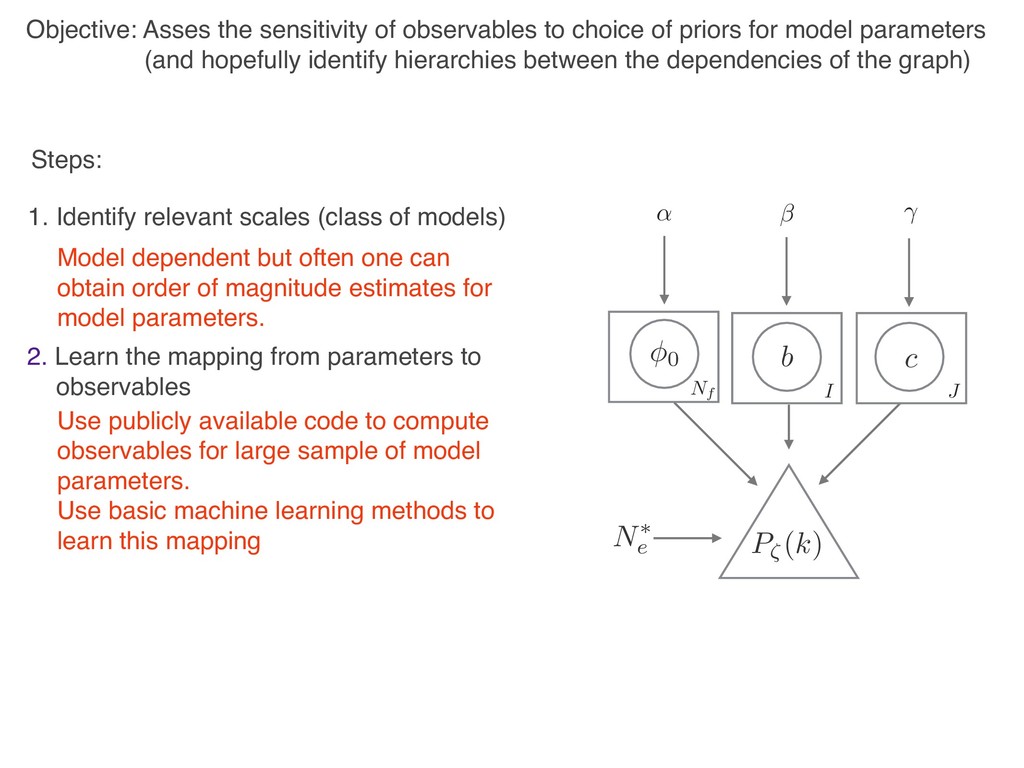
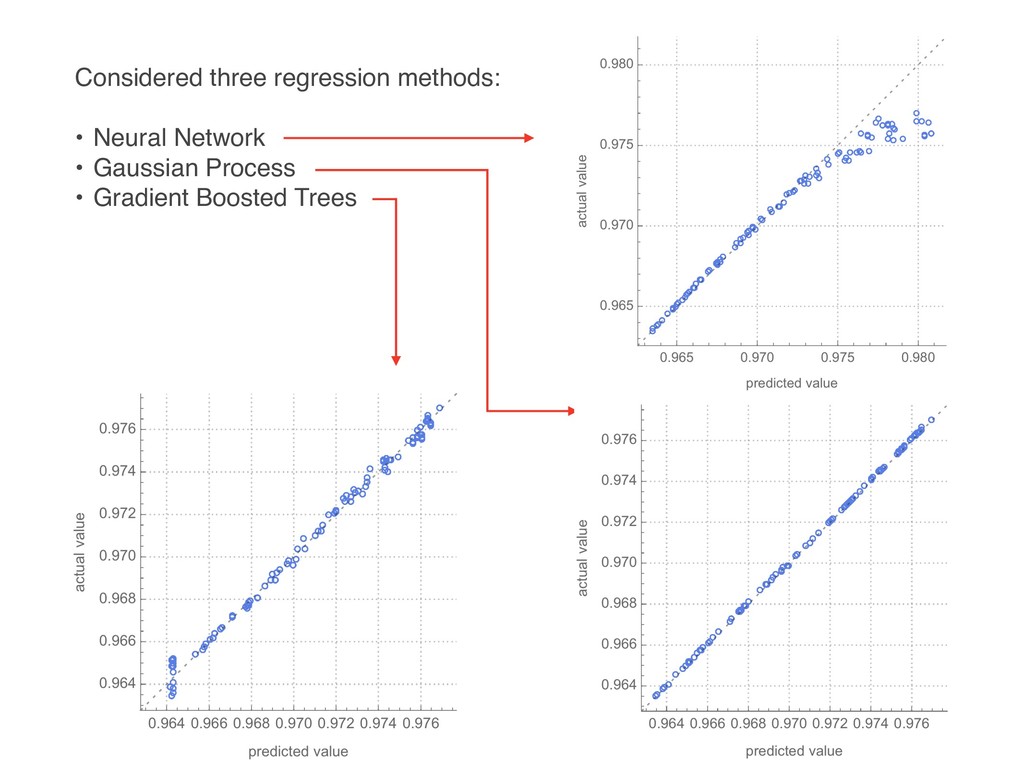
but often one can obtain order of magnitude estimates for model parameters. 2. Learn the mapping from parameters to liobservables Use publicly available code to compute observables for large sample of model parameters. Use basic machine learning methods to learn this mapping Objective: Asses the sensitivity of observables to choice of priors for model parameters (and hopefully identify hierarchies between the dependencies of the graph) 0 P⇣(k) N⇤ e c b Nf J I ↵
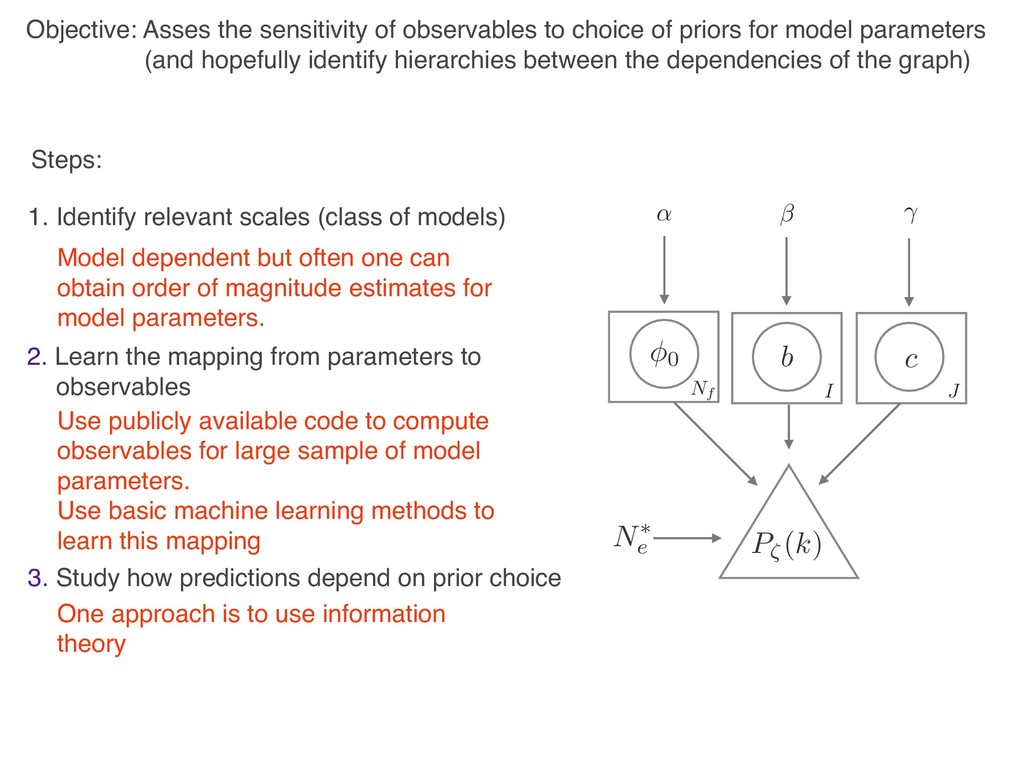
but often one can obtain order of magnitude estimates for model parameters. 2. Learn the mapping from parameters to liobservables Use publicly available code to compute observables for large sample of model parameters. Use basic machine learning methods to learn this mapping 3. Study how predictions depend on prior choice One approach is to use information theory Objective: Asses the sensitivity of observables to choice of priors for model parameters (and hopefully identify hierarchies between the dependencies of the graph) 0 P⇣(k) N⇤ e c b Nf J I ↵
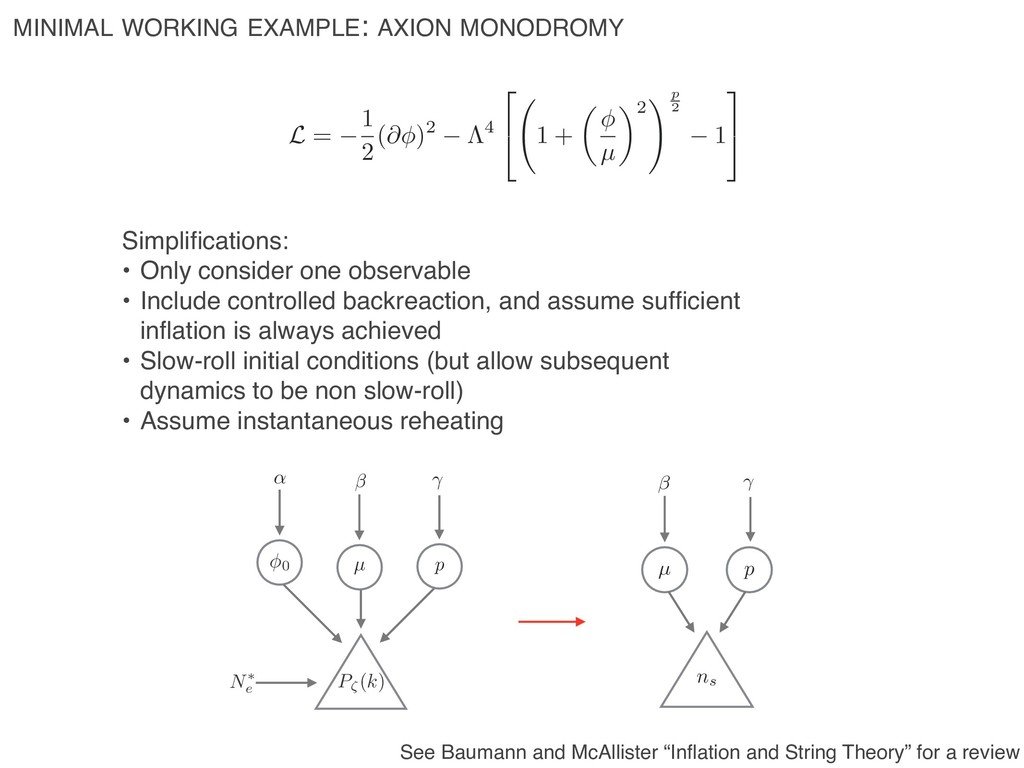
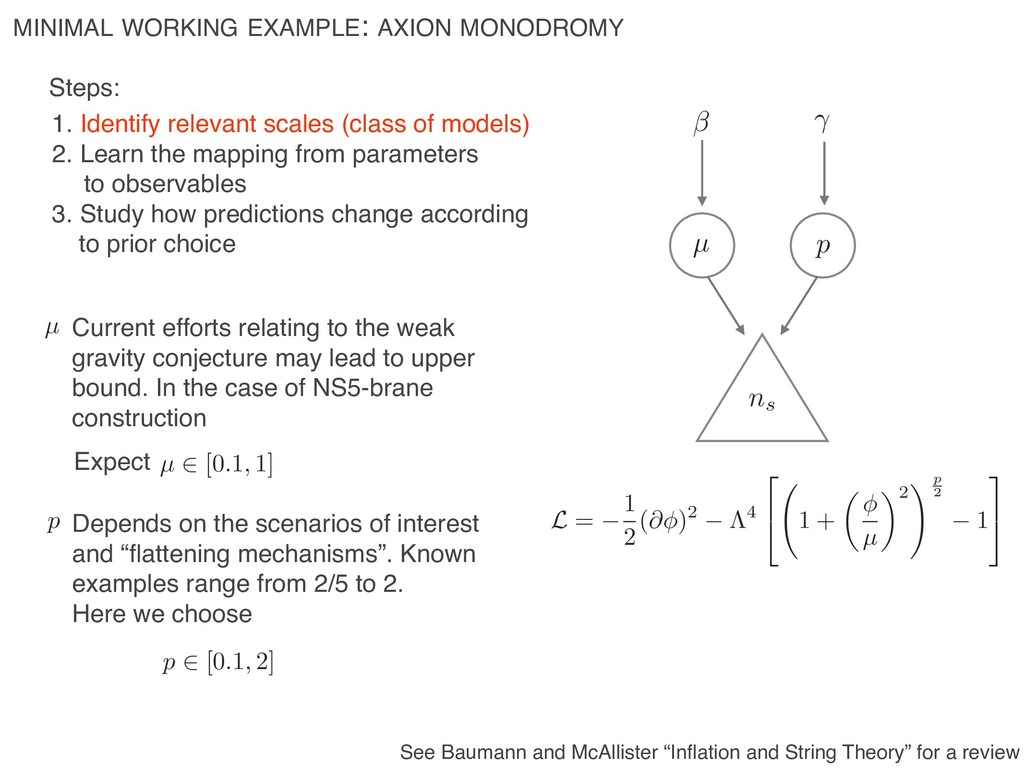
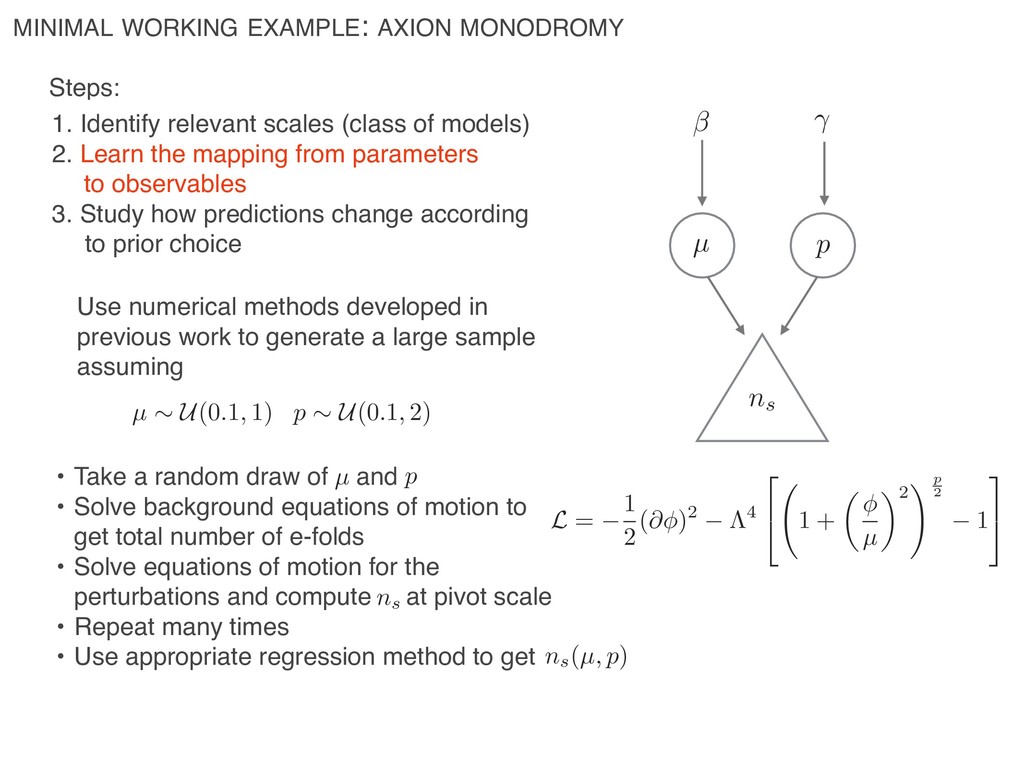
and assume sufficient inflation is always achieved • Slow-roll initial conditions (but allow subsequent dynamics to be non slow-roll) • Assume instantaneous reheating 0 P⇣(k) N⇤ e µ p ↵ µ p ns L = 1 2 (@ )2 ⇤4 2 4 1 + ✓ µ ◆2 !p 2 1 3 5 See Baumann and McAllister “Inflation and String Theory” for a review MINIMAL WORKING EXAMPLE: AXION MONODROMY
mapping from parameters uii to observables 3. Study how predictions change according fff to prior choice Steps: µ Current efforts relating to the weak gravity conjecture may lead to upper bound. In the case of NS5-brane construction µ 2 [0.1, 1] Expect p Depends on the scenarios of interest and “flattening mechanisms”. Known examples range from 2/5 to 2. Here we choose p 2 [0.1, 2] µ p ns L = 1 2 (@ )2 ⇤4 2 4 1 + ✓ µ ◆2 !p 2 1 3 5 See Baumann and McAllister “Inflation and String Theory” for a review MINIMAL WORKING EXAMPLE: AXION MONODROMY
of models) 2. Learn the mapping from parameters uii to observables 3. Study how predictions change according fiff to prior choice Steps: Use numerical methods developed in previous work to generate a large sample assuming µ ⇠ U(0.1, 1) p ⇠ U(0.1, 2) • Take a random draw of and • Solve background equations of motion to get total number of e-folds • Solve equations of motion for the perturbations and compute at pivot scale • Repeat many times • Use appropriate regression method to get ns(µ, p) ns µ p µ p ns L = 1 2 (@ )2 ⇤4 2 4 1 + ✓ µ ◆2 !p 2 1 3 5
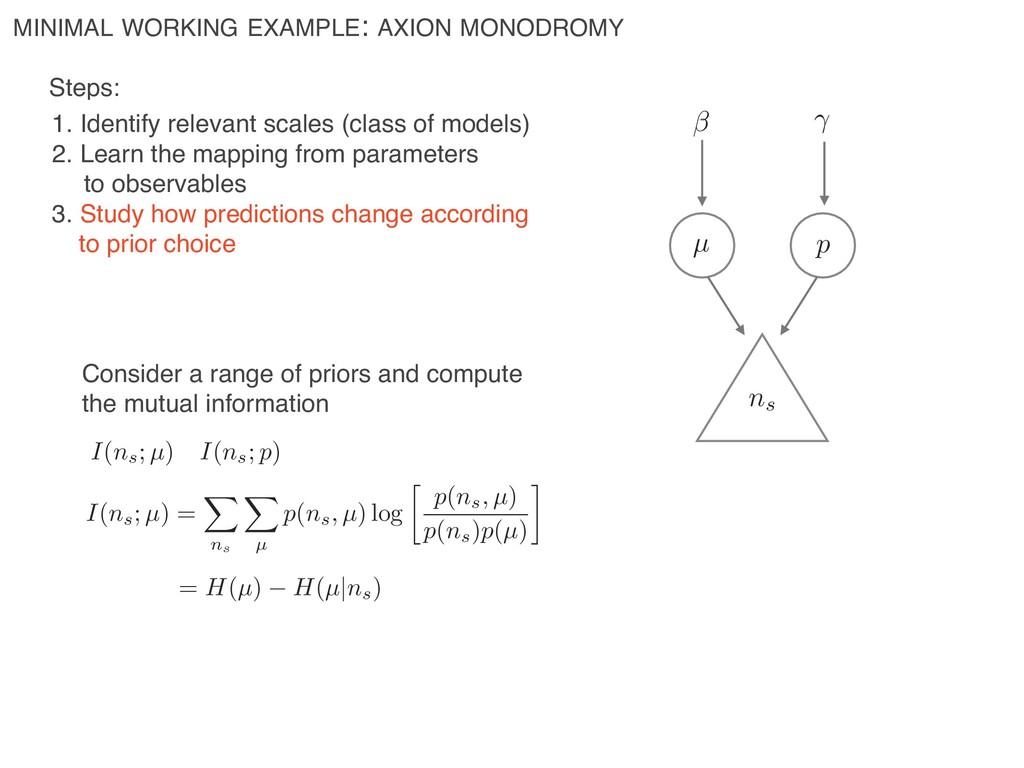
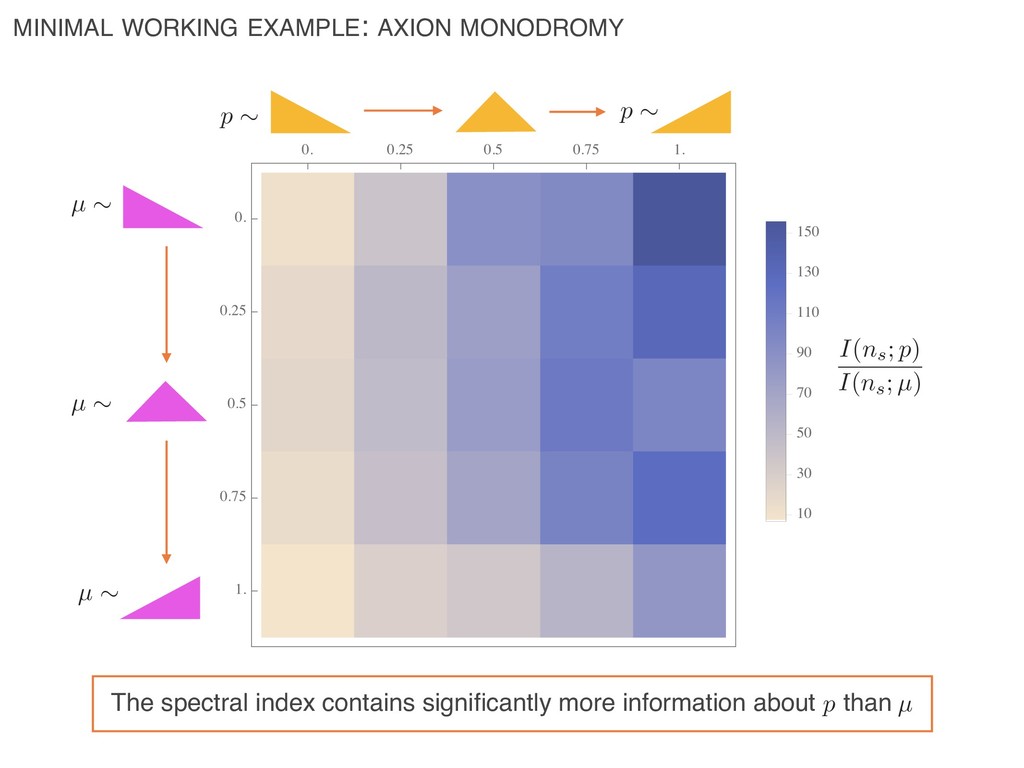
mapping from parameters uii to observables 3. Study how predictions change according fff to prior choice Steps: Consider a range of priors and compute the mutual information I(ns; µ) I(ns; p) I(ns; µ) = X ns X µ p(ns, µ) log p(ns, µ) p(ns)p(µ) µ p ns = H(µ) H(µ|ns) MINIMAL WORKING EXAMPLE: AXION MONODROMY
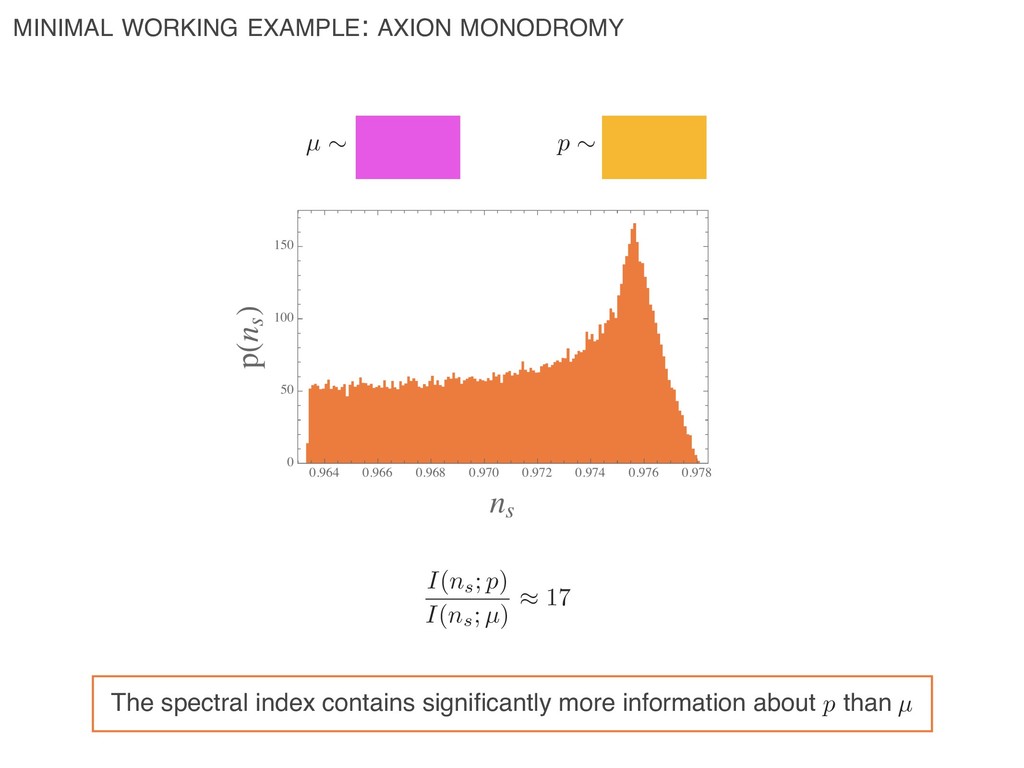
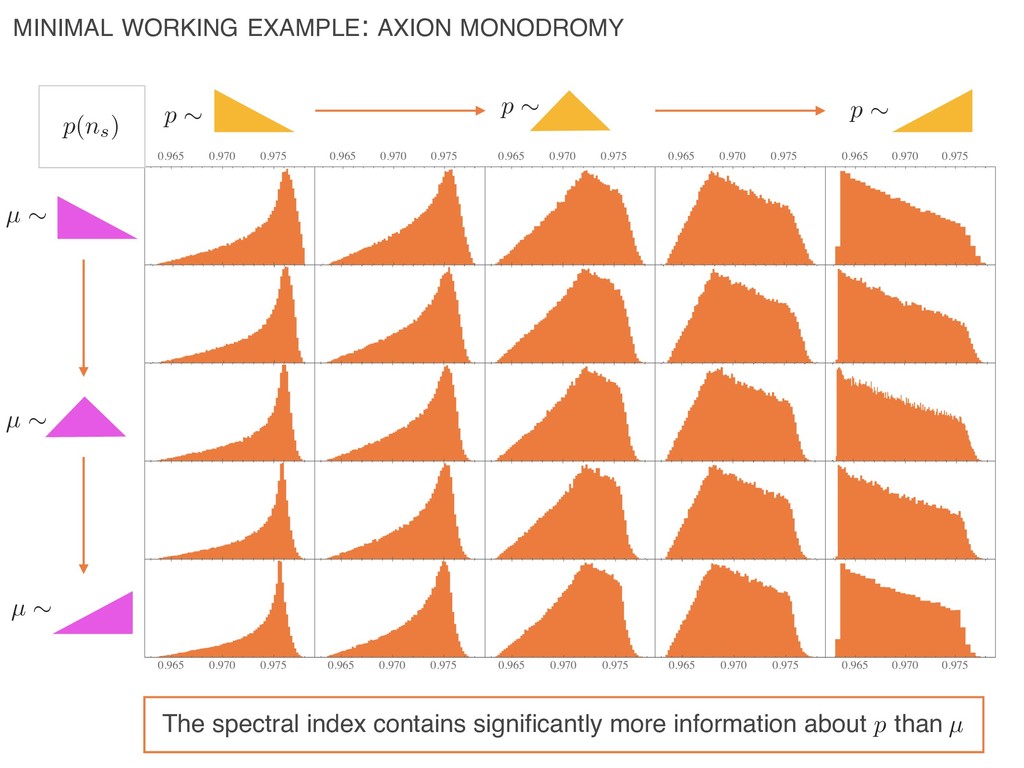
spectral index contains significantly more information about than µ p I(ns; p) I(ns; µ) ⇡ 17 <latexit sha1_base64="gdXLmknKSr01P8VGbmflWDCTSNc=">AAACEXicdZDLSgMxFIYz9VbrrerSTbAI7abM1NZa3BTc6K6CtYVOKZk004ZmMiHJiGWYZ3Djq7hxoeLWnTvfxvSiqOgPgY//nMPJ+T3BqNK2/W6lFhaXllfSq5m19Y3Nrez2zpUKI4lJE4cslG0PKcIoJ01NNSNtIQkKPEZa3uh0Um9dE6loyC/1WJBugAac+hQjbaxetuD6EuH4PM97sUpORCH5YjeIComLhJDhDXSqvWzOLjrlw1K5Ag1U7NKRPYdSFTpFe6ocmKvRy765/RBHAeEaM6RUx7GF7sZIaooZSTJupIhAeIQGpGOQo4Cobjw9KYEHxulDP5TmcQ2n7veJGAVKjQPPdAZID9Xv2sT8q9aJtH/cjSkXkSYczxb5EYM6hJN8YJ9KgjUbG0BYUvNXiIfIZKRNihkTwuel8H9oloq1onNRztVr8zTSYA/sgzxwQBXUwRlogCbA4Bbcg0fwZN1ZD9az9TJrTVnzmV3wQ9brB1OnnXA=</latexit> <latexit sha1_base64="gdXLmknKSr01P8VGbmflWDCTSNc=">AAACEXicdZDLSgMxFIYz9VbrrerSTbAI7abM1NZa3BTc6K6CtYVOKZk004ZmMiHJiGWYZ3Djq7hxoeLWnTvfxvSiqOgPgY//nMPJ+T3BqNK2/W6lFhaXllfSq5m19Y3Nrez2zpUKI4lJE4cslG0PKcIoJ01NNSNtIQkKPEZa3uh0Um9dE6loyC/1WJBugAac+hQjbaxetuD6EuH4PM97sUpORCH5YjeIComLhJDhDXSqvWzOLjrlw1K5Ag1U7NKRPYdSFTpFe6ocmKvRy765/RBHAeEaM6RUx7GF7sZIaooZSTJupIhAeIQGpGOQo4Cobjw9KYEHxulDP5TmcQ2n7veJGAVKjQPPdAZID9Xv2sT8q9aJtH/cjSkXkSYczxb5EYM6hJN8YJ9KgjUbG0BYUvNXiIfIZKRNihkTwuel8H9oloq1onNRztVr8zTSYA/sgzxwQBXUwRlogCbA4Bbcg0fwZN1ZD9az9TJrTVnzmV3wQ9brB1OnnXA=</latexit> <latexit sha1_base64="gdXLmknKSr01P8VGbmflWDCTSNc=">AAACEXicdZDLSgMxFIYz9VbrrerSTbAI7abM1NZa3BTc6K6CtYVOKZk004ZmMiHJiGWYZ3Djq7hxoeLWnTvfxvSiqOgPgY//nMPJ+T3BqNK2/W6lFhaXllfSq5m19Y3Nrez2zpUKI4lJE4cslG0PKcIoJ01NNSNtIQkKPEZa3uh0Um9dE6loyC/1WJBugAac+hQjbaxetuD6EuH4PM97sUpORCH5YjeIComLhJDhDXSqvWzOLjrlw1K5Ag1U7NKRPYdSFTpFe6ocmKvRy765/RBHAeEaM6RUx7GF7sZIaooZSTJupIhAeIQGpGOQo4Cobjw9KYEHxulDP5TmcQ2n7veJGAVKjQPPdAZID9Xv2sT8q9aJtH/cjSkXkSYczxb5EYM6hJN8YJ9KgjUbG0BYUvNXiIfIZKRNihkTwuel8H9oloq1onNRztVr8zTSYA/sgzxwQBXUwRlogCbA4Bbcg0fwZN1ZD9az9TJrTVnzmV3wQ9brB1OnnXA=</latexit> <latexit sha1_base64="gdXLmknKSr01P8VGbmflWDCTSNc=">AAACEXicdZDLSgMxFIYz9VbrrerSTbAI7abM1NZa3BTc6K6CtYVOKZk004ZmMiHJiGWYZ3Djq7hxoeLWnTvfxvSiqOgPgY//nMPJ+T3BqNK2/W6lFhaXllfSq5m19Y3Nrez2zpUKI4lJE4cslG0PKcIoJ01NNSNtIQkKPEZa3uh0Um9dE6loyC/1WJBugAac+hQjbaxetuD6EuH4PM97sUpORCH5YjeIComLhJDhDXSqvWzOLjrlw1K5Ag1U7NKRPYdSFTpFe6ocmKvRy765/RBHAeEaM6RUx7GF7sZIaooZSTJupIhAeIQGpGOQo4Cobjw9KYEHxulDP5TmcQ2n7veJGAVKjQPPdAZID9Xv2sT8q9aJtH/cjSkXkSYczxb5EYM6hJN8YJ9KgjUbG0BYUvNXiIfIZKRNihkTwuel8H9oloq1onNRztVr8zTSYA/sgzxwQBXUwRlogCbA4Bbcg0fwZN1ZD9az9TJrTVnzmV3wQ9brB1OnnXA=</latexit>
⇠ p ⇠ p ⇠ The spectral index contains significantly more information about than µ p I(ns; p) I(ns; µ) <latexit sha1_base64="xQn6H7ymAyH9kErl7+BXlr4wrmI=">AAACB3icdZDLSsNAFIYn9VbrrerShYNFaDclia21uCm40V0FYwtNKZPppB06mYSZiVBClm58FTcuVNz6Cu58G6cXRUV/GPj4zzmcOb8XMSqVab4bmYXFpeWV7GpubX1jcyu/vXMtw1hg4uCQhaLtIUkY5cRRVDHSjgRBgcdIyxudTeqtGyIkDfmVGkekG6ABpz7FSGmrl993fYFwclHkvUSmp1Ep/WI3iEtpL18wy1blyK5UoYaqaR+bc7Br0CqbUxXAXM1e/s3thzgOCFeYISk7lhmpboKEopiRNOfGkkQIj9CAdDRyFBDZTaaHpPBQO33oh0I/ruDU/T6RoEDKceDpzgCpofxdm5h/1Tqx8k+6CeVRrAjHs0V+zKAK4SQV2KeCYMXGGhAWVP8V4iHSySidXU6H8Hkp/B8cu1wvW5eVQqM+TyML9sABKAIL1EADnIMmcAAGt+AePIIn4854MJ6Nl1lrxpjP7IIfMl4/ABBbmY4=</latexit> <latexit sha1_base64="xQn6H7ymAyH9kErl7+BXlr4wrmI=">AAACB3icdZDLSsNAFIYn9VbrrerShYNFaDclia21uCm40V0FYwtNKZPppB06mYSZiVBClm58FTcuVNz6Cu58G6cXRUV/GPj4zzmcOb8XMSqVab4bmYXFpeWV7GpubX1jcyu/vXMtw1hg4uCQhaLtIUkY5cRRVDHSjgRBgcdIyxudTeqtGyIkDfmVGkekG6ABpz7FSGmrl993fYFwclHkvUSmp1Ep/WI3iEtpL18wy1blyK5UoYaqaR+bc7Br0CqbUxXAXM1e/s3thzgOCFeYISk7lhmpboKEopiRNOfGkkQIj9CAdDRyFBDZTaaHpPBQO33oh0I/ruDU/T6RoEDKceDpzgCpofxdm5h/1Tqx8k+6CeVRrAjHs0V+zKAK4SQV2KeCYMXGGhAWVP8V4iHSySidXU6H8Hkp/B8cu1wvW5eVQqM+TyML9sABKAIL1EADnIMmcAAGt+AePIIn4854MJ6Nl1lrxpjP7IIfMl4/ABBbmY4=</latexit> <latexit sha1_base64="xQn6H7ymAyH9kErl7+BXlr4wrmI=">AAACB3icdZDLSsNAFIYn9VbrrerShYNFaDclia21uCm40V0FYwtNKZPppB06mYSZiVBClm58FTcuVNz6Cu58G6cXRUV/GPj4zzmcOb8XMSqVab4bmYXFpeWV7GpubX1jcyu/vXMtw1hg4uCQhaLtIUkY5cRRVDHSjgRBgcdIyxudTeqtGyIkDfmVGkekG6ABpz7FSGmrl993fYFwclHkvUSmp1Ep/WI3iEtpL18wy1blyK5UoYaqaR+bc7Br0CqbUxXAXM1e/s3thzgOCFeYISk7lhmpboKEopiRNOfGkkQIj9CAdDRyFBDZTaaHpPBQO33oh0I/ruDU/T6RoEDKceDpzgCpofxdm5h/1Tqx8k+6CeVRrAjHs0V+zKAK4SQV2KeCYMXGGhAWVP8V4iHSySidXU6H8Hkp/B8cu1wvW5eVQqM+TyML9sABKAIL1EADnIMmcAAGt+AePIIn4854MJ6Nl1lrxpjP7IIfMl4/ABBbmY4=</latexit> <latexit sha1_base64="xQn6H7ymAyH9kErl7+BXlr4wrmI=">AAACB3icdZDLSsNAFIYn9VbrrerShYNFaDclia21uCm40V0FYwtNKZPppB06mYSZiVBClm58FTcuVNz6Cu58G6cXRUV/GPj4zzmcOb8XMSqVab4bmYXFpeWV7GpubX1jcyu/vXMtw1hg4uCQhaLtIUkY5cRRVDHSjgRBgcdIyxudTeqtGyIkDfmVGkekG6ABpz7FSGmrl993fYFwclHkvUSmp1Ep/WI3iEtpL18wy1blyK5UoYaqaR+bc7Br0CqbUxXAXM1e/s3thzgOCFeYISk7lhmpboKEopiRNOfGkkQIj9CAdDRyFBDZTaaHpPBQO33oh0I/ruDU/T6RoEDKceDpzgCpofxdm5h/1Tqx8k+6CeVRrAjHs0V+zKAK4SQV2KeCYMXGGhAWVP8V4iHSySidXU6H8Hkp/B8cu1wvW5eVQqM+TyML9sABKAIL1EADnIMmcAAGt+AePIIn4854MJ6Nl1lrxpjP7IIfMl4/ABBbmY4=</latexit>
more information about than µ p µ ⇠ µ ⇠ µ ⇠ p ⇠ p ⇠ p ⇠ p(ns) <latexit sha1_base64="9QQj3Kr7vGWTa/I7w8gG+c342RQ=">AAAB7nicdVBNS8NAEJ3Ur1q/qh69LBahXkISW2tvBS8eK1hbaEPZbDft0s0m7m6EEvonvHhQ8erv8ea/cfshqOiDgcd7M8zMCxLOlHacDyu3srq2vpHfLGxt7+zuFfcPblWcSkJbJOax7ARYUc4EbWmmOe0kkuIo4LQdjC9nfvueSsVicaMnCfUjPBQsZARrI3WSsuhnanraL5Yc262ceZUqMqTqeOfOkng15NrOHCVYotkvvvcGMUkjKjThWKmu6yTaz7DUjHA6LfRSRRNMxnhIu4YKHFHlZ/N7p+jEKAMUxtKU0Giufp/IcKTUJApMZ4T1SP32ZuJfXjfV4YWfMZGkmgqyWBSmHOkYzZ5HAyYp0XxiCCaSmVsRGWGJiTYRFUwIX5+i/0nLs+u2e10pNerLNPJwBMdQBhdq0IAraEILCHB4gCd4tu6sR+vFel205qzlzCH8gPX2CXA1j8A=</latexit> <latexit sha1_base64="9QQj3Kr7vGWTa/I7w8gG+c342RQ=">AAAB7nicdVBNS8NAEJ3Ur1q/qh69LBahXkISW2tvBS8eK1hbaEPZbDft0s0m7m6EEvonvHhQ8erv8ea/cfshqOiDgcd7M8zMCxLOlHacDyu3srq2vpHfLGxt7+zuFfcPblWcSkJbJOax7ARYUc4EbWmmOe0kkuIo4LQdjC9nfvueSsVicaMnCfUjPBQsZARrI3WSsuhnanraL5Yc262ceZUqMqTqeOfOkng15NrOHCVYotkvvvcGMUkjKjThWKmu6yTaz7DUjHA6LfRSRRNMxnhIu4YKHFHlZ/N7p+jEKAMUxtKU0Giufp/IcKTUJApMZ4T1SP32ZuJfXjfV4YWfMZGkmgqyWBSmHOkYzZ5HAyYp0XxiCCaSmVsRGWGJiTYRFUwIX5+i/0nLs+u2e10pNerLNPJwBMdQBhdq0IAraEILCHB4gCd4tu6sR+vFel205qzlzCH8gPX2CXA1j8A=</latexit> <latexit sha1_base64="9QQj3Kr7vGWTa/I7w8gG+c342RQ=">AAAB7nicdVBNS8NAEJ3Ur1q/qh69LBahXkISW2tvBS8eK1hbaEPZbDft0s0m7m6EEvonvHhQ8erv8ea/cfshqOiDgcd7M8zMCxLOlHacDyu3srq2vpHfLGxt7+zuFfcPblWcSkJbJOax7ARYUc4EbWmmOe0kkuIo4LQdjC9nfvueSsVicaMnCfUjPBQsZARrI3WSsuhnanraL5Yc262ceZUqMqTqeOfOkng15NrOHCVYotkvvvcGMUkjKjThWKmu6yTaz7DUjHA6LfRSRRNMxnhIu4YKHFHlZ/N7p+jEKAMUxtKU0Giufp/IcKTUJApMZ4T1SP32ZuJfXjfV4YWfMZGkmgqyWBSmHOkYzZ5HAyYp0XxiCCaSmVsRGWGJiTYRFUwIX5+i/0nLs+u2e10pNerLNPJwBMdQBhdq0IAraEILCHB4gCd4tu6sR+vFel205qzlzCH8gPX2CXA1j8A=</latexit> <latexit sha1_base64="9QQj3Kr7vGWTa/I7w8gG+c342RQ=">AAAB7nicdVBNS8NAEJ3Ur1q/qh69LBahXkISW2tvBS8eK1hbaEPZbDft0s0m7m6EEvonvHhQ8erv8ea/cfshqOiDgcd7M8zMCxLOlHacDyu3srq2vpHfLGxt7+zuFfcPblWcSkJbJOax7ARYUc4EbWmmOe0kkuIo4LQdjC9nfvueSsVicaMnCfUjPBQsZARrI3WSsuhnanraL5Yc262ceZUqMqTqeOfOkng15NrOHCVYotkvvvcGMUkjKjThWKmu6yTaz7DUjHA6LfRSRRNMxnhIu4YKHFHlZ/N7p+jEKAMUxtKU0Giufp/IcKTUJApMZ4T1SP32ZuJfXjfV4YWfMZGkmgqyWBSmHOkYzZ5HAyYp0XxiCCaSmVsRGWGJiTYRFUwIX5+i/0nLs+u2e10pNerLNPJwBMdQBhdq0IAraEILCHB4gCd4tu6sR+vFel205qzlzCH8gPX2CXA1j8A=</latexit>
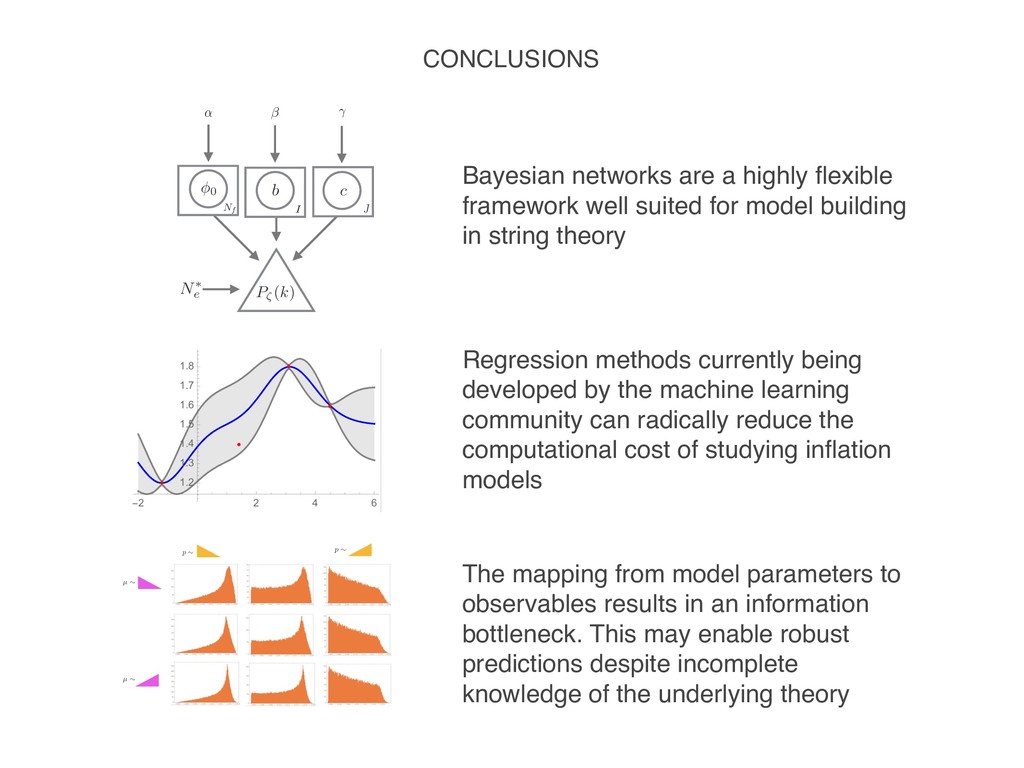
↵ Bayesian networks are a highly flexible framework well suited for model building in string theory Regression methods currently being developed by the machine learning community can radically reduce the computational cost of studying inflation models The mapping from model parameters to observables results in an information bottleneck. This may enable robust predictions despite incomplete knowledge of the underlying theory p ⇠ p ⇠ µ ⇠ µ ⇠