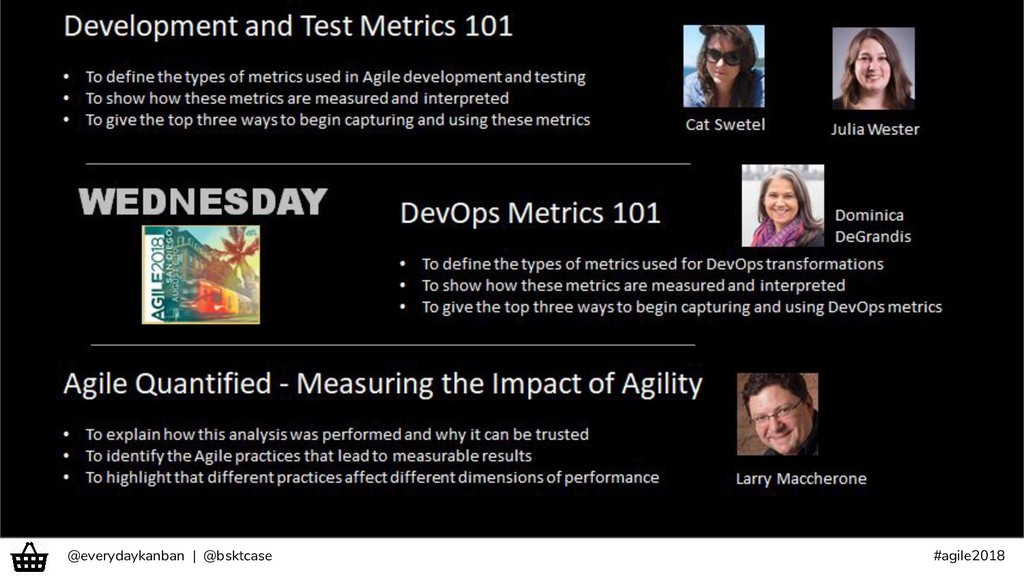
This session will show how to visualize and use metrics in a team coaching practice. By attending this session you will learn how teams can see and balance a set of competing metrics, and anticipate the impact of process changes.
@everydaykanban | @bsktcase #agile2018 Who are we? Julia Wester Co-Founder & Principal Consultant Lagom Solutions https://lagom.solutions @everydaykanban Cheryl Hammond Hire Me! Seattle, Washington, USA https://linkedin.com/in/bsktcase @bsktcase
@everydaykanban | @bsktcase #agile2018 Planning Stand-Up / Scrum Retrospective Time in Process Throughput WiP Levels WiP Age Escaped Defects Time in Process Throughput Net Flow Flow Efficiency Defects per Environment and more...
@everydaykanban | @bsktcase #agile2018 Meaning is in the eye of 
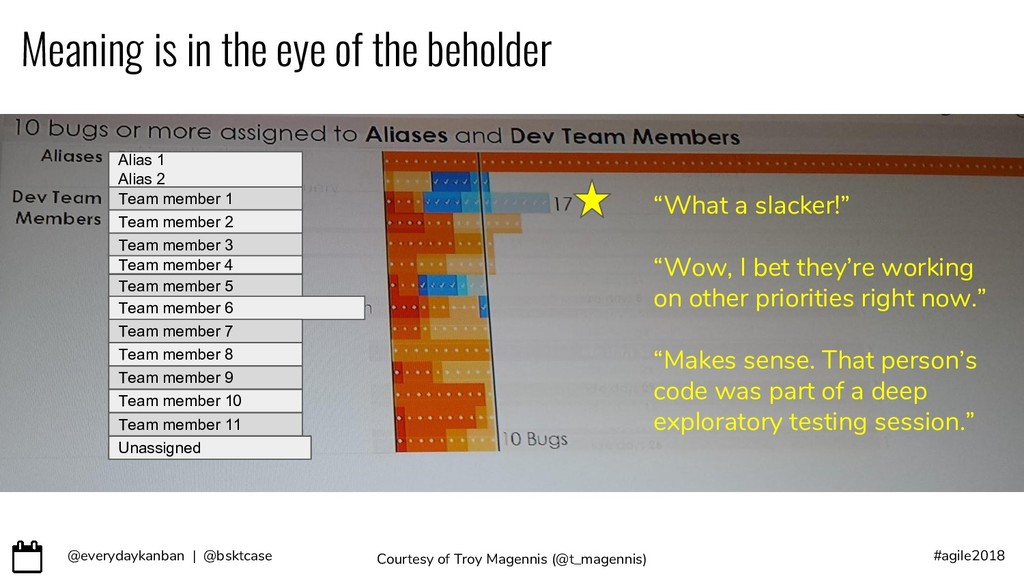
the beholder Courtesy of Troy Magennis (@t_magennis) Team member 1 Team member 2 Team member 3 Team member 4 Team member 5 Team member 6 Team member 7 Team member 8 Team member 9 Team member 10 Team member 11 Unassigned Alias 1 Alias 2 “What a slacker!” “Wow, I bet they’re working on other priorities right now.” “Makes sense. That person’s code was part of a deep exploratory testing session.”
@everydaykanban | @bsktcase #agile2018 The two main goals of data driven coaching: help teams identify areas of improvement 1 avoid over-emphasizing a single measure of success 2
@everydaykanban | @bsktcase #agile2018 “Tell me how you’ll measure me and I’ll tell you how I’ll behave. If you measure me in illogical ways, do not complain about illogical behavior.” –Eli Goldratt
@everydaykanban | @bsktcase #agile2018 How to put a focus on trends No Y-Axis Tiny #’s Trend Line Project Trend When applicable, connect data point with lines
@everydaykanban | @bsktcase #agile2018 “Fear invites wrong figures. Bearers of bad news fare badly. To keep his job, anyone may present to his boss only good news.” –W. Edwards Deming Quote from “New Economics” p. 94, Deming
@everydaykanban | @bsktcase #agile2018 QUALITY RESPONSIVENESS PRODUCTIVITY PREDICTABILITY How well? How fast? How much? Keeping pace? How repeatable? Competes with Competes with
@everydaykanban | @bsktcase #agile2018 Decide on outcomes THEN Determine your 
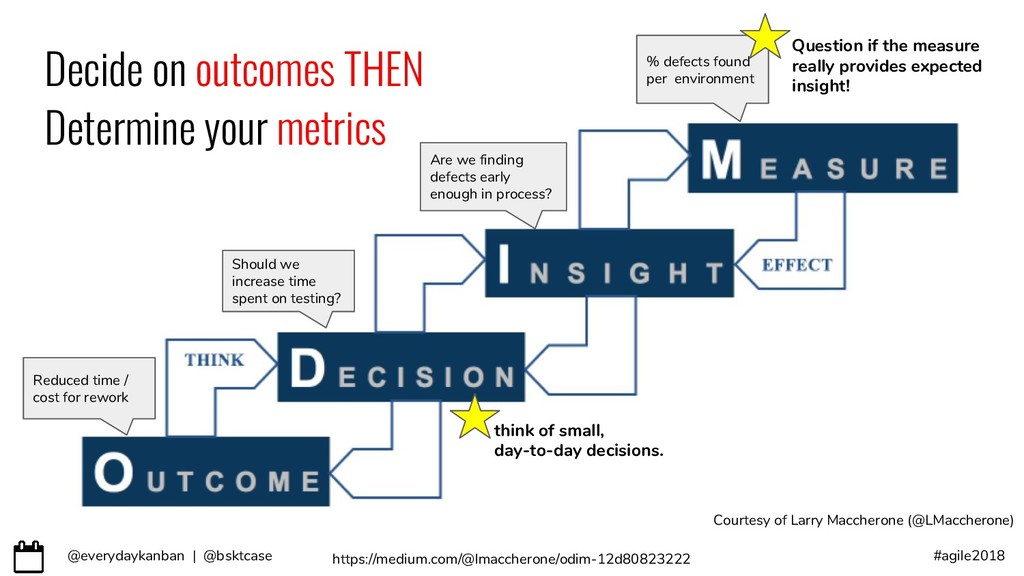
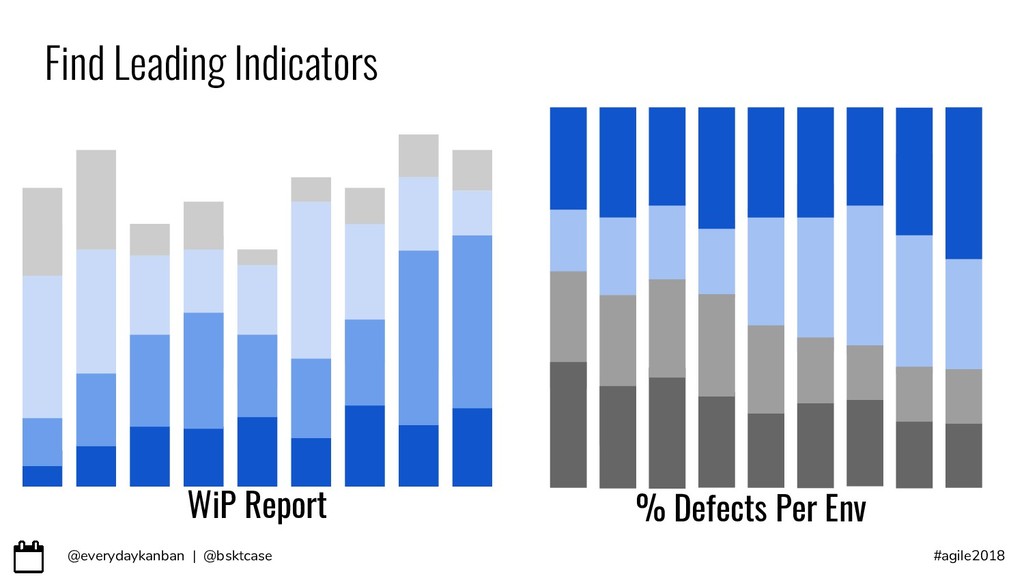
metrics Reduced time / cost for rework Should we increase time spent on testing? Are we finding defects early enough in process? % defects found per environment https://medium.com/@lmaccherone/odim-12d80823222 think of small, day-to-day decisions. Question if the measure really provides expected insight! Courtesy of Larry Maccherone (@LMaccherone)
@everydaykanban | @bsktcase #agile2018 QUALITY RESPONSIVENESS PRODUCTIVITY PREDICTABILITY How well? How fast? How much? Keeping pace? How repeatable? pick best representative metric for each quadrant
@everydaykanban | @bsktcase #agile2018 A helpful template to guide you... QUADRANT QUADRANT Courtesy of Troy Magennis (@t_magennis) Metric for Opposing Quadrant Metric for Current Quadrant
@everydaykanban | @bsktcase #agile2018 A helpful template to guide you... RESPONSIVENESS RESPONSIVENESS Courtesy of Troy Magennis (@t_magennis) Time in Process Sprint ??? (QUALITY)
@everydaykanban | @bsktcase #agile2018 A helpful template to guide you... RESPONSIVENESS RESPONSIVENESS Courtesy of Troy Magennis (@t_magennis) Time in Process Sprint Escaped Defects (QUALITY)
@everydaykanban | @bsktcase #agile2018 Give a cheat sheet! ● What is the chart ● Intended behavior ● How to game it ● When overdriven, what moves? http://bit.ly/SimResources Courtesy of Troy Magennis (@t_magennis)
@everydaykanban | @bsktcase #agile2018 “First, do no harm.” “If anyone adjusts a stable process, the output that follows will be worse than if (s)he had left the process alone.” –W. Edward Deming
@everydaykanban | @bsktcase #agile2018 Recap: The two main goals of data driven coaching: help teams identify areas of improvement 1 avoid over-emphasizing a single measure of success 2
@everydaykanban | @bsktcase #agile2018 Resources to keep learning Balanced Metrics 
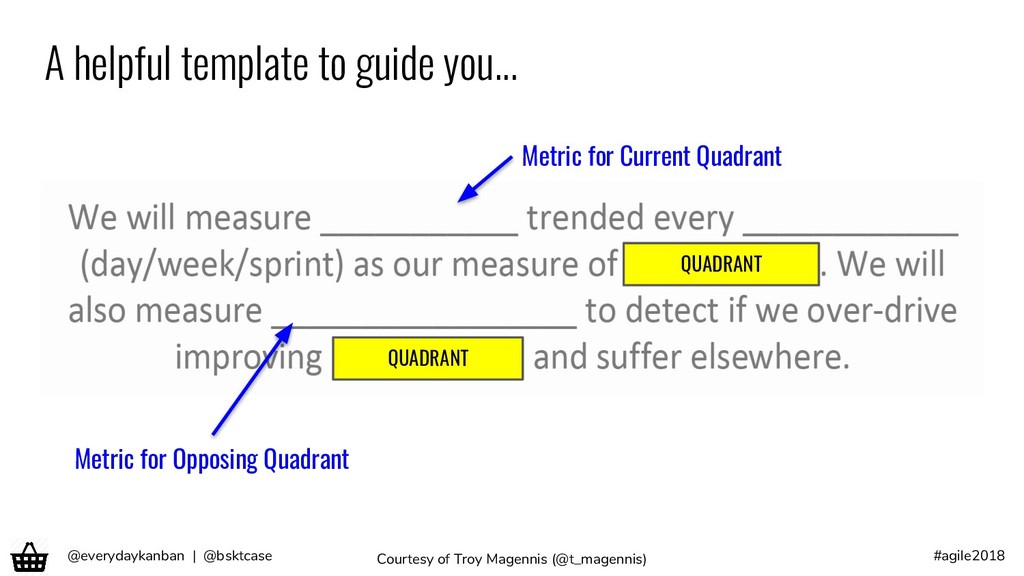
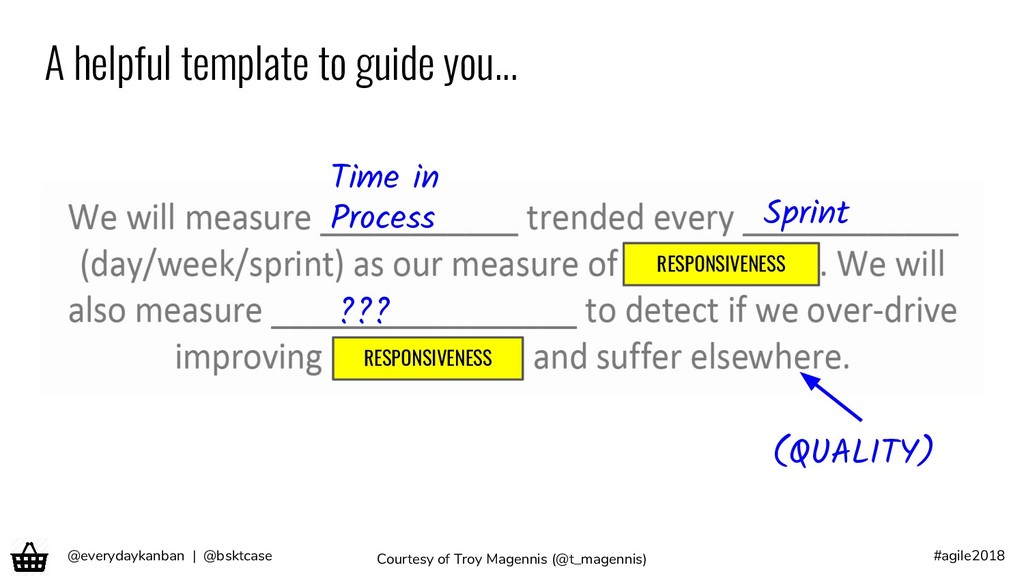
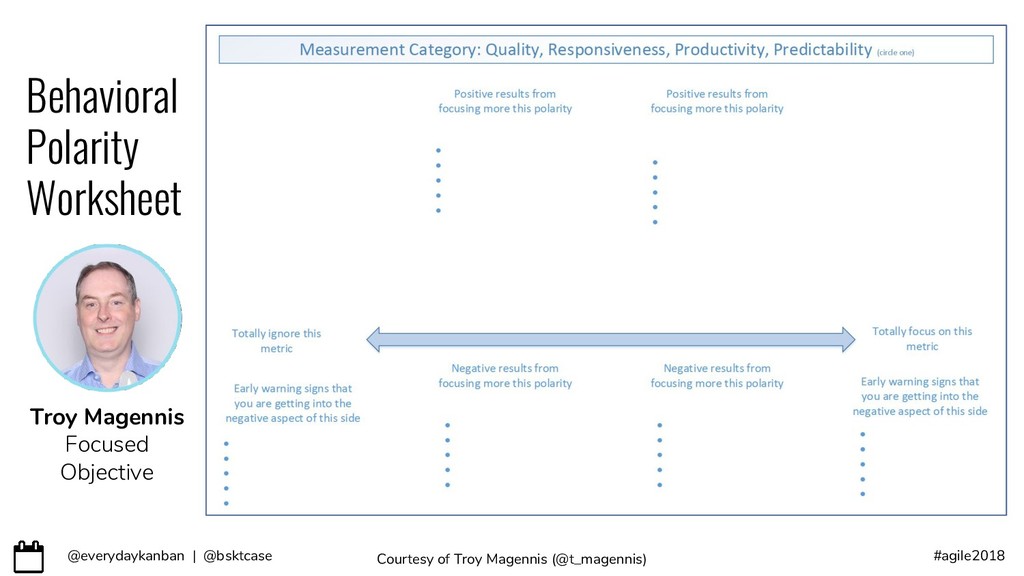
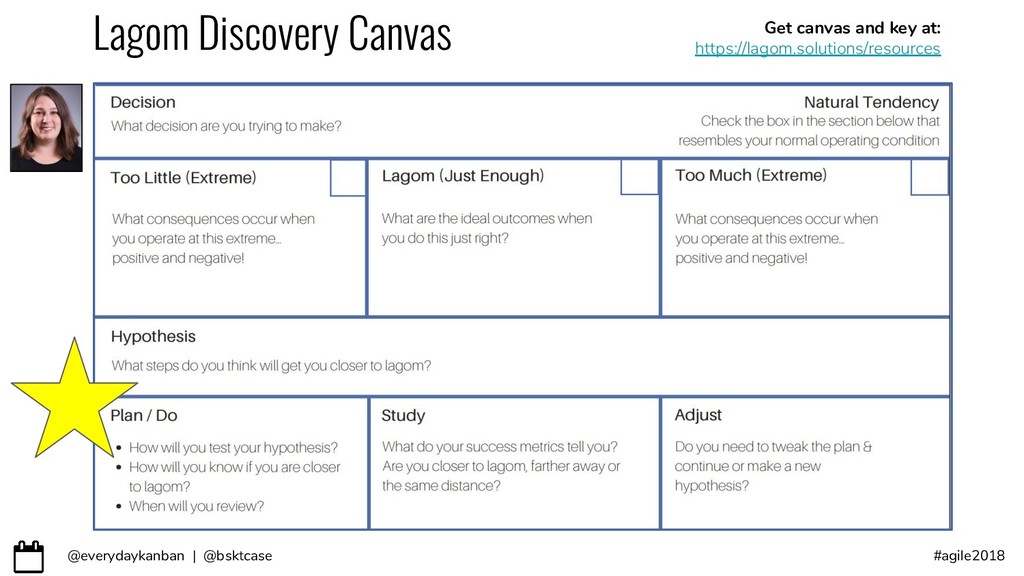
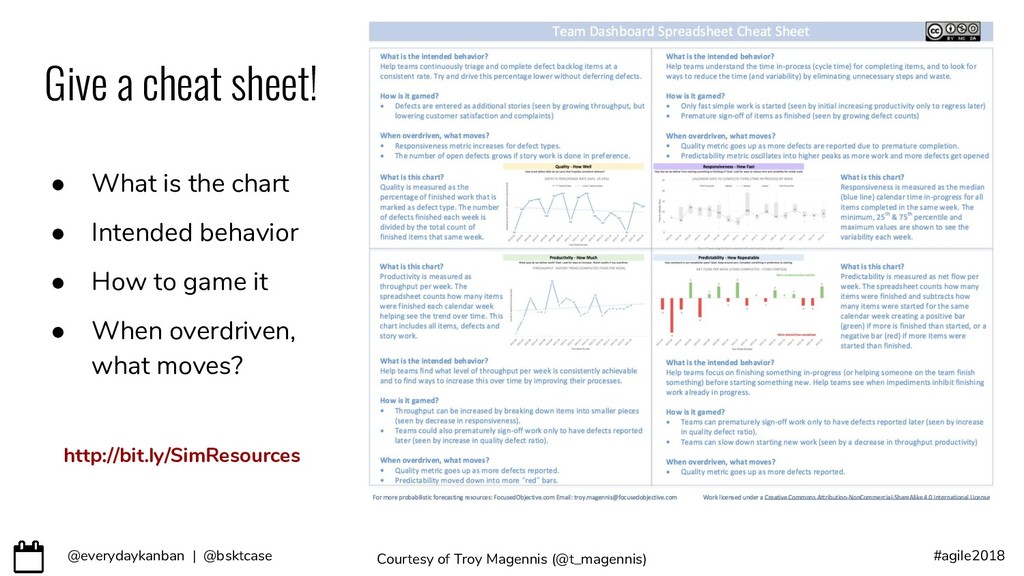
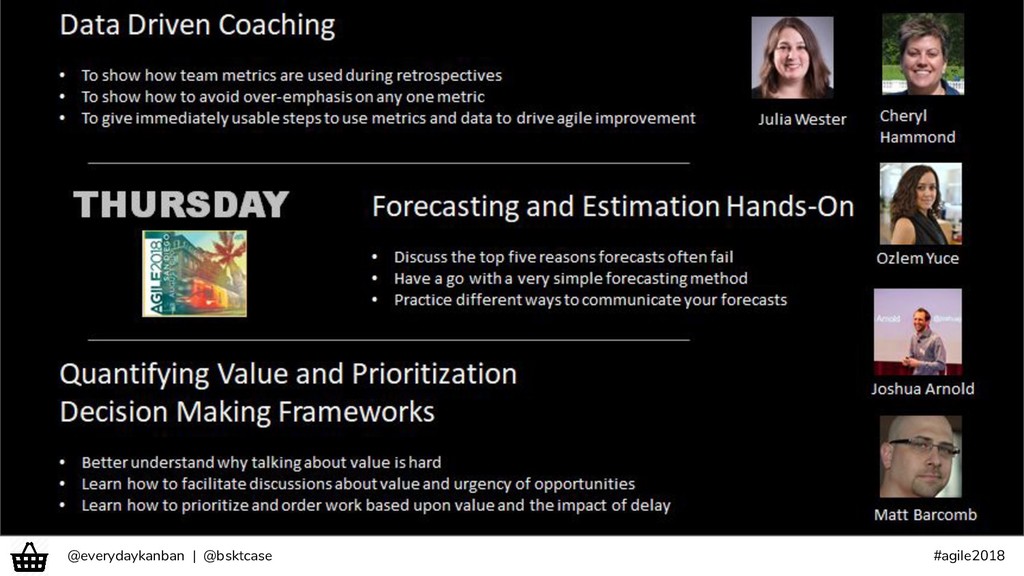
Dashboard http://focusedobjective.com/team-metrics-right/ by Troy Magennis, Focused Objective Lagom Discovery Canvas https://bit.ly/2vTaCXF by Julia Wester, Lagom Solutions One Metric to Rule Them All https://bit.ly/2M3gVCE by Cheryl Hammond, Secret Garden
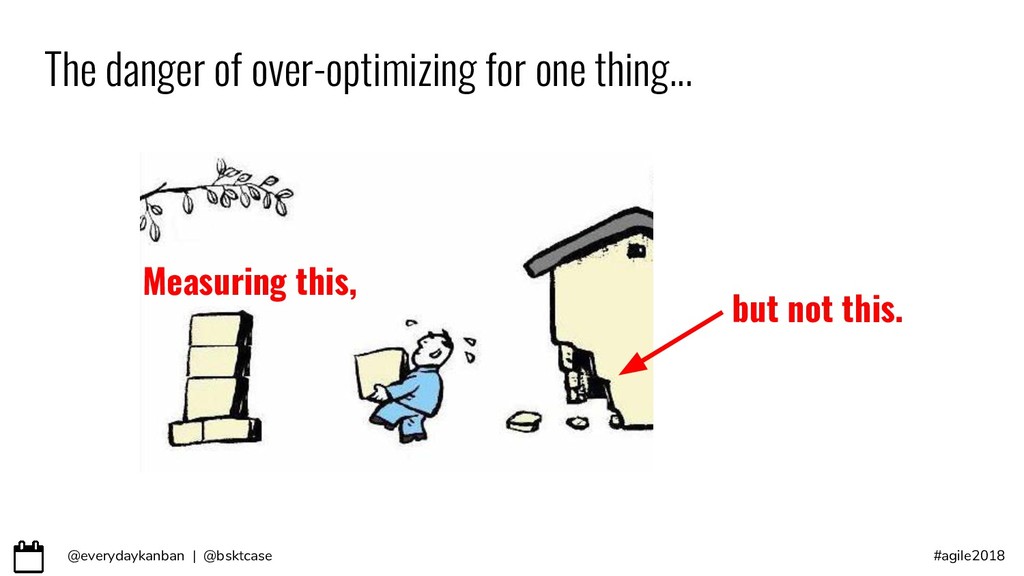
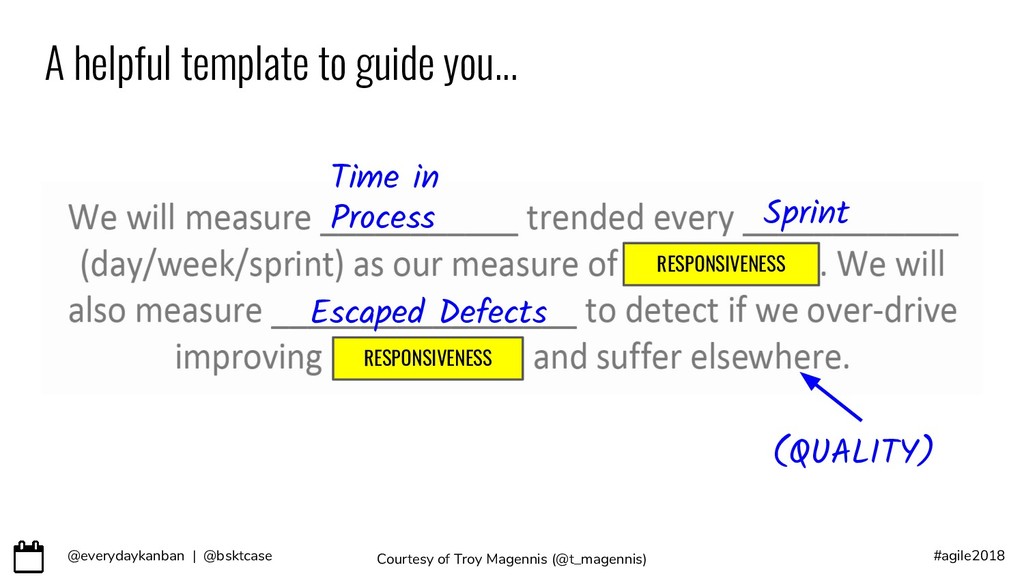
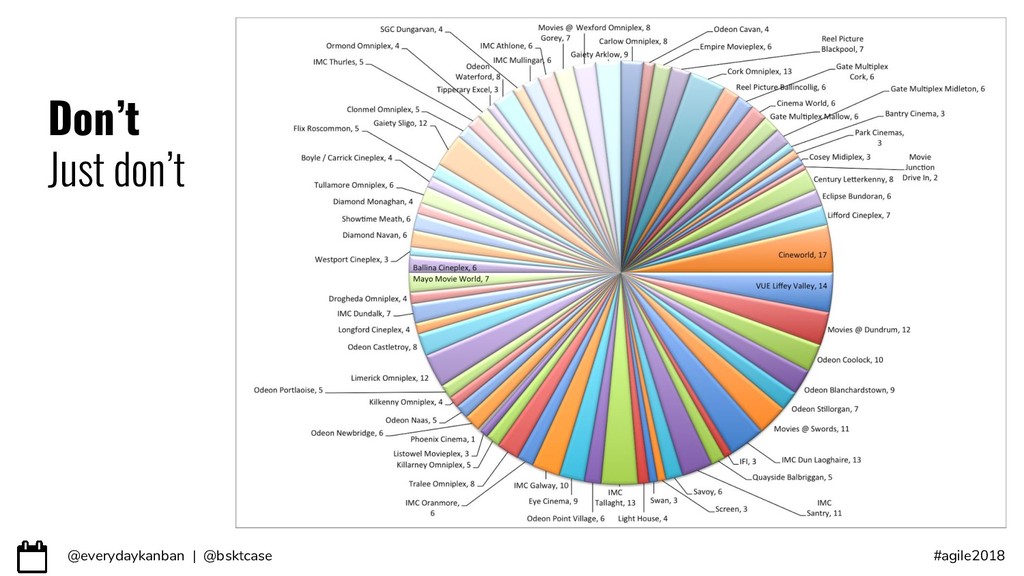
@everydaykanban | @bsktcase #agile2018 How You Can Contact Us Julia Wester Co-Founder & Principal Consultant Lagom Solutions https://lagom.solutions @everydaykanban Cheryl Hammond Hire Me! Seattle, Washington, USA https://linkedin.com/in/bsktcase @bsktcase
@everydaykanban | @bsktcase #agile2018 Pro Tip: Pies are best for eating, less so for charting... http://www.thefunctionalart.com/2012/06/fun-note-on-pie-charts.html
@everydaykanban | @bsktcase #agile2018 Avoid Confusing Activity with Progress Activity metrics ● lines of code ● # of issues closed ● # of deploys per day These aren’t “bad” metrics. We should: 1. Understand what they really show 2. Show them with competing metrics to reduce gaming J
@everydaykanban | @bsktcase #agile2018 Exercise: Map outcomes to metrics with 
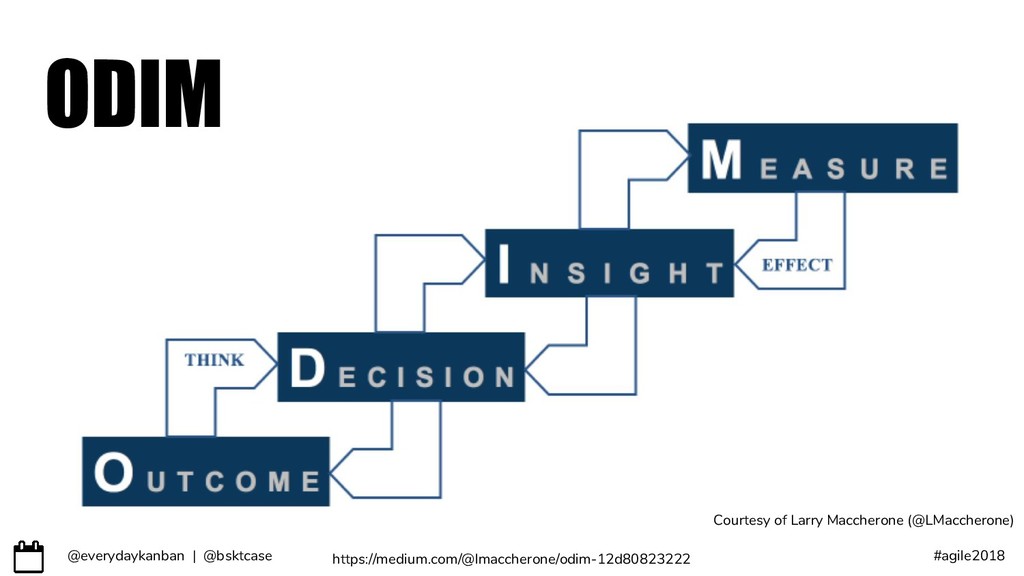
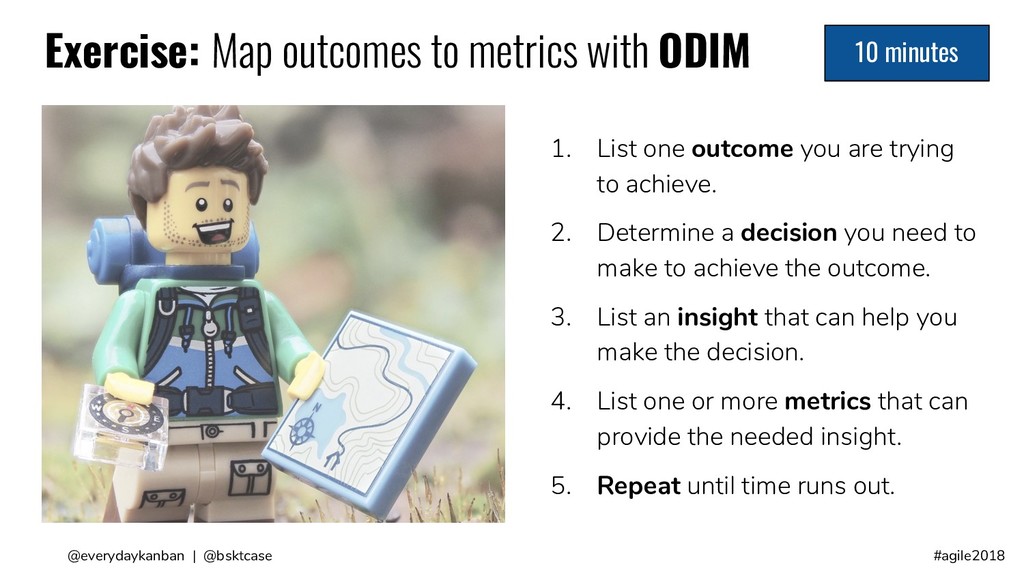
ODIM 1. List one outcome you are trying to achieve. 2. Determine a decision you need to make to achieve the outcome. 3. List an insight that can help you make the decision. 4. List one or more metrics that can provide the needed insight. 5. Repeat until time runs out. 10 minutes