Upgrade to Pro — share decks privately, control downloads, hide ads and more …

Building Analytics in Start-ups

Keen
September 30, 2015

Building Analytics in Start-ups

Samson Hu, Data Engineer at Wish shared how he built analytics infrastructure from the ground up at 500px and Wish.

Keen

September 30, 2015
Tweet

More Decks by Keen

Other Decks in Technology

Transcript

  1. Fast growth start-up, very basic data capabilities • 50 employees,

    8 teams • Google Sheets containing daily KPI’s • Splunk for event log analytics • MySQL read replica for analytics
  2. Data infrastructure was in a sad state • Broke daily/weekly

    • Inaccurate • Hard to interpret • Inaccessible • Poor data culture
  3. 10 months later • Broke daily/weekly -> Robust pipeline (Luigi)

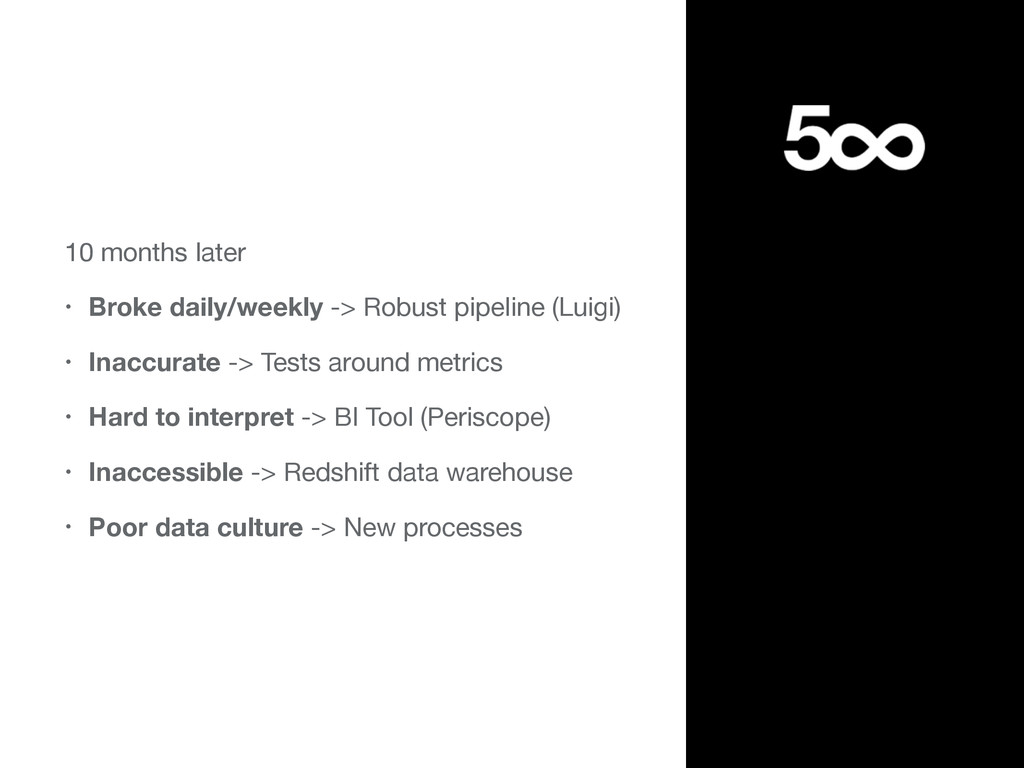
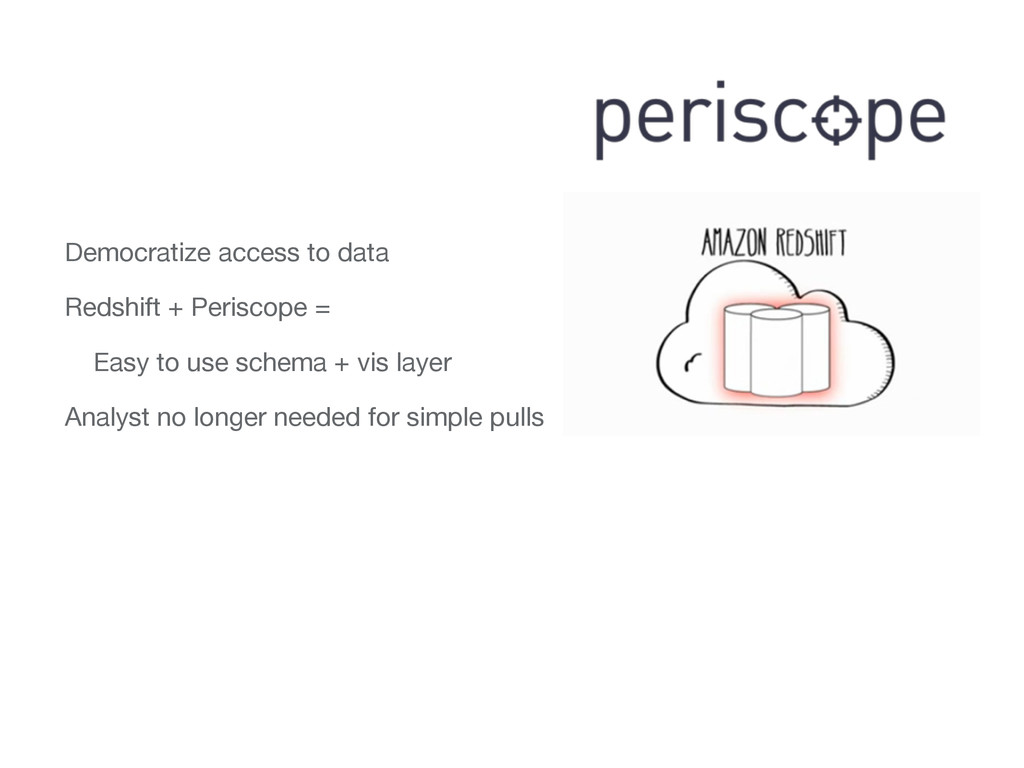
    • Inaccurate -> Tests around metrics • Hard to interpret -> BI Tool (Periscope) • Inaccessible -> Redshift data warehouse • Poor data culture -> New processes
  4. ETL’s are complicated. Need a framework that is robust Luigi

    provides: • Dependencies between tasks built in • Idempotent • Extendable
  5. Programmatic tests guard against bad metrics Sources of pipeline error

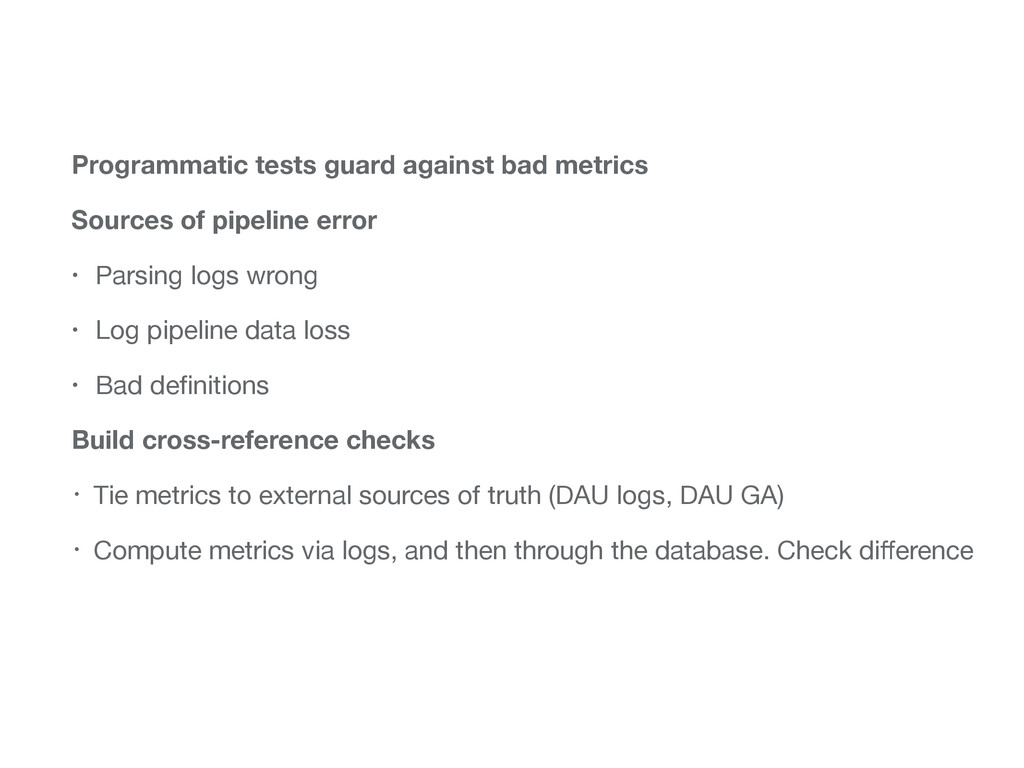
    • Parsing logs wrong • Log pipeline data loss • Bad definitions Build cross-reference checks • Tie metrics to external sources of truth (DAU logs, DAU GA) • Compute metrics via logs, and then through the database. Check difference
  6. Democratize access to data Redshift + Periscope = Easy to

    use schema + vis layer Analyst no longer needed for simple pulls
  7. Become data driven by tying in data into operations •

    Each feature needs success metrics • Metrics dashboards for each team and product feature • Educate, educate, educate
  8. Drive direction using data from the top 1. Set strategy

    2. Choose metrics 3. Forecast 4. Measure
  9. Log everything to Hive Custom internal tools to view events,

    run a/b tests Store summary metrics in MongoDB Expose summary metrics to merchants via API