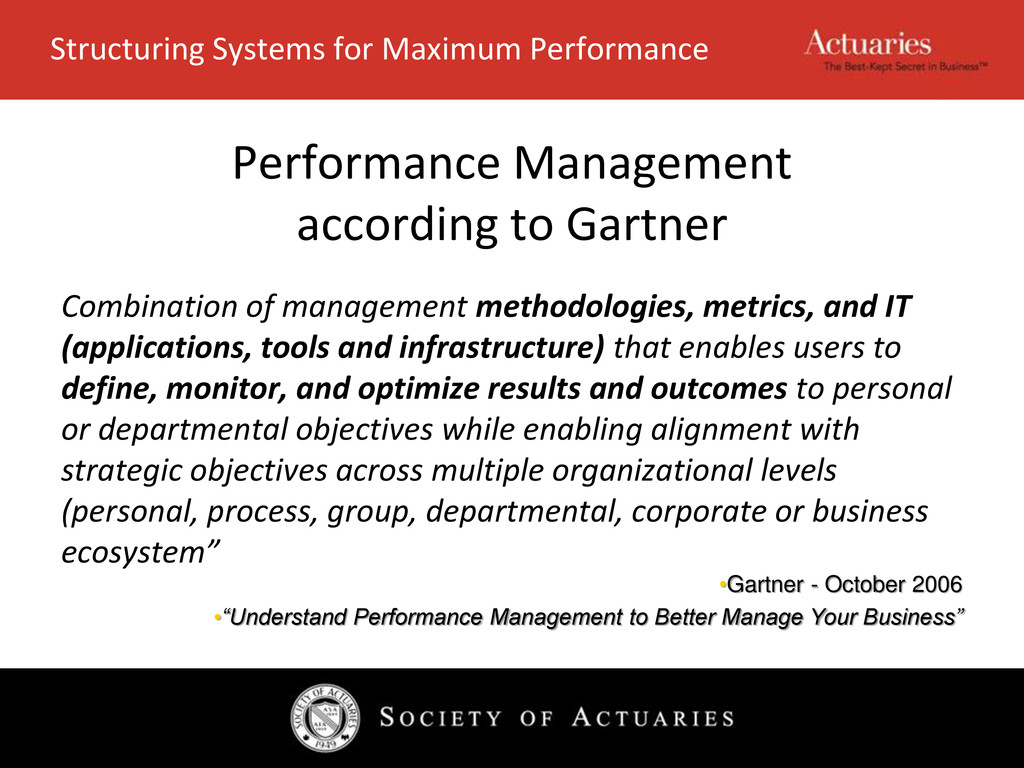
and IT (applications, tools and infrastructure) that enables users to define, monitor, and optimize results and outcomes to personal or departmental objectives while enabling alignment with strategic objectives across multiple organizational levels (personal, process, group, departmental, corporate or business ecosystem” •Gartner - October 2006 •“Understand Performance Management to Better Manage Your Business” Structuring Systems for Maximum Performance
Developer of Business Intelligence system designed specifically for insurance, includes experience studies, EBS and sales analytics. Consulting and implementation services.
Experience with IDI, LTC, Individual Health Insurance and reinsurance. Currently responsible for major project to overhaul analytics and performance management reporting.
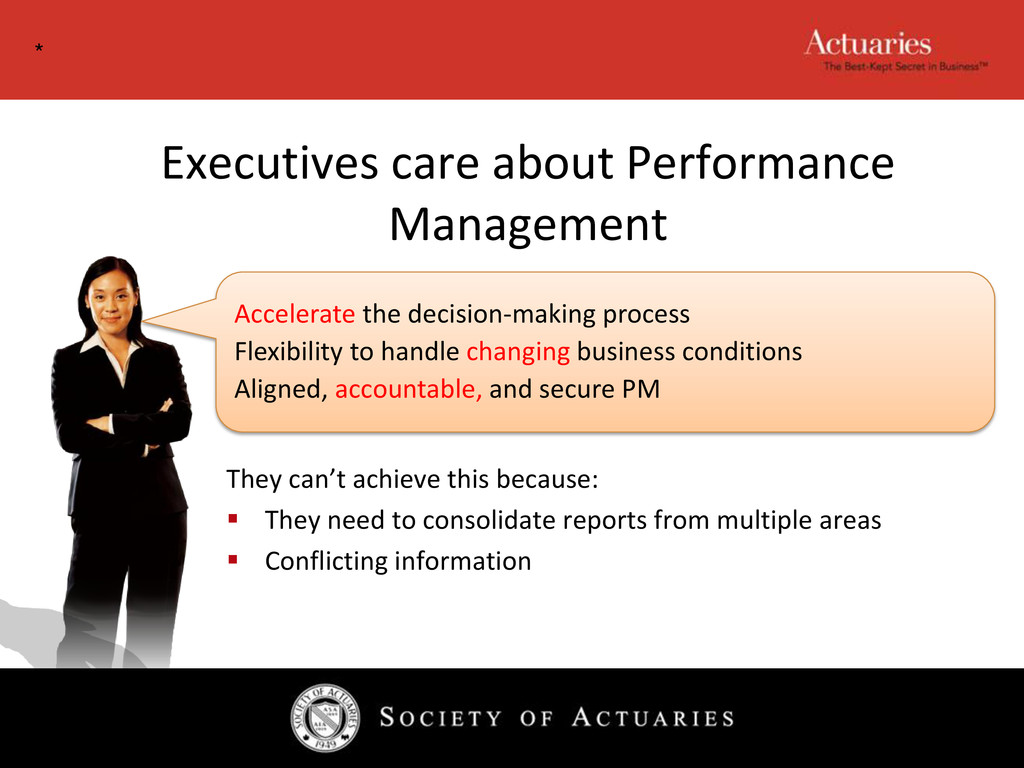
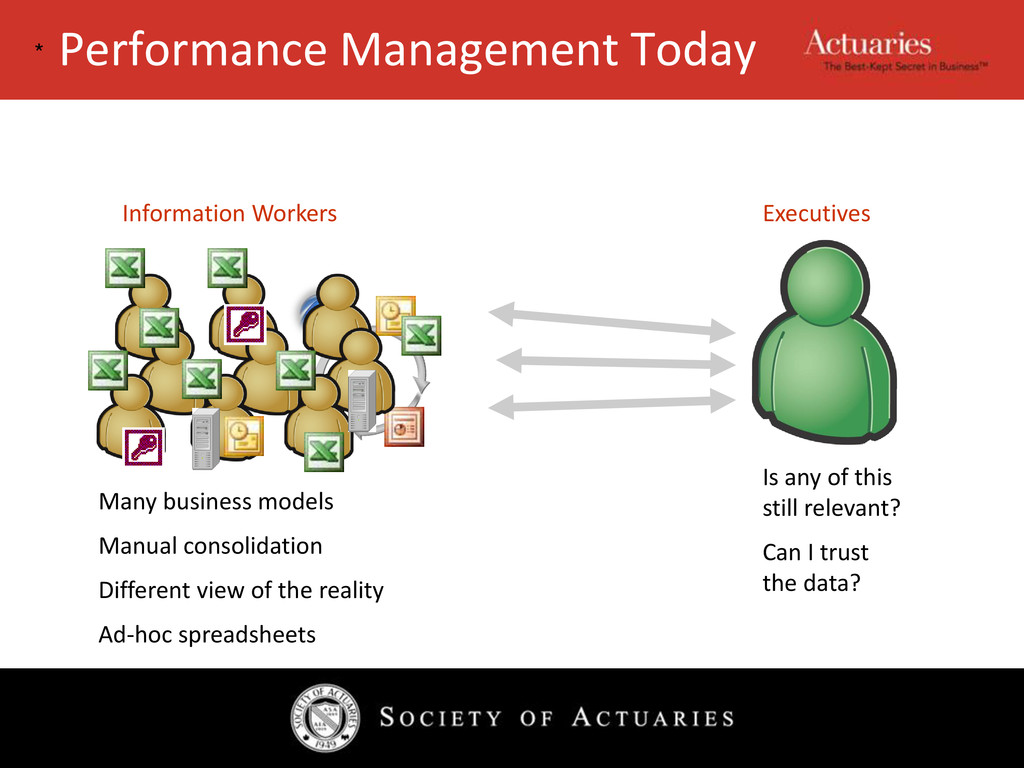
to handle changing business conditions Aligned, accountable, and secure PM They can’t achieve this because: They need to consolidate reports from multiple areas Conflicting information *
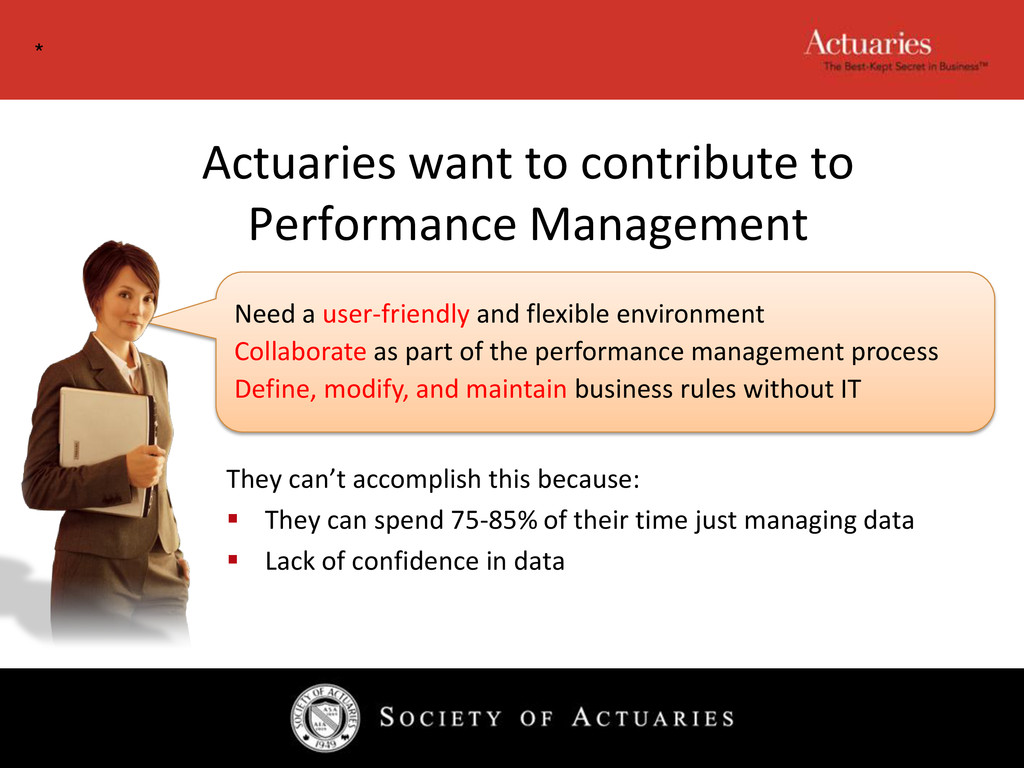
and flexible environment Collaborate as part of the performance management process Define, modify, and maintain business rules without IT They can’t accomplish this because: They can spend 75-85% of their time just managing data Lack of confidence in data *
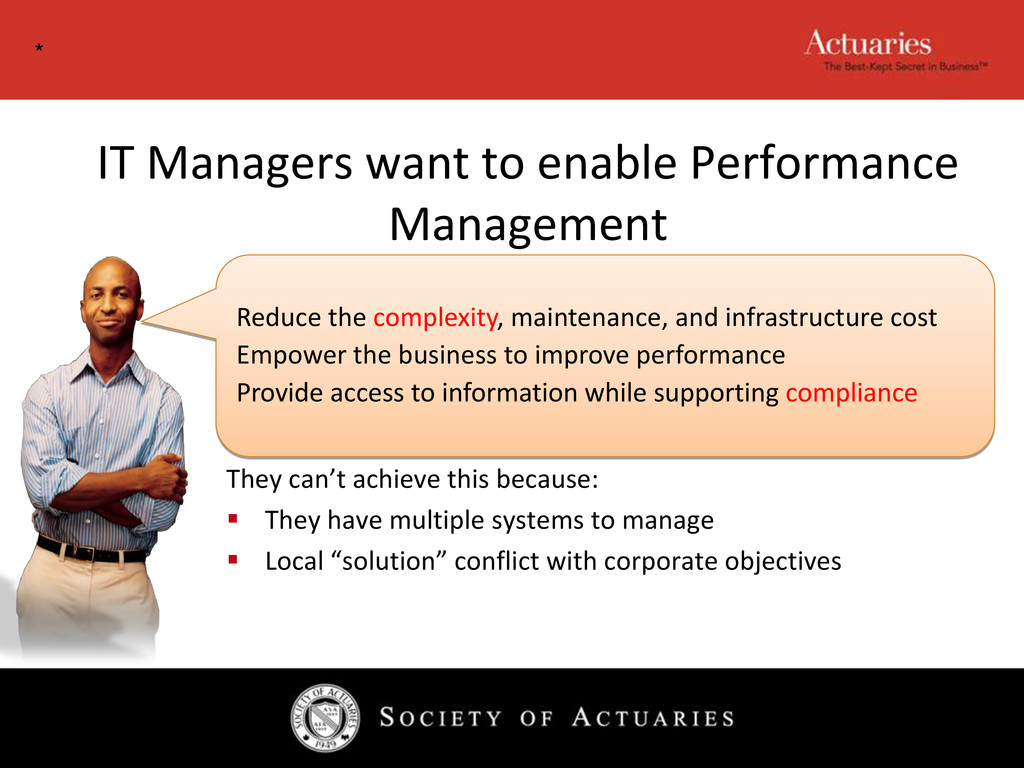
maintenance, and infrastructure cost Empower the business to improve performance Provide access to information while supporting compliance They can’t achieve this because: They have multiple systems to manage Local “solution” conflict with corporate objectives *
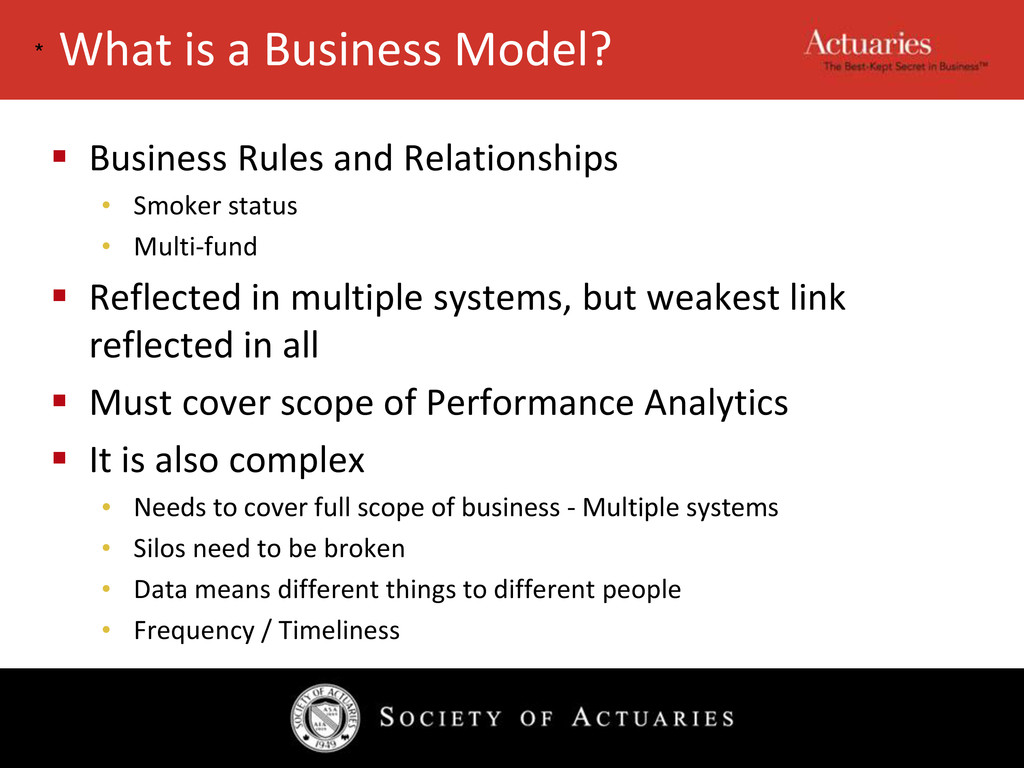
• Smoker status • Multi-fund Reflected in multiple systems, but weakest link reflected in all Must cover scope of Performance Analytics It is also complex • Needs to cover full scope of business - Multiple systems • Silos need to be broken • Data means different things to different people • Frequency / Timeliness *
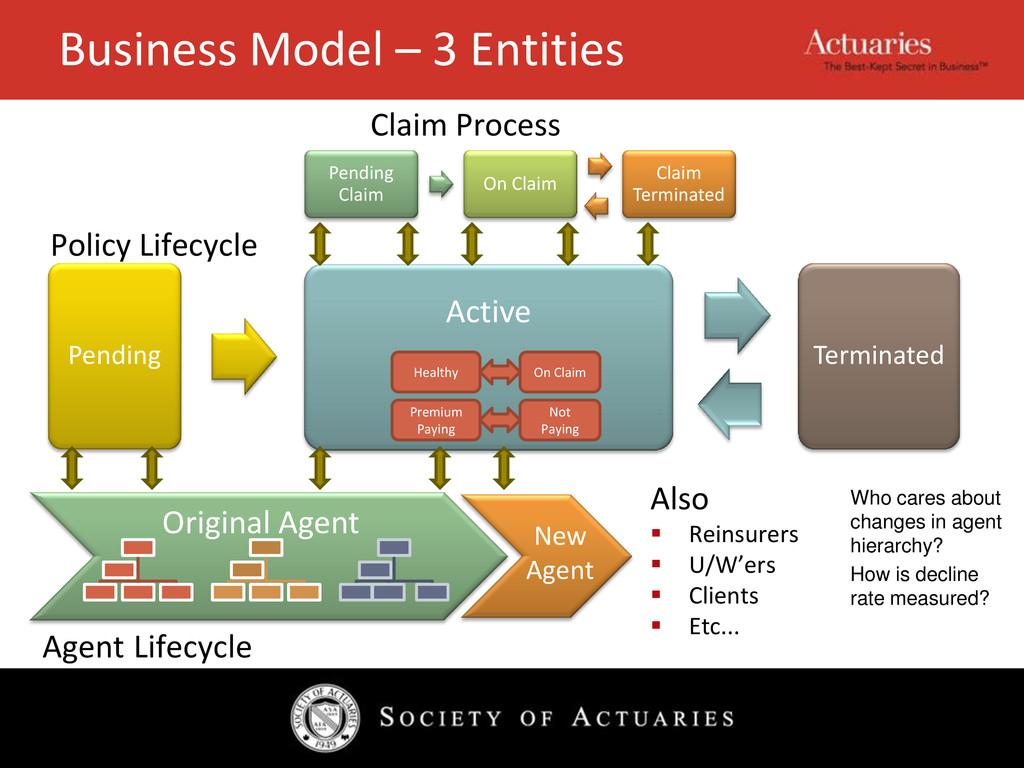
Terminated Business Model – 3 Entities Also Reinsurers U/W’ers Clients Etc... On Claim Healthy Who cares about changes in agent hierarchy? How is decline rate measured? Pending Claim On Claim Claim Terminated Claim Process Not Paying Premium Paying
Sales only care about current – in detail • Actuaries need history • Finance have different view • Operations - admin system (plan code) Not practical to come up with single definition – timing, existing infrastructure (GL, admin) Need to link, not redefine *
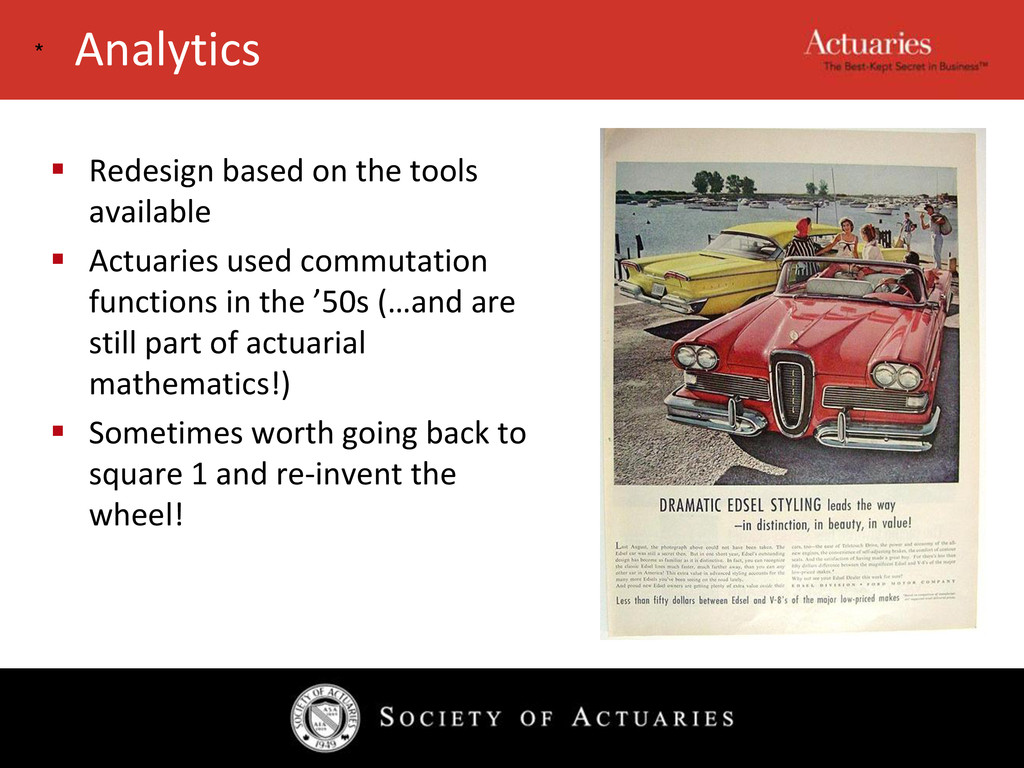
used commutation functions in the ’50s (…and are still part of actuarial mathematics!) Sometimes worth going back to square 1 and re-invent the wheel! *
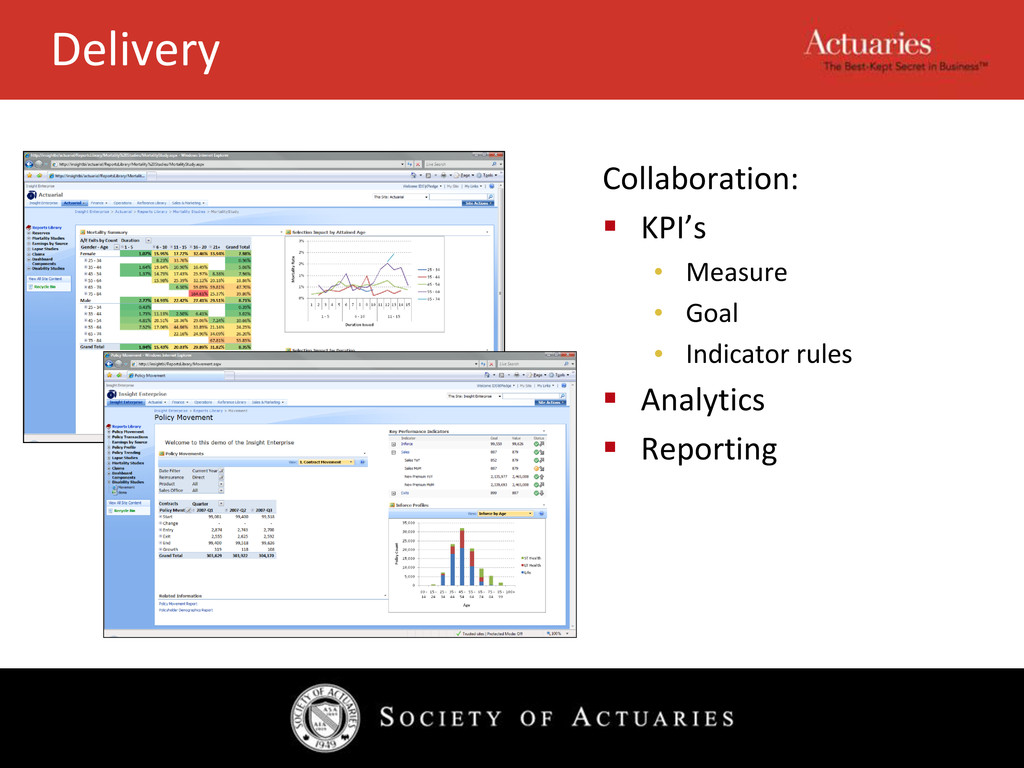
of performance Earnings by Source (from an enterprise perspective) • Defines key metrics • Other metrics can be linked to EBS • Tied to actual earnings Must be adapted to your business model • pmpm *
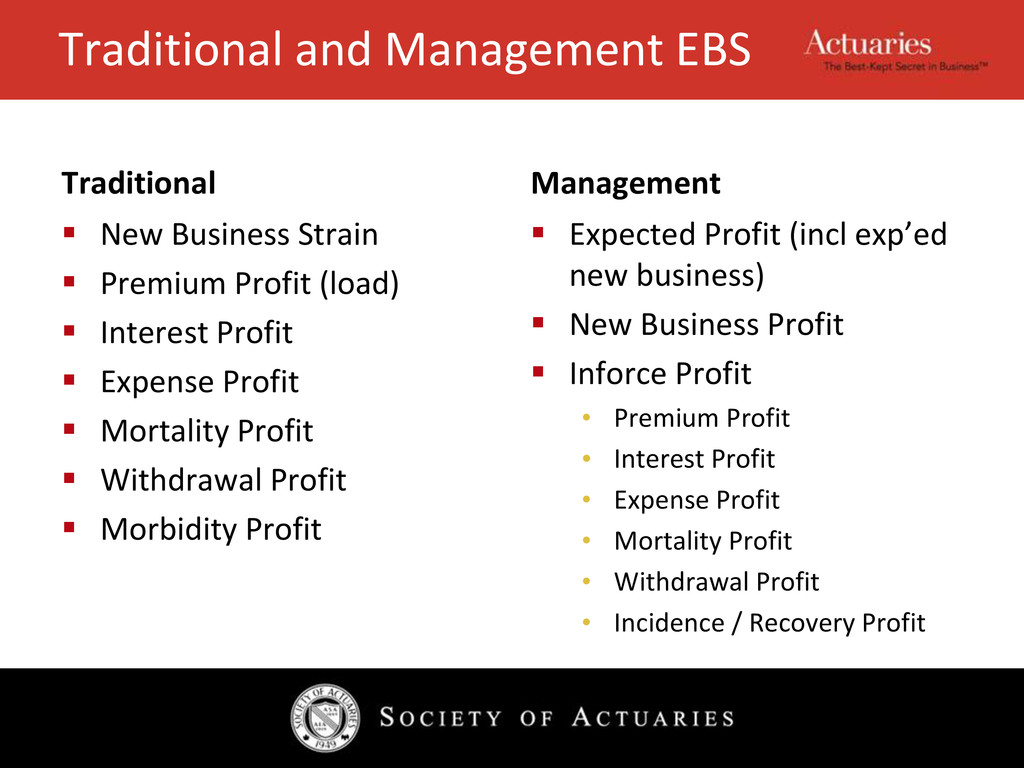
Income / Expenses • Deaths / Surrenders • Incidence / Recovery • New Business Originally developed as tool to understand valuation results Extended to management tool (Collins/Keller 1993) Source of Earnings - Recap
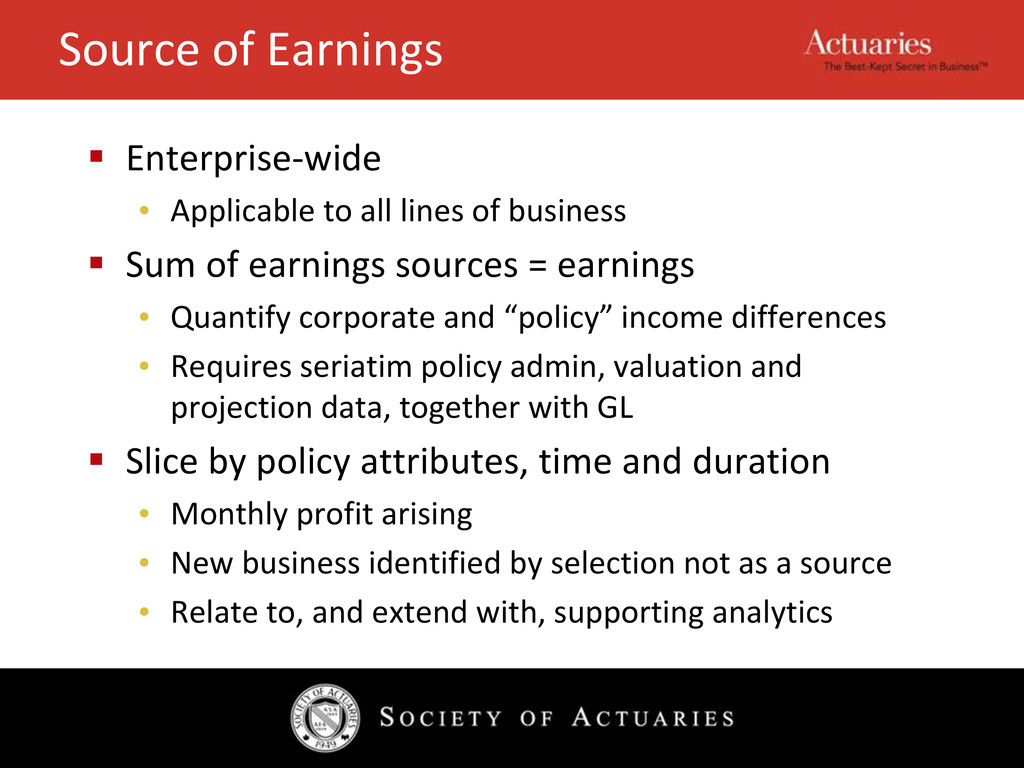
of business Sum of earnings sources = earnings • Quantify corporate and “policy” income differences • Requires seriatim policy admin, valuation and projection data, together with GL Slice by policy attributes, time and duration • Monthly profit arising • New business identified by selection not as a source • Relate to, and extend with, supporting analytics
Recovery Start v Cashflow PP PP Start v Start i R i R 0 0 Start Start v UE UE Healthy Start v v Disabled Entry Healthy Exit R R d R R 1 0 1 0 Disabled Start v v Healthy Entry Disabled Exit R R r R R 1 0 1 0
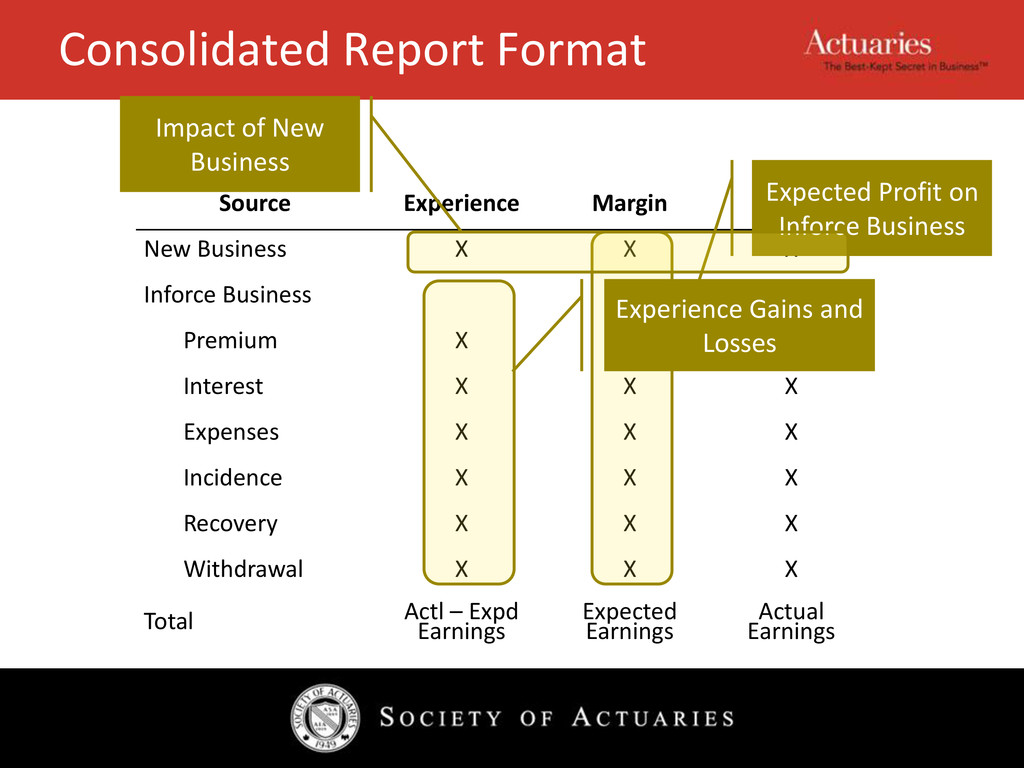
X X Inforce Business Premium X X X Interest X X X Expenses X X X Incidence X X X Recovery X X X Withdrawal X X X Total Actl – Expd Earnings Expected Earnings Actual Earnings Expected Profit on Inforce Business Impact of New Business Experience Gains and Losses
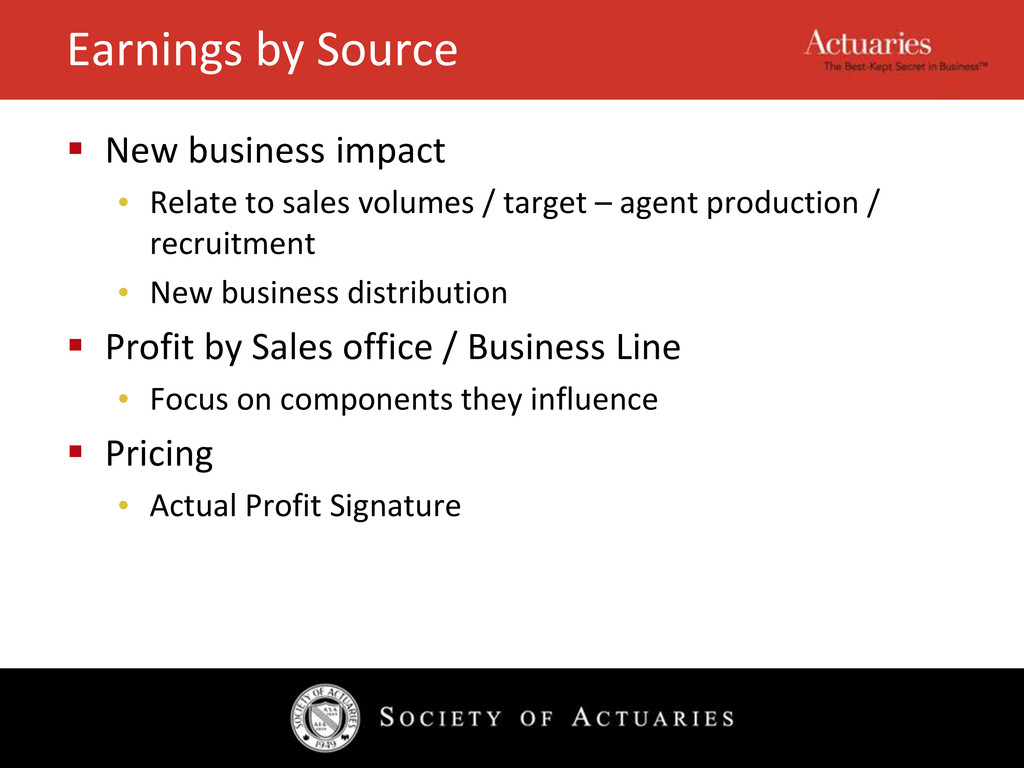
sales volumes / target – agent production / recruitment • New business distribution Profit by Sales office / Business Line • Focus on components they influence Pricing • Actual Profit Signature
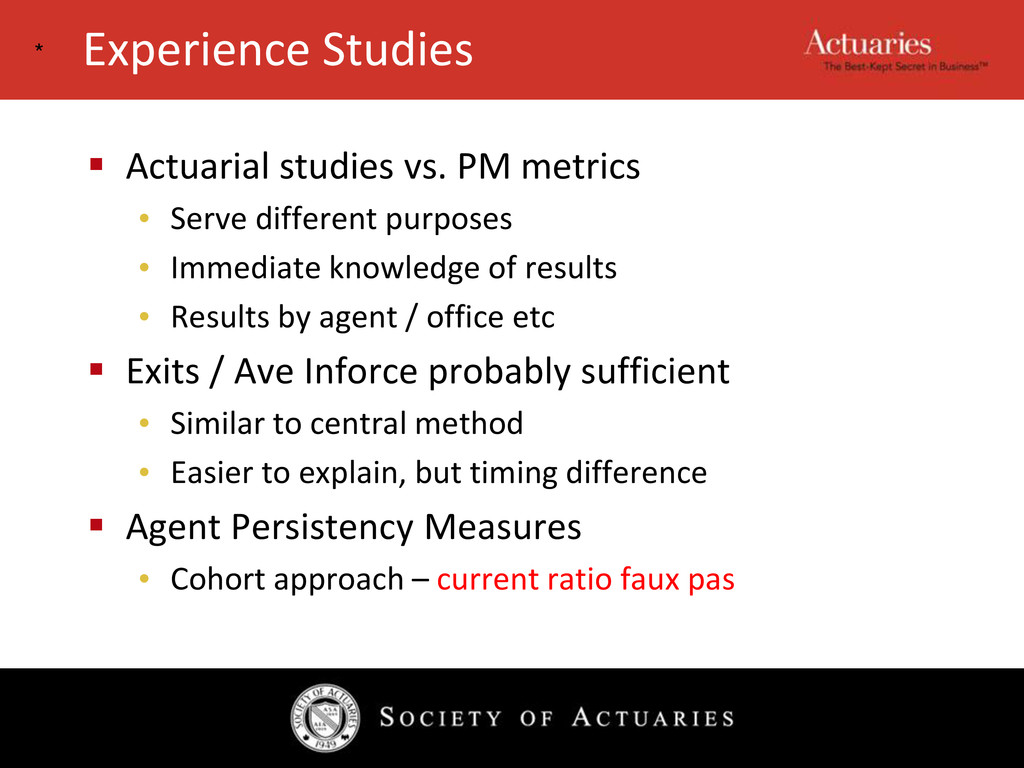
different purposes • Immediate knowledge of results • Results by agent / office etc Exits / Ave Inforce probably sufficient • Similar to central method • Easier to explain, but timing difference Agent Persistency Measures • Cohort approach – current ratio faux pas *
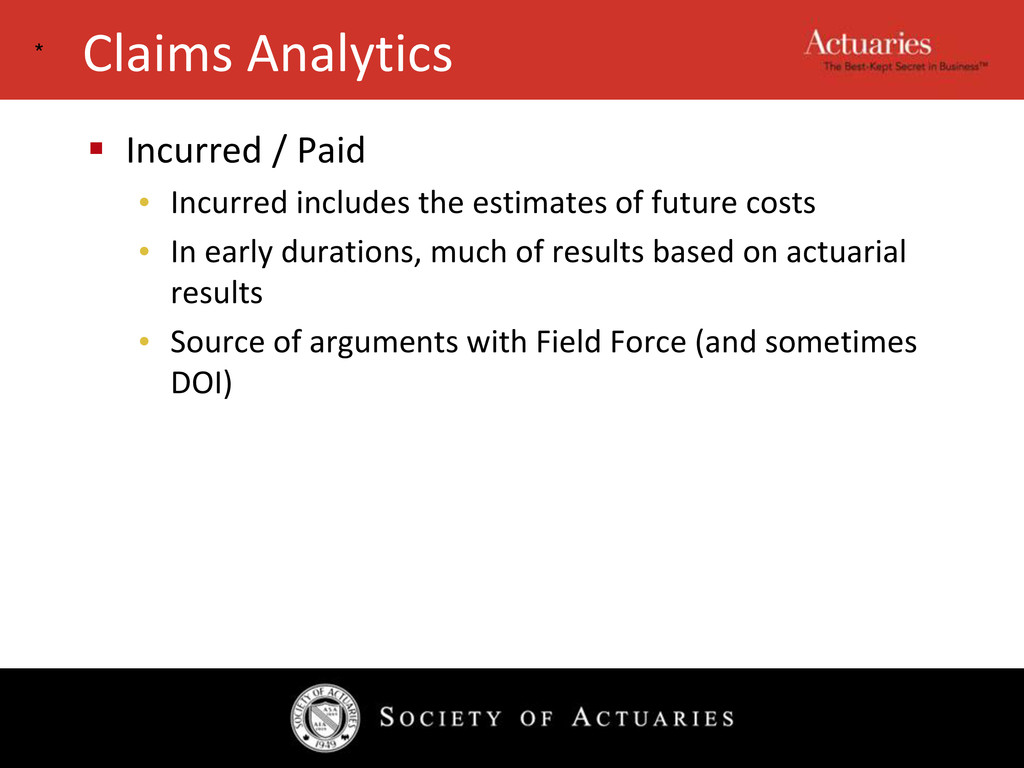
estimates of future costs • In early durations, much of results based on actuarial results • Source of arguments with Field Force (and sometimes DOI) *
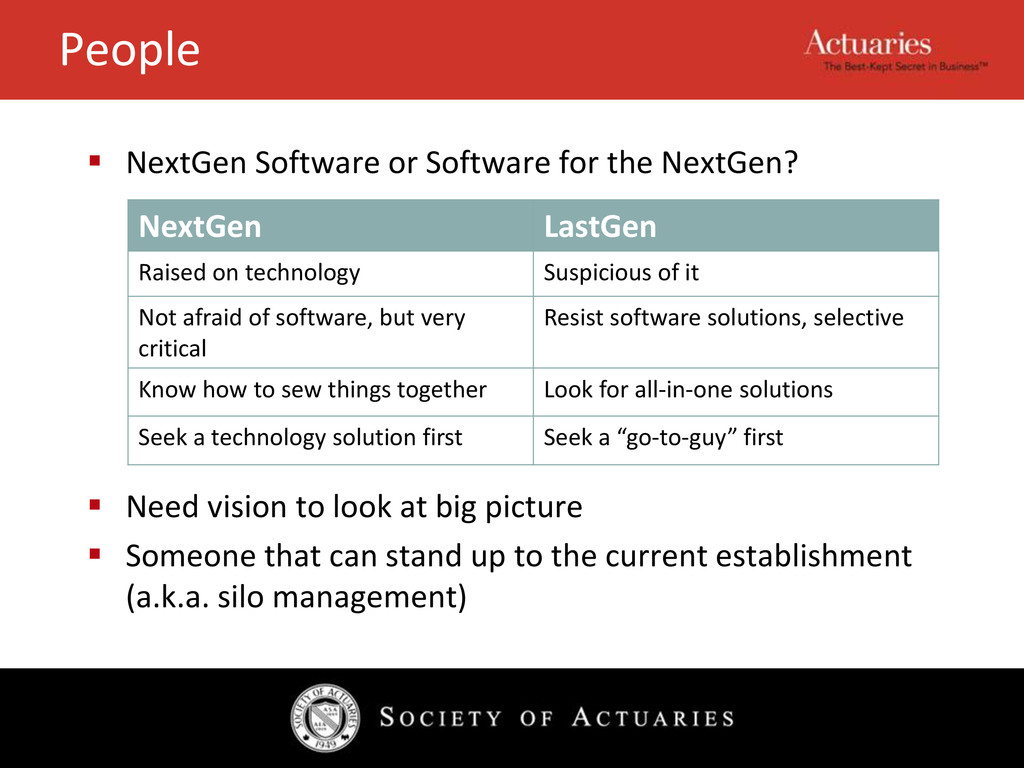
Need vision to look at big picture Someone that can stand up to the current establishment (a.k.a. silo management) NextGen LastGen Raised on technology Suspicious of it Not afraid of software, but very critical Resist software solutions, selective Know how to sew things together Look for all-in-one solutions Seek a technology solution first Seek a “go-to-guy” first
constituent parts in order to study the parts and their relations [ant: synthesis] Synthesis the combination of ideas into a complex whole [ant: analysis] Source: WordNet®3.0
Still indicate trends. Manage and understand – time trending e.g. recession One number doesn’t tell the story – need to look at trending. People want numbers e.g. Profit by sales office Rolling average, trend within is important – disincentive if weighing is applied to stabilize metric
![Thank You Kevin Pledge, [email protected] 905-475-3282, www.insightdecision.com Carl](https://files.speakerdeck.com/presentations/5012b0446fa4ac00020015f6/slide_36.jpg)