Upgrade to Pro — share decks privately, control downloads, hide ads and more …

Defining probability-based rail station catchme...

Sponsored · Your Podcast. Everywhere. Effortlessly. Share. Educate. Inspire. Entertain. You do you. We'll handle the rest.
Avatar for Marcus Young Marcus Young
January 07, 2016

Defining probability-based rail station catchments for demand modelling

This is the presentation that I delivered at the Universities' Transport Study Group (UTSG) Conference in Bristol on 7 January 2016.

Avatar for Marcus Young

Marcus Young

January 07, 2016
Tweet

More Decks by Marcus Young

Other Decks in Research

Transcript

  1. Defining probability-based rail station catchments for demand modelling. Marcus Young

    PhD student, Transportation Research Group 7 January 2016
  2. 2 Outline • Research background • Developing a station choice

    model • Model results • Generating probability-based catchments • Conclusions and further work
  3. 4 Rail renaissance 0 200 400 600 800 1000 1200

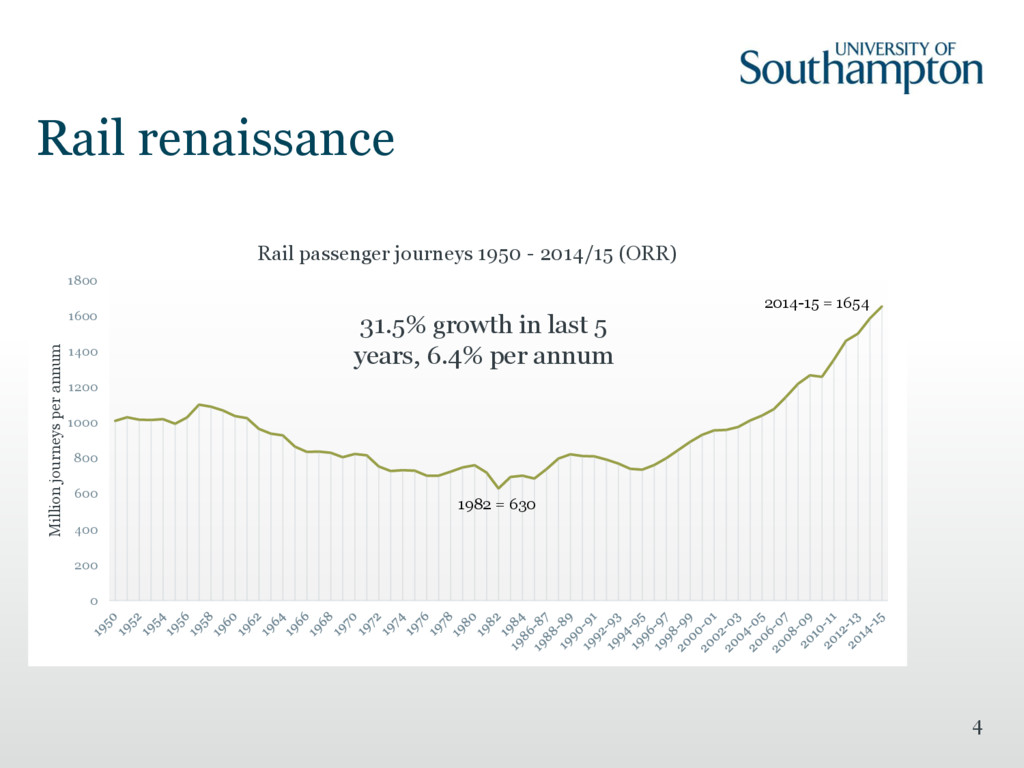
    1400 1600 1800 Million journeys per annum Rail passenger journeys 1950 - 2014/15 (ORR) 1982 = 630 2014-15 = 1654 31.5% growth in last 5 years, 6.4% per annum
  4. New stations 5 • Increasing interest in using rail to

    meet transport needs or drive economic growth • Need accurate demand forecasts
  5. 6 Demand models – defining catchments • Trip rate, trip

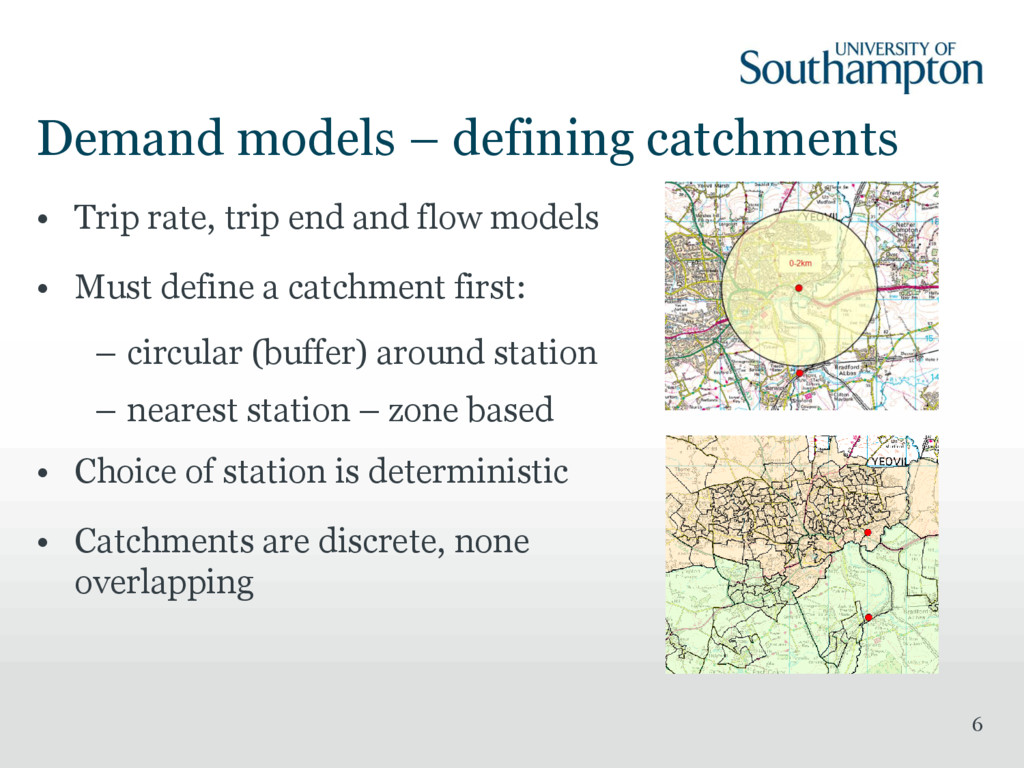
    end and flow models • Must define a catchment first: – circular (buffer) around station – nearest station – zone based • Choice of station is deterministic • Catchments are discrete, none overlapping
  6. 7 Catchments in reality • 2km circular catchments account for

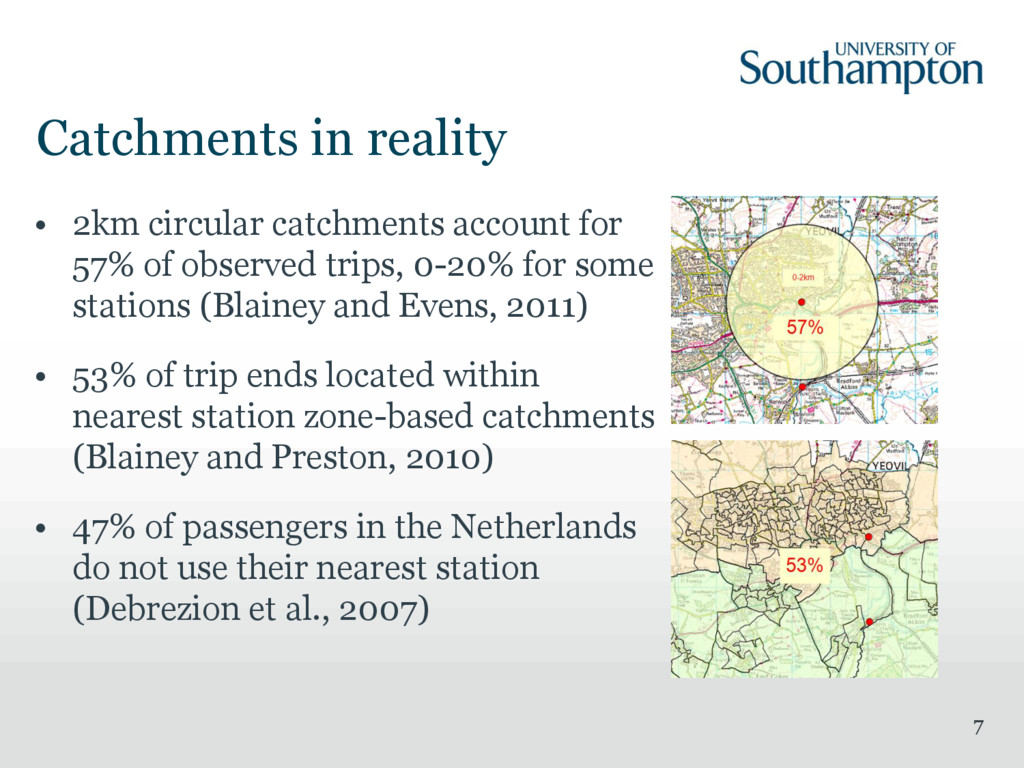
    57% of observed trips, 0-20% for some stations (Blainey and Evens, 2011) • 53% of trip ends located within nearest station zone-based catchments (Blainey and Preston, 2010) • 47% of passengers in the Netherlands do not use their nearest station (Debrezion et al., 2007)
  7. 8 Catchments in reality • Catchments are not discrete. They

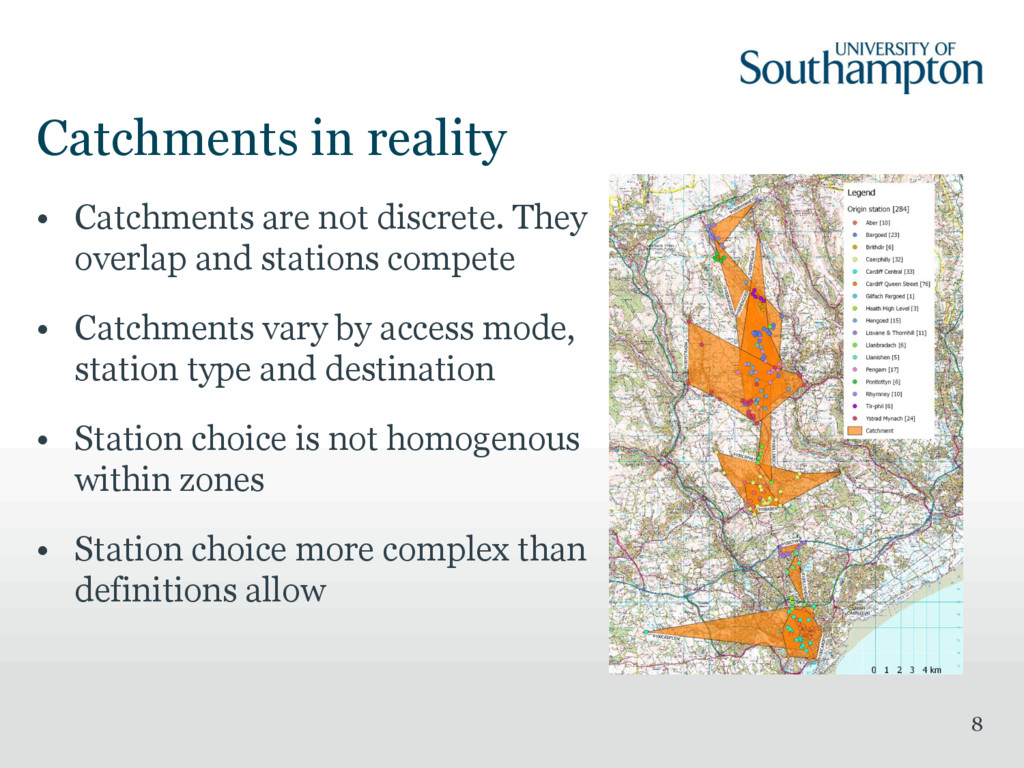
    overlap and stations compete • Catchments vary by access mode, station type and destination • Station choice is not homogenous within zones • Station choice more complex than definitions allow
  8. 9 Alternative – probability-based catchment • For each zone calculate

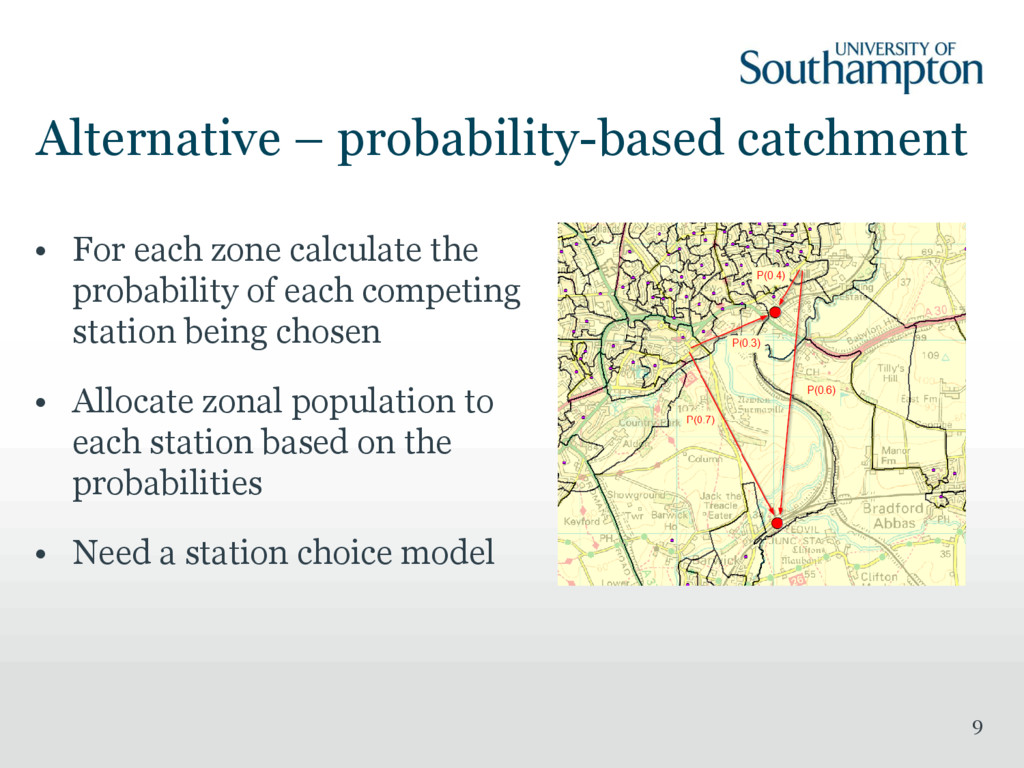
    the probability of each competing station being chosen • Allocate zonal population to each station based on the probabilities • Need a station choice model
  9. 11 Discrete choice models • Individual chooses the alternative that

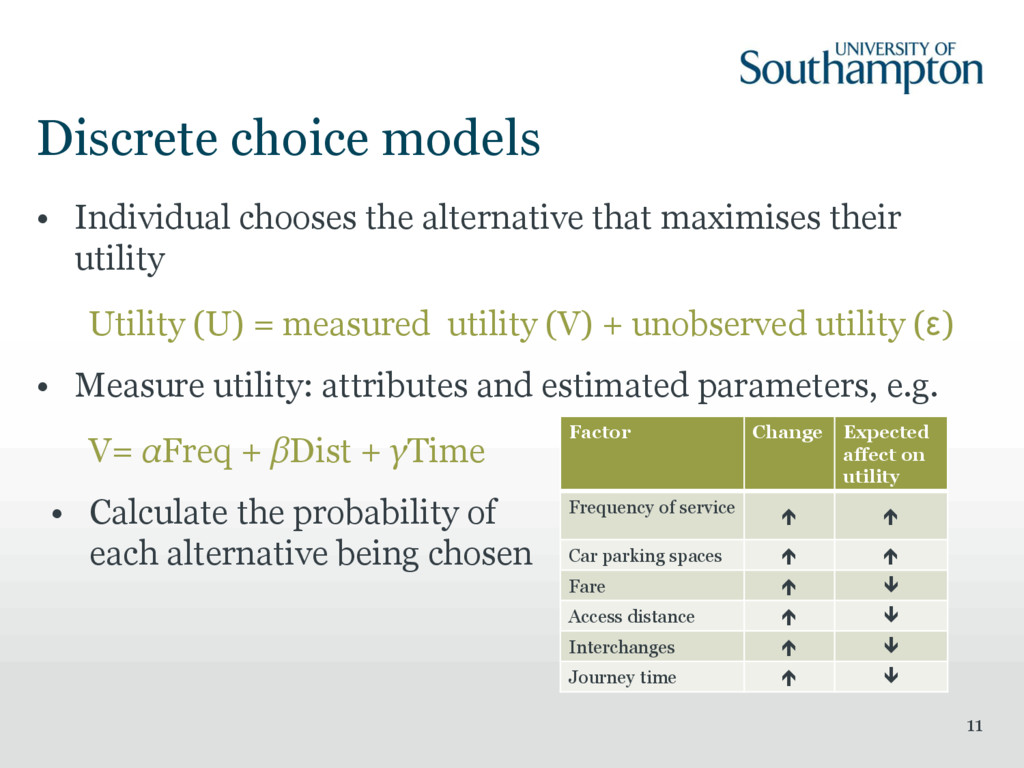
    maximises their utility Utility (U) = measured utility (V) + unobserved utility (ε) • Measure utility: attributes and estimated parameters, e.g. V= αFreq + βDist + γTime Factor Change Expected affect on utility Frequency of service   Car parking spaces   Fare   Access distance   Interchanges   Journey time   • Calculate the probability of each alternative being chosen
  10. Data requirements 12 • Observed choice data - on-train survey

    Cardiff Central to Rhymney line, 284 usable observations • Attribute data individual chosen alternative cardist rank cartime cctv choice nearest unstaffed partTime 1 9100CRPHLY 9100TYGLAS 7.65 10 16.3 1 0 0 1 0 1 9100CRPHLY 9100RHIWBNA 7.36 9 15.05 1 0 0 1 0 1 9100CRPHLY 9100LLISHEN 7.08 8 16.93 1 0 0 1 0 1 9100CRPHLY 9100BCHGRV 6.83 7 13.97 0 0 0 1 0 1 9100CRPHLY 9100TAFFSWL 6.46 6 13.95 1 0 0 0 1 1 9100CRPHLY 9100LTHH 5.73 5 11.77 1 0 0 1 0 1 9100CRPHLY 9100LLBRDCH 4.83 4 9.38 0 0 0 1 0 1 9100CRPHLY 9100ERGNCHP 2.81 3 7.93 0 0 0 1 0 1 9100CRPHLY 9100ABER 2.06 2 5.87 1 0 0 0 1 1 9100CRPHLY 9100CRPHLY 1.06 1 3.02 1 1 1 0 1
  11. 13 Data – OpenTripPlanner • Open source multi-modal route planner

    with API • OpenStreetMap – for street and path routing • GTFS feeds – for train and bus routing • API wrapper written in R
  12. 14 Data sources: 1. OpenTripPlanner 2. NRE Knowledgebase XML Feed

    3. BR Fares 4. Derived from data Data – explanatory variables Access journey Origin station facilities Train leg • Drive distance1 • Drive time1 • Walk time1 • Bus time1 • Nearest station (y/n)4 • CCTV (y/n)2 • Car parking spaces2 • Staffing level2 – Unstaffed – Part-time – Full-time • Journey duration1 • No. of transfers1 • Fare3 • Difference between actual and desired departure time1
  13. 15 Model details • Choice set varies by individual, defined

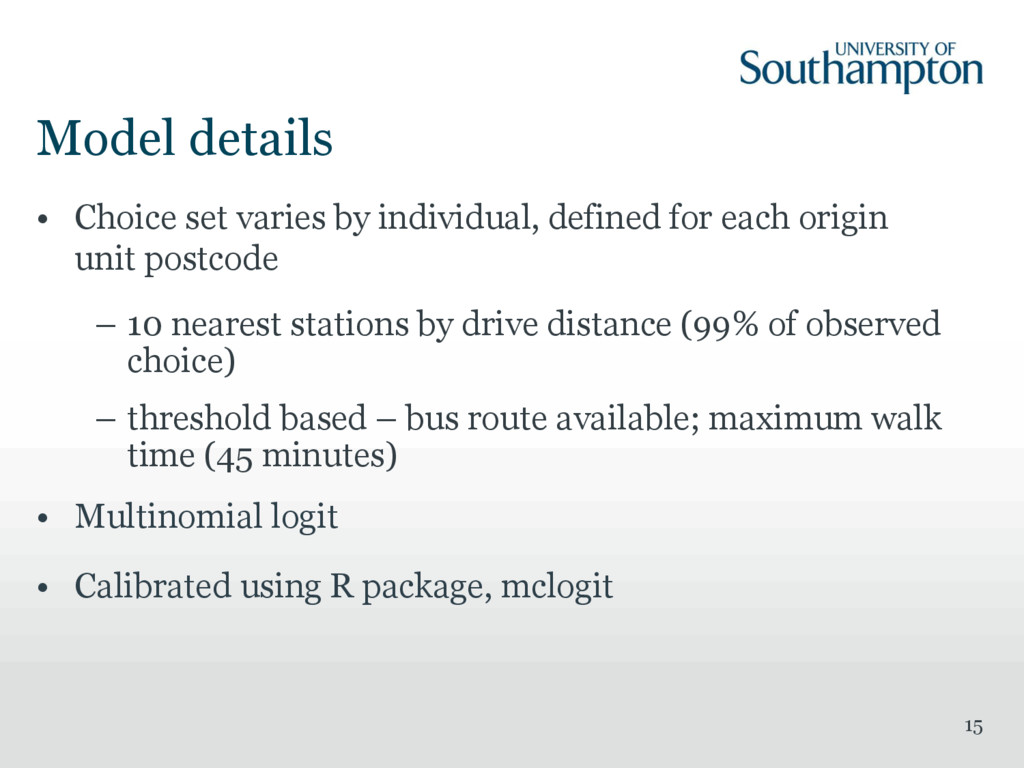
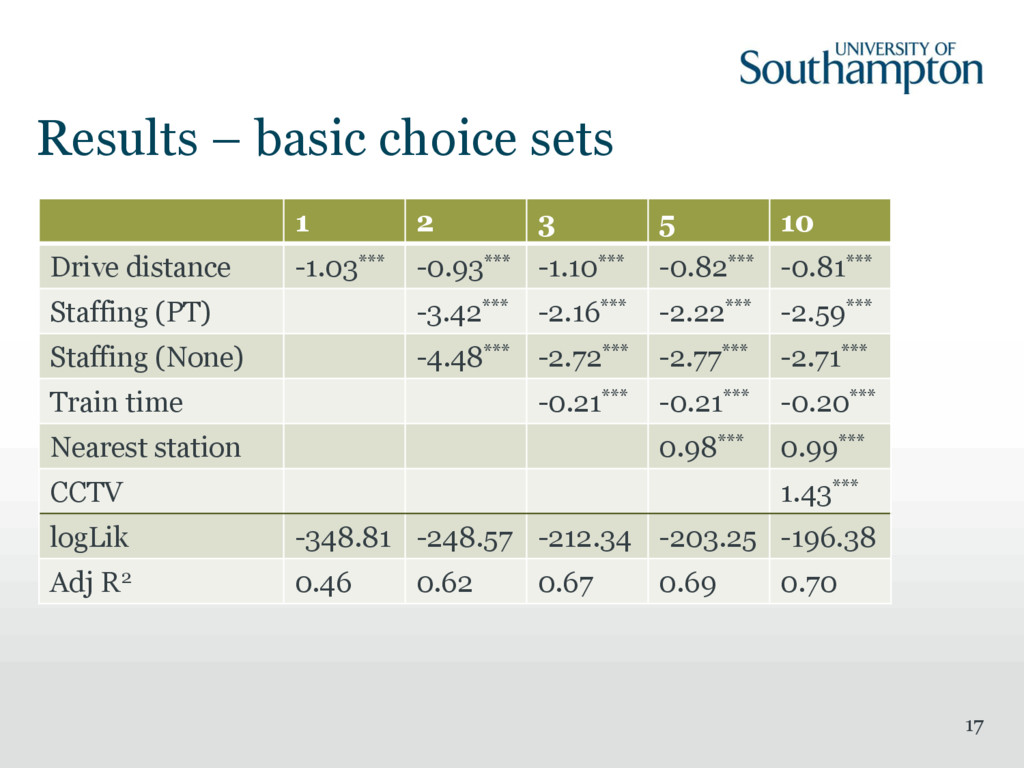
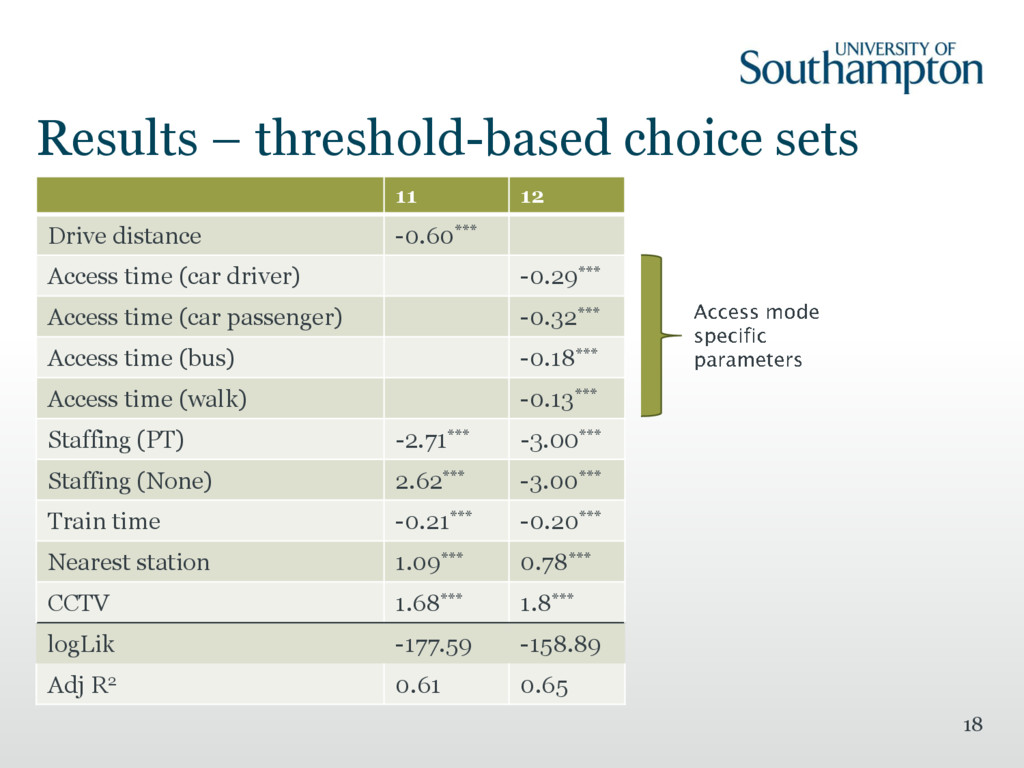
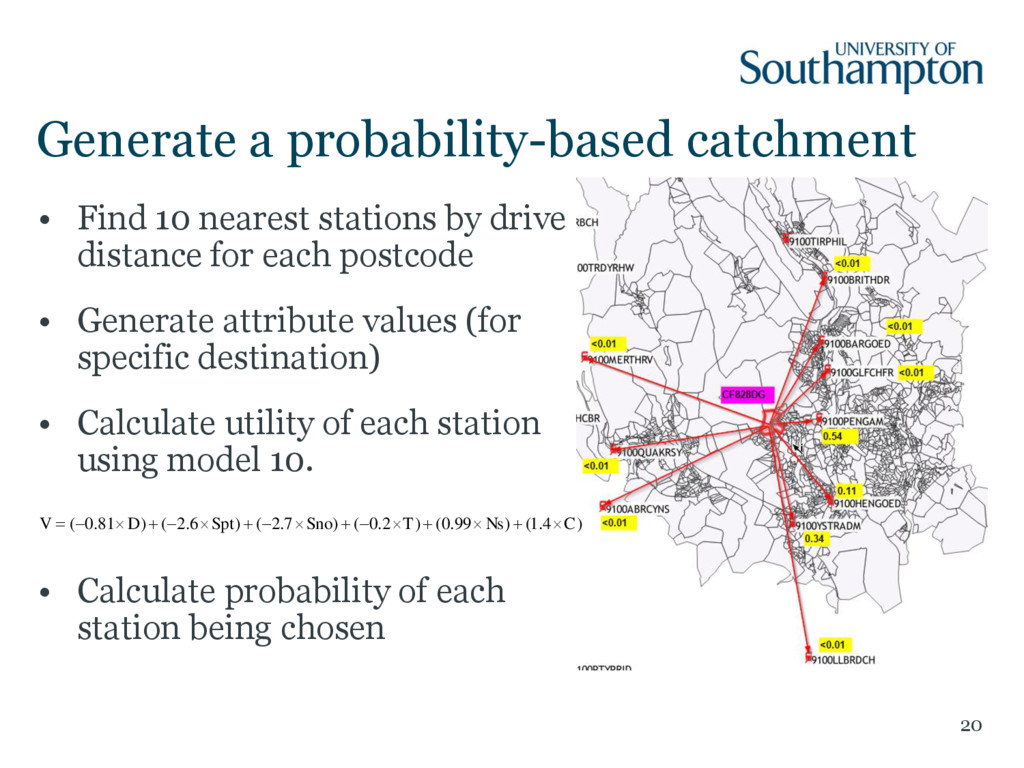
    for each origin unit postcode – 10 nearest stations by drive distance (99% of observed choice) – threshold based – bus route available; maximum walk time (45 minutes) • Multinomial logit • Calibrated using R package, mclogit
  14. 17 Results – basic choice sets 1 2 3 5

    10 Drive distance -1.03*** -0.93*** -1.10*** -0.82*** -0.81*** Staffing (PT) -3.42*** -2.16*** -2.22*** -2.59*** Staffing (None) -4.48*** -2.72*** -2.77*** -2.71*** Train time -0.21*** -0.21*** -0.20*** Nearest station 0.98*** 0.99*** CCTV 1.43*** logLik -348.81 -248.57 -212.34 -203.25 -196.38 Adj R2 0.46 0.62 0.67 0.69 0.70
  15. 18 Results – threshold-based choice sets 11 12 Drive distance

    -0.60*** Access time (car driver) -0.29*** Access time (car passenger) -0.32*** Access time (bus) -0.18*** Access time (walk) -0.13*** Staffing (PT) -2.71*** -3.00*** Staffing (None) 2.62*** -3.00*** Train time -0.21*** -0.20*** Nearest station 1.09*** 0.78*** CCTV 1.68*** 1.8*** logLik -177.59 -158.89 Adj R2 0.61 0.65
  16. Generate a probability-based catchment 20 • Find 10 nearest stations

    by drive distance for each postcode • Generate attribute values (for specific destination) • Calculate utility of each station using model 10. • Calculate probability of each station being chosen ) 4 . 1 ( ) 99 . 0 ( ) 2 . 0 ( ) 7 . 2 ( ) 6 . 2 ( ) 81 . 0 ( C Ns T Sno Spt D V                
  17. Example – Ystrad Mynach 21 Probability-based catchment – to Cardiff

    Central 2km radial and nearest station catchments
  18. Conclusions • It is possible to calibrate a relatively simple

    station choice model that fits the observed data well • The model can be used to generate probability-based station catchments that are a realistic representation of observed catchments • The probability-based catchments perform better than deterministic station catchments 23
  19. Future work • Apply methods to larger surveys • Develop

    more sophisticated models - multinomial logit models suffer from proportional substitution behaviour • Need to ensure a realistic representation of abstraction from existing stations – this effect could undermine the business case for a new station • Incorporate probability-based catchments into the rail demand models 24