Upgrade to Pro — share decks privately, control downloads, hide ads and more …

Explaining Machine Learning for Customer Churn [Learning Lab 20]

Matt Dancho
October 09, 2019

Explaining Machine Learning for Customer Churn [Learning Lab 20]

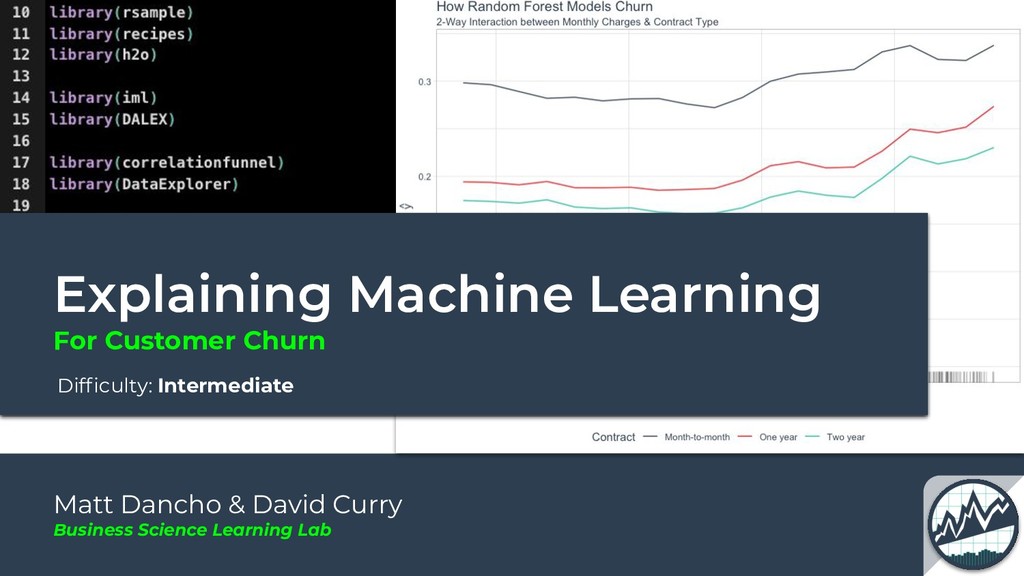
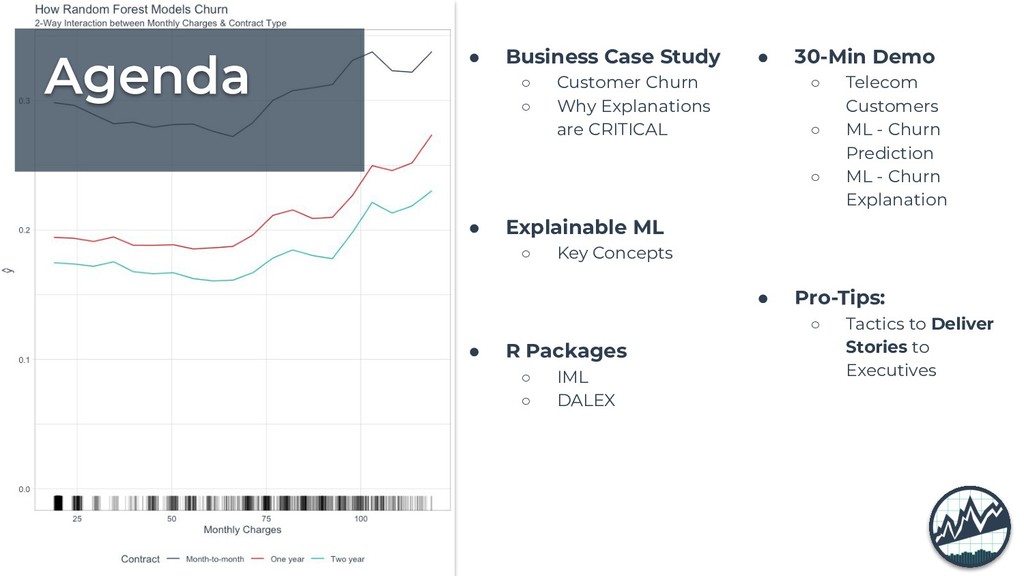
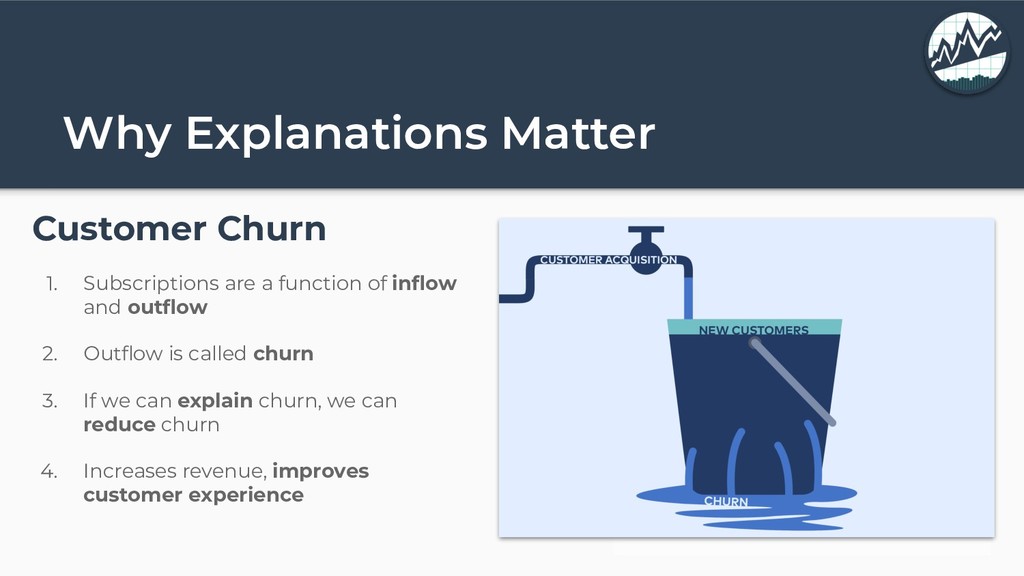
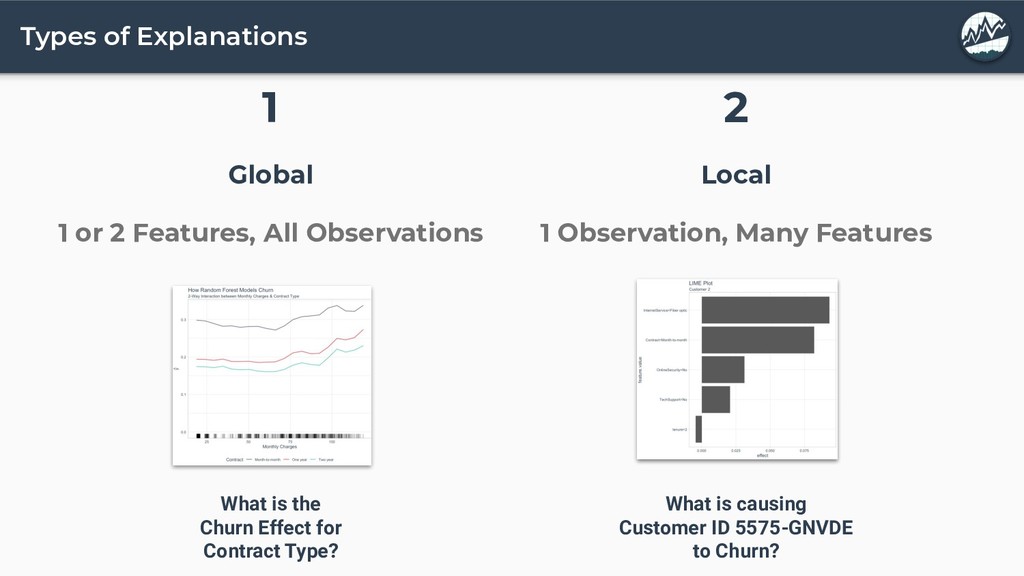
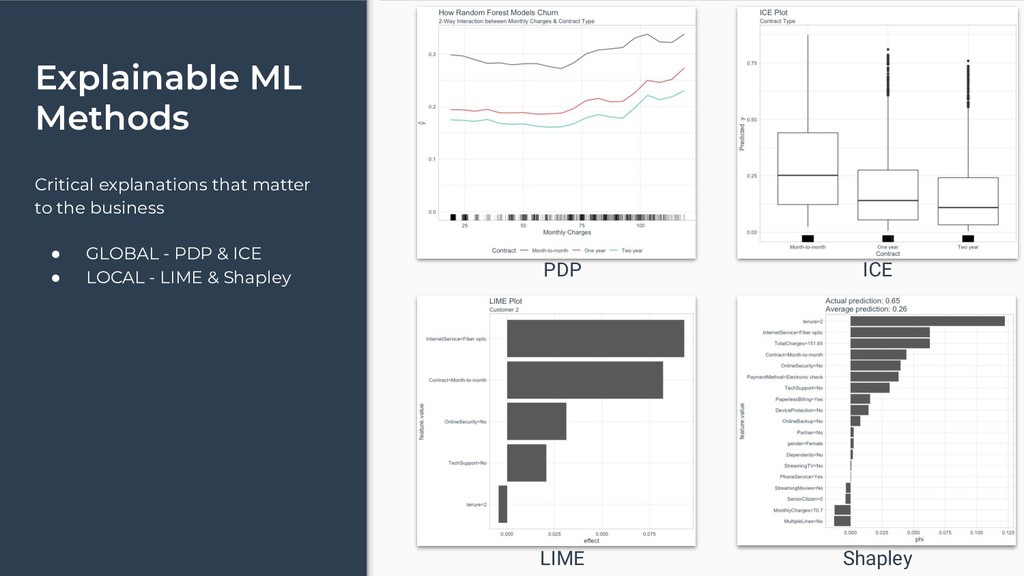
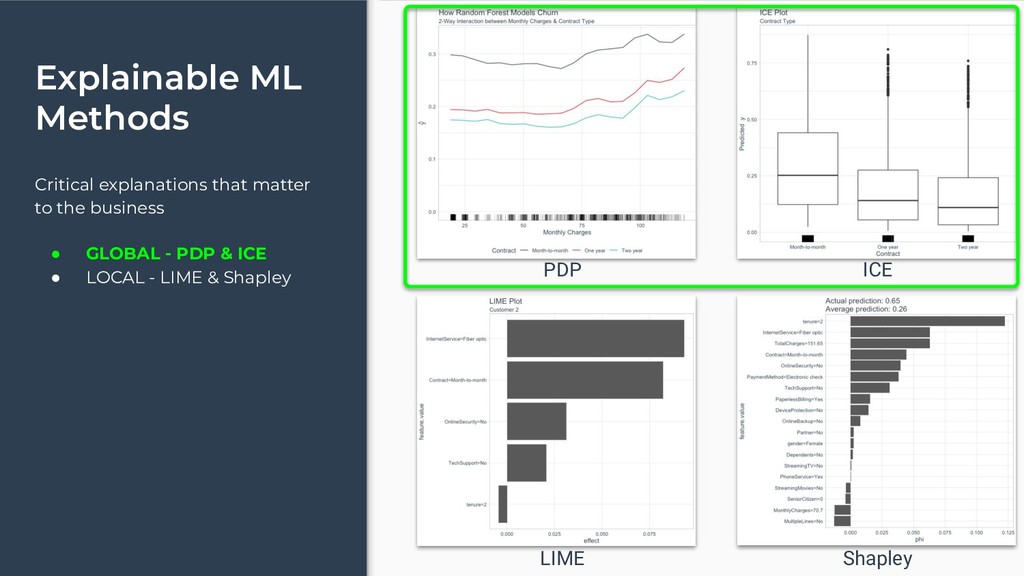
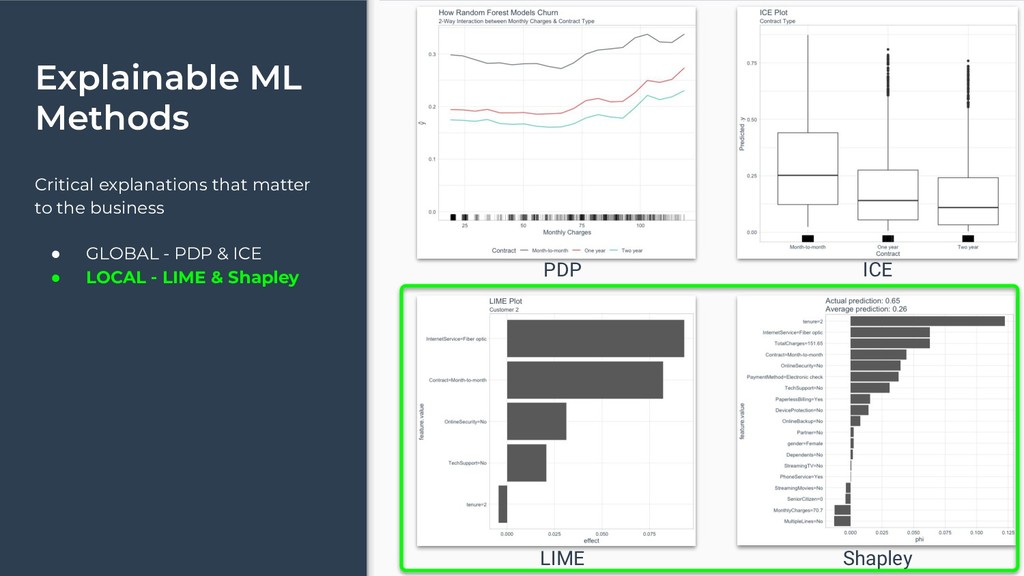
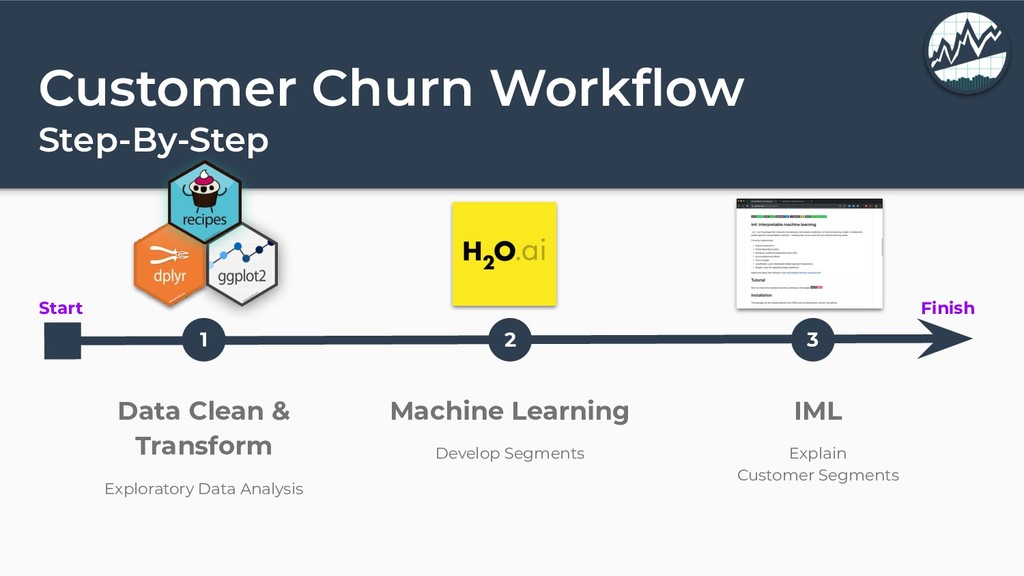
In business, explanations are everything. The problem is that high-performance machine learning models are black-boxes - Not explainable. Without explanations, we can't make good business decisions.

In this presentation, we cover a new series of tools that improve the explainability of black-box machine learning models, specifically Partial Dependence Plots (PDP), ICE Plots, LIME Plots, and Shapley Values / Plots.

Matt Dancho

October 09, 2019
Tweet

More Decks by Matt Dancho

Other Decks in Business

Transcript

  1. For Customer Churn Matt Dancho & David Curry Business Science

    Learning Lab Difficulty: Intermediate Explaining Machine Learning
  2. Success Story Casper Craus - Data Engineer - Keyphase -

    Started course 5 Weeks Ago - Got the job! “Before starting DS4B 101, I was in the middle of a job transition. I got the job, and I’m hired as a Data Engineer.” #Business Science Success
  3. Agenda • Business Case Study ◦ Customer Churn ◦ Why

    Explanations are CRITICAL • Explainable ML ◦ Key Concepts • R Packages ◦ IML ◦ DALEX • 30-Min Demo ◦ Telecom Customers ◦ ML - Churn Prediction ◦ ML - Churn Explanation • Pro-Tips: ◦ Tactics to Deliver Stories to Executives
  4. Learning Labs PRO Every 2-Weeks 1-Hour Course Recordings + Code

    + Slack $19/month university.business-science.io Lab 19 Using Customer Credit Card History for Networks Analysis Lab 18 Time Series Anomaly Detection with anomalize Lab 17 Anomaly Detection with H2O Machine Learning Lab 16 R’s Optimization Toolchain, Part 2 - Nonlinear Programming Lab 15 R’s Optimization Toolchain, Part 1 - Linear Programming Lab 14 Customer Churn Survival Analysis Continuous Learning Jet Fuel for your Brain
  5. Why Explanations Matter Customer Churn 1. Subscriptions are a function

    of inflow and outflow 2. Outflow is called churn 3. If we can explain churn, we can reduce churn 4. Increases revenue, improves customer experience
  6. Telecommunications Subscriptions Understand Subscriber Behavior 1. Use Random Forest to

    model behavior 2. Use Explainable ML to understand what is causing RF to predict churn
  7. Global 1 or 2 Features, All Observations Types of Explanations

    Local 1 Observation, Many Features 1 2 What is the Churn Effect for Contract Type? What is causing Customer ID 5575-GNVDE to Churn?
  8. Explainable ML Methods Critical explanations that matter to the business

    • GLOBAL - PDP & ICE • LOCAL - LIME & Shapley PDP ICE LIME Shapley
  9. Explainable ML Methods Critical explanations that matter to the business

    • GLOBAL - PDP & ICE • LOCAL - LIME & Shapley PDP ICE LIME Shapley
  10. Explainable ML Methods Critical explanations that matter to the business

    • GLOBAL - PDP & ICE • LOCAL - LIME & Shapley PDP ICE LIME Shapley
  11. Partial Dependence Plots (PDP) - Global Key Concept Show how

    the expected model response for random observations. Hold all other features constant & vary feature of interest. Then Average Results. https://pbiecek.github.io/PM_VEE/partialDependenceProfiles.html
  12. Individual Conditional Expectation (ICE) Plot - Global Key Concept Same

    as PDP, except: Don’t Average (unlike PDP). Center (if desired). Show Trend Line (if desired). https://christophm.github.io/interpretable-ml-book/ice.html ICE ICE (Centered)
  13. Local Interpretable Model-Agnostic Explanation (LIME) Plot - Local Key Concept

    Select observation of interest Probe the Black Box with permuted samples of training data. Weight sample by proximity to sample of interest. Train an interpretable model on weighted: - Lasso - Decision Tree https://christophm.github.io/interpretable-ml-book/ice.html
  14. Shapley Value Plot - Local Key Concept Each Feature is

    Player in Game Prediction is Payout How much has each feature contributed to the prediction? Coalition - Features that work together to make prediction Gain - The actual prediction minus the average for all features Shapley Value - Average Contribution to the prediction in different coalitions https://christophm.github.io/interpretable-ml-book/ice.html
  15. LIME vs Shapley LIME • Con - Does not guarantee

    a fair distribution • Con - Assumes Linear Behavior • Pro - Very Fast • Pro - Effect is Weight x Feature Value = Impact to Linear Model Shapley • Pro - Guarantees a fair distribution of feature values • Pro - Models explanations as a game • Con - Can be very slow as coalitions of features increase • Con - Phi not easily interpreted
  16. One more method… SHAP SHAP (SHapley Additive exPlanations) The goal

    of SHAP is to explain the prediction of an instance x by computing the contribution of each feature to the prediction. More interpretable than Shapley - SHAP is additive & closer to LIME’s “Effect” Still slow - KernelSHAP is extremely slow, TreeSHAP is faster Implemented in DALEX
  17. Customer Churn Workflow Step-By-Step Start Finish 1 2 3 Data

    Clean & Transform Exploratory Data Analysis Machine Learning Develop Segments IML Explain Customer Segments
  18. Pro Tip #1 Make a correlation funnel Get a general

    understanding of your model. Focus on explaining the top features
  19. Pro Tip #2 Build a feature story Use top features

    Check interactions Build a story
  20. Pro Tip #3 Pick one customer, and explain her! Talk

    about what specifically makes her susceptible to leaving
  21. Customer Churn Workflow Step-By-Step Start Finish 1 2 3 Data

    Clean & Transform Exploratory Data Analysis Machine Learning Develop Segments IML Explain Customer Segments
  22. Advanced Visualization Advanced Data Wrangling Advanced Functional Programming & Modeling

    Advanced Data Science Visualization Data Cleaning & Manipulation Functional Programming & Modeling Business Reporting Business Analysis with R (DS4B 101-R) Data Science For Business with R (DS4B 201-R) R Shiny Web Apps For Business (DS4B 102-R) Web Apps Data Science Foundations 7 Weeks Machine Learning & Business Consulting 10 Weeks Web Application Development 4 Weeks -TRACK Project-Based Courses with Business Application Business Science University R-Track 3-Course R-Track System
  23. Key Benefits - Fundamentals - Weeks 1-5 (25 hours of

    Video Lessons) - Data Manipulation (dplyr) - Time series (lubridate) - Text (stringr) - Categorical (forcats) - Visualization (ggplot2) - Programming & Iteration (purrr) - 3 Challenges - Machine Learning - Week 6 (8 hours of Video Lessons) - Clustering (3 hours) - Regression (5 hours) - 2 Challenges - Learn Business Reporting - Week 7 - RMarkdown & plotly - 2 Project Reports: 1. Product Pricing Algo 2. Customer Segmentation Visualization Data Cleaning & Manipulation Functional Programming & Modeling Business Reporting Business Analysis with R (DS4B 101-R) Data Science Foundations 7 Weeks
  24. Key Benefits Understanding the Problem & Preparing Data - Weeks

    1-4 - Project Setup & Framework - Business Understanding / Sizing Problem - Tidy Evaluation - rlang - EDA - Exploring Data -GGally, skimr - Data Preparation - recipes - Correlation Analysis - 3 Challenges Machine Learning - Weeks 5, 6, 7 - H2O AutoML - Modeling Churn - ML Performance - LIME Feature Explanation Return-On-Investment - Weeks 7, 8, 9 - Expected Value Framework - Threshold Optimization - Sensitivity Analysis - Recommendation Algorithm Data Science For Business (DS4B 201-R) Machine Learning & Business Consulting 10 Weeks Advanced Visualization Advanced Data Wrangling Advanced Functional Programming & Modeling Advanced Data Science End-to-End Churn Project
  25. Key Benefits Learn Shiny & Flexdashboard - Build Applications -

    Learn Reactive Programming - Integrate Machine Learning App #1: Predictive Pricing App - Model Product Portfolio - XGBoost Pricing Prediction - Generate new products instantly App #2: Sales Dashboard with Demand Forecasting - Model Demand History - Segment Forecasts by Product & Customer - XGBoost Time Series Forecast - Generate new forecasts instantly Shiny Apps for Business (DS4B 102-R) Web Application Development 4 Weeks Web Apps Machine Learning
  26. Success Story Masatake Hirono - Took DS4B 201-R - Completed

    the 10-Week Course - Landed a Job at one of the most Prestigious Management Consulting Firms “This course showed me how to place data analytics in real business settings.” #Business Science Success