$30 off During Our Annual Pro Sale. View Details »

Towards online profiling of Erlang systems

Towards online profiling of Erlang systems

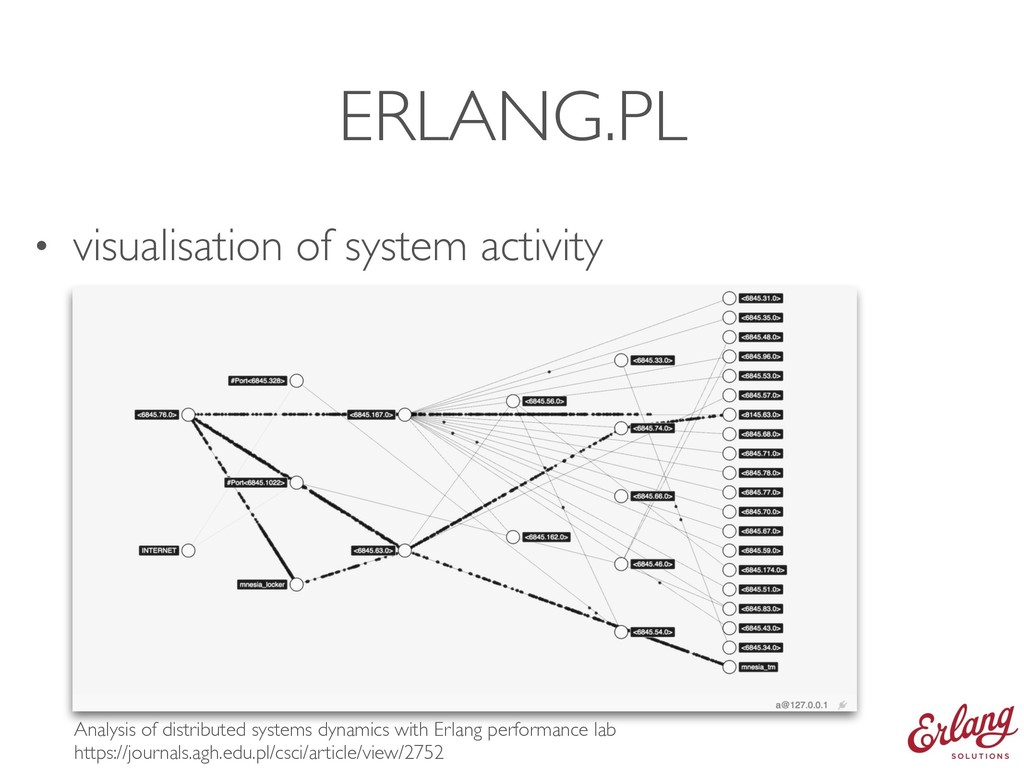
Recent releases of Erlang/OTP introduced features, which can be used to improve profiling tools for systems executed on the BEAM virtual machine. We discuss the need to introduce improvements into profiling tools with the Erlang-style concurrency in mind, so that they can help to understand performance of message passing and utilization of processes. We propose a new approach to implementation of the crucial element of such tools: the concurrent counters updates mechanism. To demonstrate the limitations of current tools in this area and verify the proposed approach, we present the results of a synthetic benchmark. The results clearly show that the proposed approach is a step towards a new generation of online profiling tools.

Michał Ślaski

August 18, 2019
Tweet

More Decks by Michał Ślaski

Other Decks in Programming

Transcript

  1. TOWARDS ONLINE
    PROFILING
    Michał Ślaski
    Wojciech Turek
    @ Erlang Solutions
    @ AGH University
    Erlang Workshop, 18 August 2019

    View Slide

  2. ABOUT ME
    • AGH'2005
    • Workshop'2006
    • Tech Lead'2012
    • Lambda Days'2020
    From HTTP to HTML
    From HTTP to HTML
    Experiences in Web Based Service
    Experiences in Web Based Service
    Applications
    Applications
    ACM Sigplan Erlang Workshop
    ACM Sigplan Erlang Workshop
    Portland, Oregon, September 16, 2006
    Portland, Oregon, September 16, 2006
    Francesco Cesarini
    Lukas Larsson
    Michal Slaski

    View Slide

  3. TOWARDS ONLINE
    PROFILING

    View Slide

  4. TOWARDS ONLINE
    PROFILING
    •exploratory work showing possible directions
    •usually followed by a second publication on the topic

    View Slide

  5. TOWARDS ONLINE
    PROFILING
    •rapid analysis of data

    rather than delayed post-processing
    •measurements taken from a live system

    View Slide

  6. TOWARDS ONLINE
    PROFILING
    •recording and analysis of system's characteristics
    •assessing system's capabilities in a certain sphere

    View Slide

  7. WHAT TO PROFILE?
    • time spent on executing particular functions
    • memory allocation volumes
    • garbage collection events
    • number of processes created and terminated
    • mailbox sizes

    View Slide

  8. MESSAGE PASSING PROFILE
    • which processes send or receive more messages

    than other processes
    • which process pairs communicate more often

    than other pairs
    • which processes send messages

    to pids of non-existing processes

    View Slide

  9. FPROF
    • measure time spent executing functions
    • values stored in files for off-line analysis
    • collected data

    can be visualised

    using kcachegrind
    http://blog.equanimity.nl/blog/2013/04/24/fprof-kcachegrind/

    View Slide

  10. XPROF
    • visual tracer tracking execution time of functions
    • helps to decide which functions are of interest
    http://www.erlang-factory.com/euc2017/peter-gomori https://github.com/Appliscale/xprof

    View Slide

  11. ERLYBERLY
    • capture arguments and results of function calls
    https://github.com/andytill/erlyberly
    http://www.erlang-factory.com/euc2016/andy-till

    View Slide

  12. PERCEPT2
    • explores how Erlang application

    perform on multicore CPUs
    Multicore profiling for Erlang programs using percept2

    https://doi.org/10.1145/2505305.2505311

    View Slide

  13. WOMBAT OAM
    • dashboard with metrics, notifications and alarms
    https://www.erlang-solutions.com/blog/getting-started-with-wombatoam.html

    View Slide

  14. ERLANG.PL
    • visualisation of system activity
    Analysis of distributed systems dynamics with Erlang performance lab
    https://journals.agh.edu.pl/csci/article/view/2752

    View Slide

  15. OTHER TOOLS
    gcprof eprof cprof recon
    eflame eflame2 eep redbug
    visualixir erlubi looking_glass

    View Slide

  16. PROBLEM
    • in some cases the tools can fail due to sudden and
    intense increase of load
    • these unexpected states are the situations

    for which the profiling is used in the first place,

    so the failure is problematic

    View Slide

  17. HOW TOOLS WORK?
    • tools collect events occurring during execution
    • collected values are aggregated
    • source of events:
    • erlang:statistics/1
    • erlang:tracer/3

    View Slide

  18. HOW TOOLS WORK?
    • aggregation of trace events

    can become an expensive task itself,

    which can influence the monitored system
    • some tools implement heuristics

    limiting number of aggregated events

    View Slide

  19. AGGREGATING EVENTS
    considered three implementations of the counter
    • ETS counters - ets:update_counter/3
    • NIF counters - C11 _Atomic long
    • R22 counters - counters:add/3

    View Slide

  20. # INCREMENTS / SECOND

    View Slide

  21. COLLECTING EVENTS
    • send events to process or port
    • aggregate with R22 or ETS counters
    • call a NIF module implementing tracer behavior
    • aggregate with NIF counters

    View Slide

  22. SCHEDULER UTILIZATION
    # messages
    tracer process

    ETS counters
    tracer process

    R22 counters
    tracer module

    NIF counters
    no tracer

    no counters
    8M 91.18% 93.52% 14.30% 14.15%
    32M failure failure 99.94% 99.94%

    View Slide

  23. SCHEDULER UTILIZATION

    View Slide

  24. CONCLUSIONS
    • increment counters in the context of processes
    being traced, which is possible with erl_tracer
    • overhead is spread across all available schedulers
    • overhead slows down the system,

    but also makes it possible to observe the system

    View Slide

  25. TOOLS
    gcprof eprof cprof recon
    eflame eflame2 eep redbug
    visualixir erlubi looking_glass
    fprof xprof erlyberly percept
    percept2 wombat erlangpl

    View Slide

  26. QUESTIONS ?
    twitter: @michalslaski

    View Slide