Upgrade to Pro — share decks privately, control downloads, hide ads and more …

ICU 165 support material

ICU 165 support material

preliminary support material for the ICU 165 teleconference (forecast period June - August 2014)

Nicolas Fauchereau

June 03, 2014
Tweet

More Decks by Nicolas Fauchereau

Other Decks in Science

Transcript

  1. Island  Climate  Update  165   Forecast  period:   June  –

     August  2014   Teleconference  Wednesday  4th  of  June  2014   (11:30  AM  NZ  Cme)   4/06/14   1  
  2. 1)  Some  words  on  Rainfall  /  ConvecCon,  circulaCon  and  SST

     anomalies   last  month  (May  2014)   2)  ENSO  (Pacific  Ocean  –  Atmosphere  system):  situaCon  and  forecast     3)  Madden-­‐Julian  OscillaCon  (MJO)  diagnosCcs  and  forecasts     4)  METPI  Rainfall  Forecast     5)  METPI  SST  Forecast     4/06/14   2   Outline    
  3. 4/06/14   6   •  Well  below  =  <  40

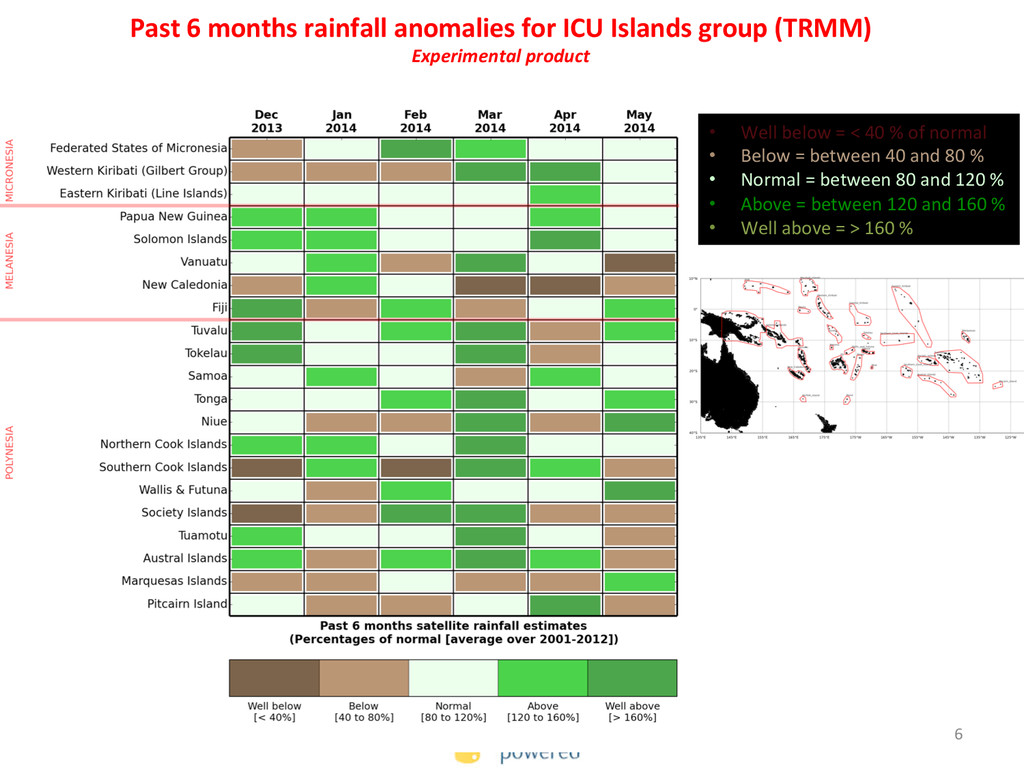
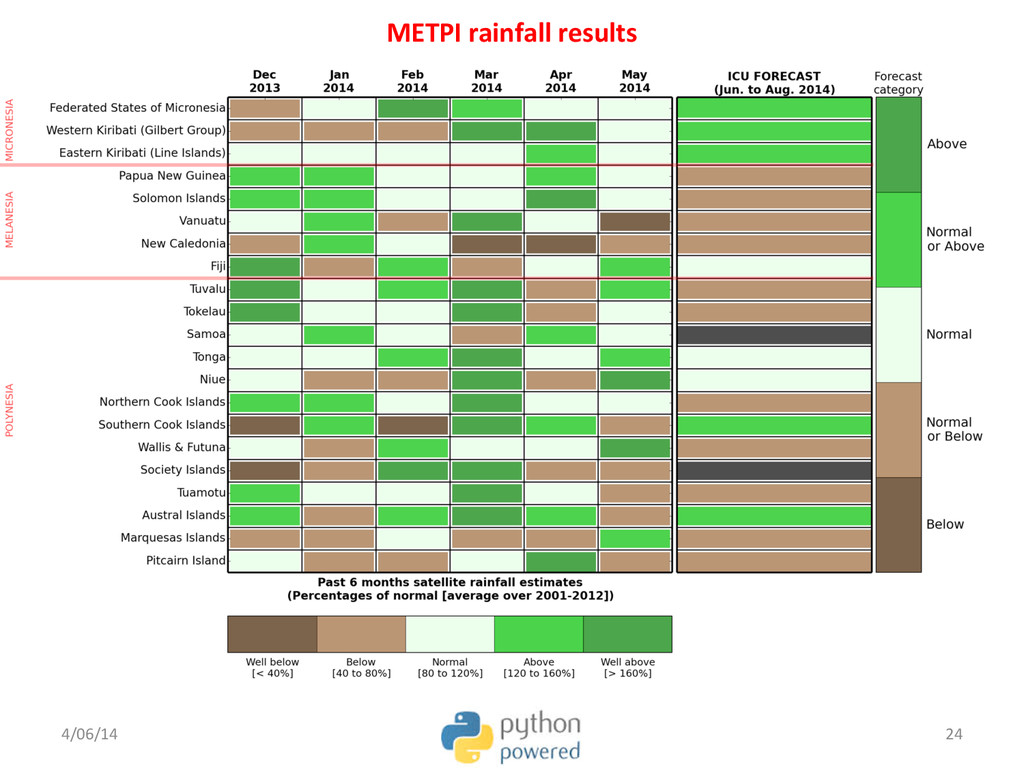
     %  of  normal   •  Below  =  between  40  and  80  %   •  Normal  =  between  80  and  120  %   •  Above  =  between  120  and  160  %   •  Well  above  =  >  160  %   Past  6  months  rainfall  anomalies  for  ICU  Islands  group  (TRMM)   Experimental  product  
  4. SOI  and  SST  NINO  INDICES   4/06/14   Datasource  =

     BoM  (h_p://www.bom.gov.au/ climate/enso/)   11  
  5. The  ENSO  Precipita<on  Index  (ESPI)  for  the  last  30  days

     (3  June)  is  -­‐0.48    (was  1.22  last  month)   SOI  and  ESPI  INDICES   4/06/14   h_p://trmm.gsfc.nasa.gov/trmm_rain/ Events/thirty_day.html   12  
  6. Ocean  sub-­‐surface  temp  anomalies  (TAO)   4/06/14   http://www.pmel.noaa.gov/tao/jsdisplay/ 14

      h_p://www.cpc.ncep.noaa.gov/products/intraseasonal/heat_tlon.shtml  
  7. 4/06/14   23   METPI  rainfall  results   June –

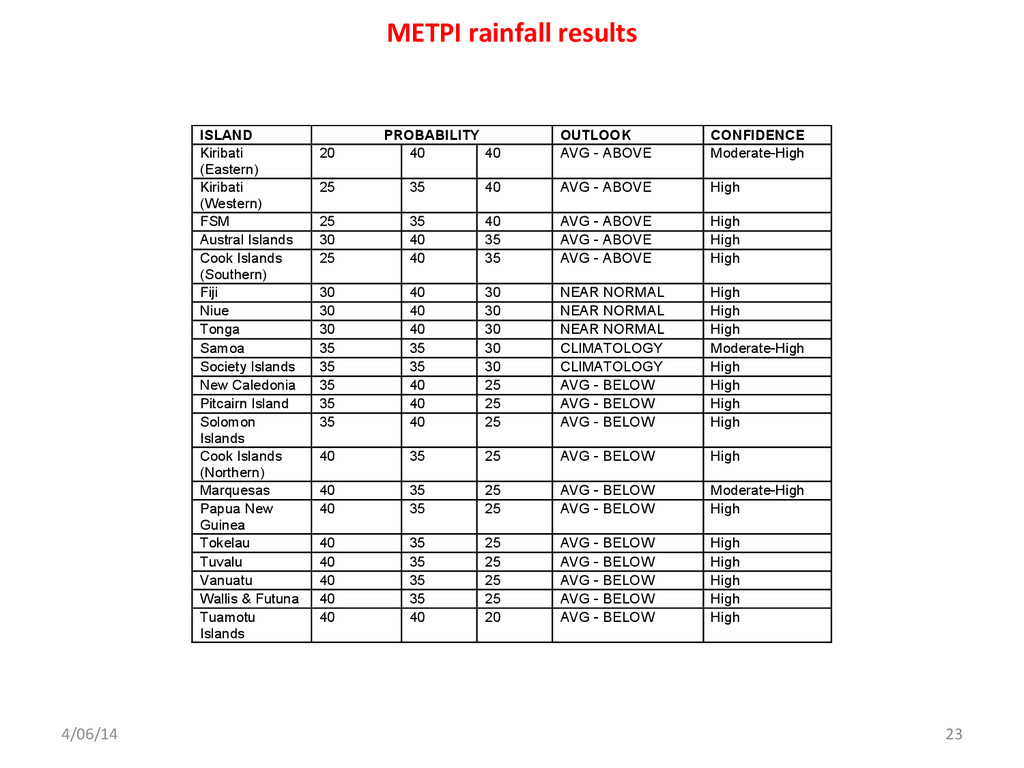
    August 2014 ICU Rainfall Guidance ISLAND PROBABILITY OUTLOOK CONFIDENCE Kiribati (Eastern) 20 40 40 AVG - ABOVE Moderate-High Kiribati (Western) 25 35 40 AVG - ABOVE High FSM 25 35 40 AVG - ABOVE High Austral Islands 30 40 35 AVG - ABOVE High Cook Islands (Southern) 25 40 35 AVG - ABOVE High Fiji 30 40 30 NEAR NORMAL High Niue 30 40 30 NEAR NORMAL High Tonga 30 40 30 NEAR NORMAL High Samoa 35 35 30 CLIMATOLOGY Moderate-High Society Islands 35 35 30 CLIMATOLOGY High New Caledonia 35 40 25 AVG - BELOW High Pitcairn Island 35 40 25 AVG - BELOW High Solomon Islands 35 40 25 AVG - BELOW High Cook Islands (Northern) 40 35 25 AVG - BELOW High Marquesas 40 35 25 AVG - BELOW Moderate-High Papua New Guinea 40 35 25 AVG - BELOW High Tokelau 40 35 25 AVG - BELOW High Tuvalu 40 35 25 AVG - BELOW High Vanuatu 40 35 25 AVG - BELOW High Wallis & Futuna 40 35 25 AVG - BELOW High Tuamotu Islands 40 40 20 AVG - BELOW High Rainfall outcomes estimated from an average of dynamical and statistical models for the Pacific Ocean region. The first three columns indicate the probability for rainfall occurring in one of three terciles (lower-L, middle-M, upper-U). The fourth column is an overall assessment of the expected rainfall relative to normal for the time of year.
  8. 4/06/14   26   SST  anomalies  April  2014   ECWMF

    Seasonal Forecast http://download.ecmwf.org/data/web248/get_legacy_plot-web248-20140602064951-16488-1511.gif http://download.ecmwf.org/data/web248/get_legacy_plot-web248-20140602064951-16488-1511.gif IRICS o.columbia.edu/SOURCES/.IRI/.FD/.SSTA_FCST/.ASST/.version02/S/%280000%201%20May%202014%29VALUE/a:/.sst/L/3/0.0/runningAverage//pointwidth/3/def/L/%282.5%29VALUE/temp_anomaly_colors_gcm/:a:/.T/L/3/0.0/runningAverage//pointwidth/3/def/L/%282.5%29VALUE/:a/X/Y/fig- +colors+|+thinzero+contours+thinnish+grey+land+plotlabel+- fig+//L/2.5/plotvalue//S/609./plotvalue+//framelabel+%28%25=%5BT%5D%20IRI%20seasonal%20Forecast%20SSTA%20issued%20%25=%5BS%5D%29+psdef//plotaxislength+1200+psdef//antialias+true+psdef+.gif LDEO NASA - 1m lead http://www.cpc.ncep.noaa.gov/products/NMME/current/images/NASA_ensemble_tmpsfc_season1.png