adult obesity levels increasing almost universally. • Net-cost of healthcare and welfare for overweight and obese people in the UK is £2.47 billion per annum. • The use of activity tracking devices, as an intervention to decrease sedentary behaviour is well researched. • Many previous studies use relatively small samples.
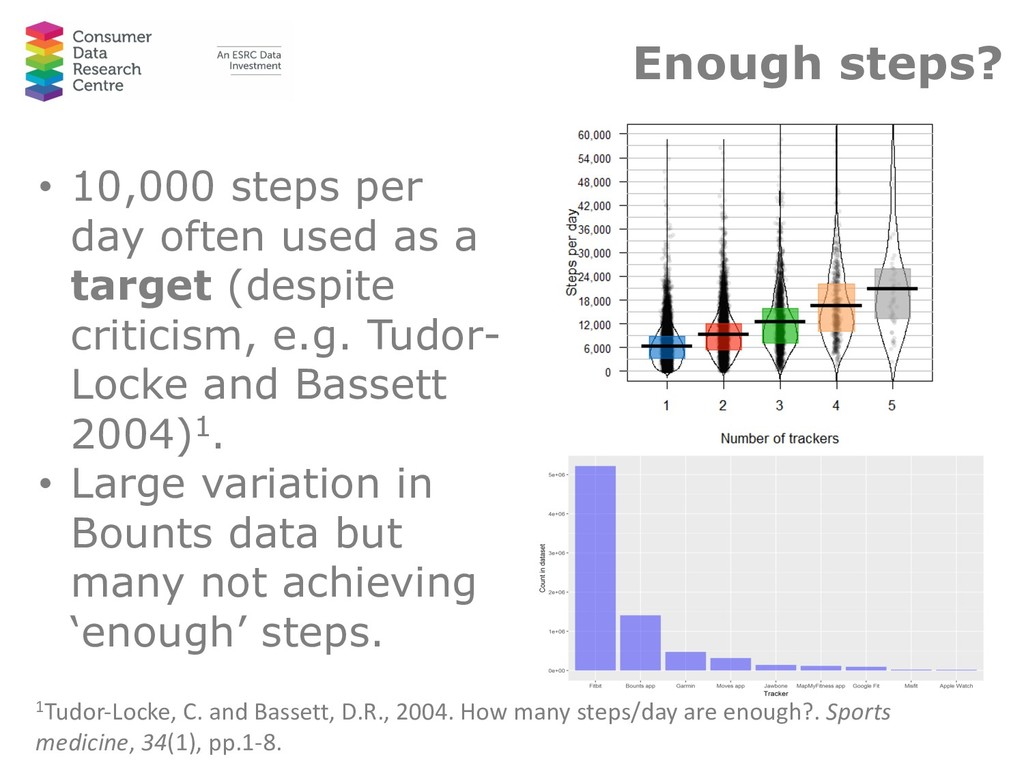
a target (despite criticism, e.g. Tudor- Locke and Bassett 2004)1. • Large variation in Bounts data but many not achieving ‘enough’ steps. 1Tudor-Locke, C. and Bassett, D.R., 2004. How many steps/day are enough?. Sports medicine, 34(1), pp.1-8.
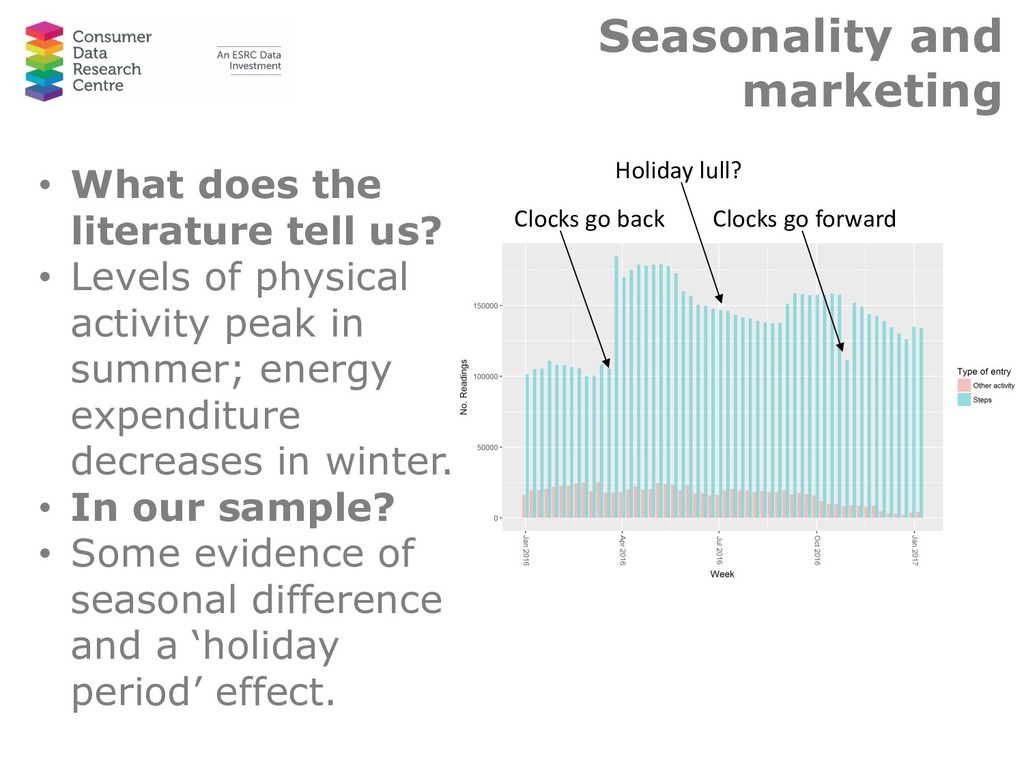
• Levels of physical activity peak in summer; energy expenditure decreases in winter. • In our sample? • Some evidence of seasonal difference and a ‘holiday period’ effect. Clocks go back Clocks go forward Holiday lull?
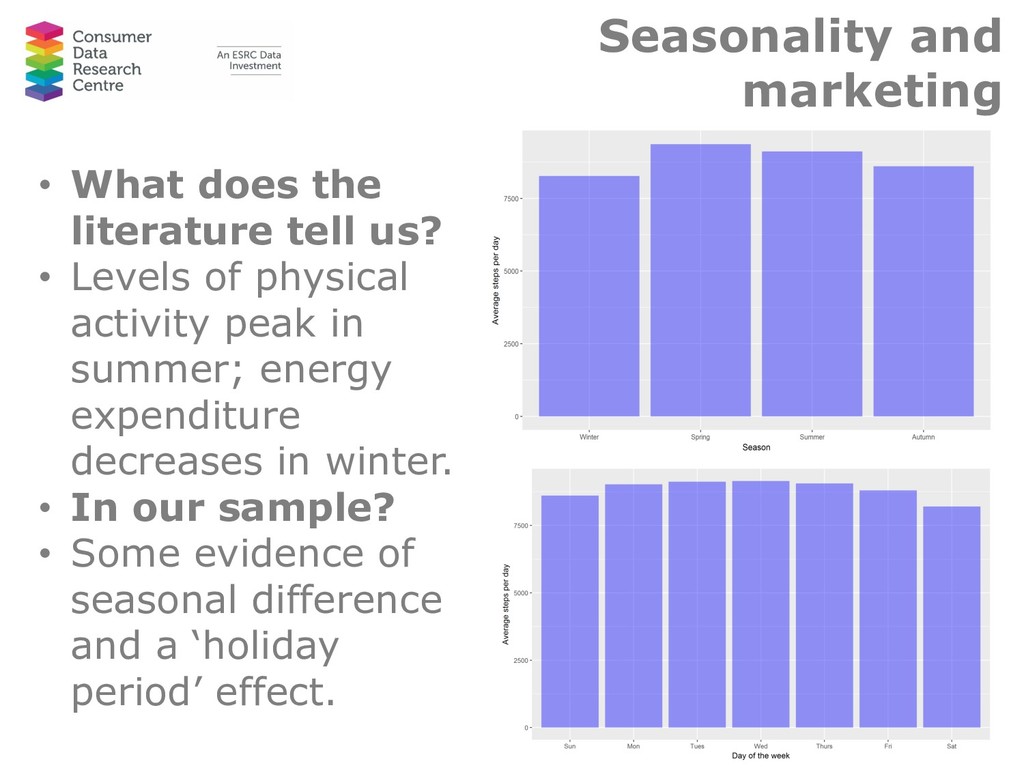
• Levels of physical activity peak in summer; energy expenditure decreases in winter. • In our sample? • Some evidence of seasonal difference and a ‘holiday period’ effect.
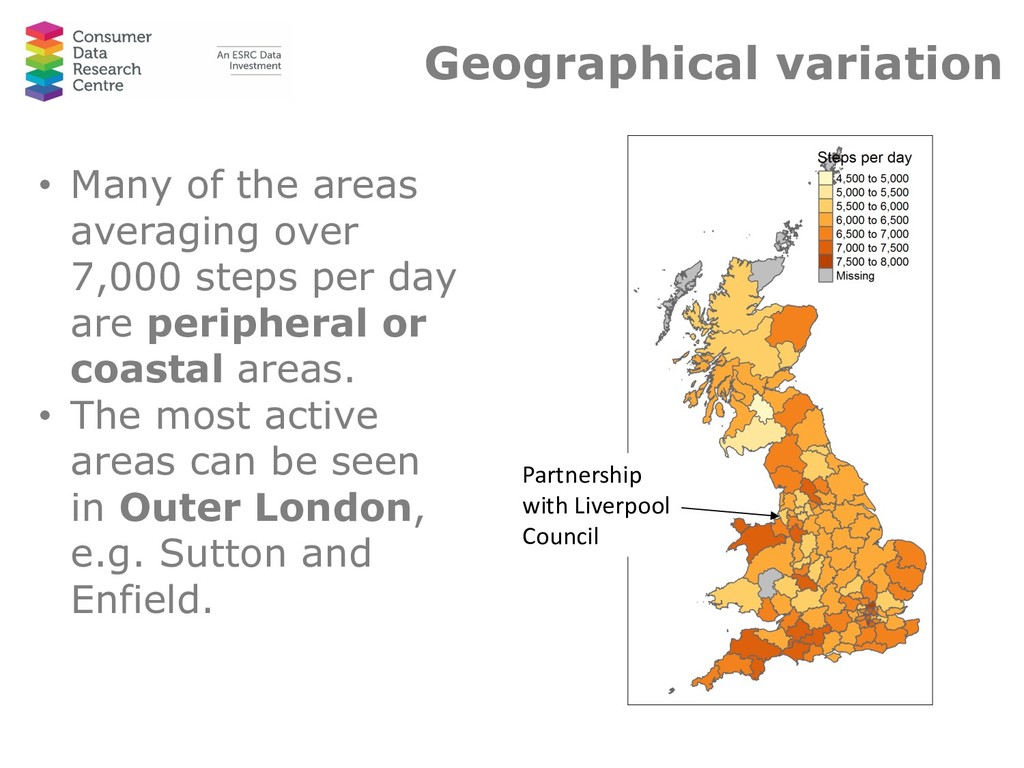
steps per day are peripheral or coastal areas. • The most active areas can be seen in Outer London, e.g. Sutton and Enfield. Partnership with Liverpool Council
these data are different from the general population (i.e. findings reported in previous studies). • Bounts participants are self-selecting and likely motivated to be more active. • Encouraging people to use a rewards scheme/ track their activity levels can help increase activity levels and decrease risk.
clubs, etc.) in relation to user demographics and seasonal activity. • Monitor effect of partnerships and marketing (e.g. links with Liverpool City Council). • Investigation of activity spaces and obesogenic environments using GPS trace data.