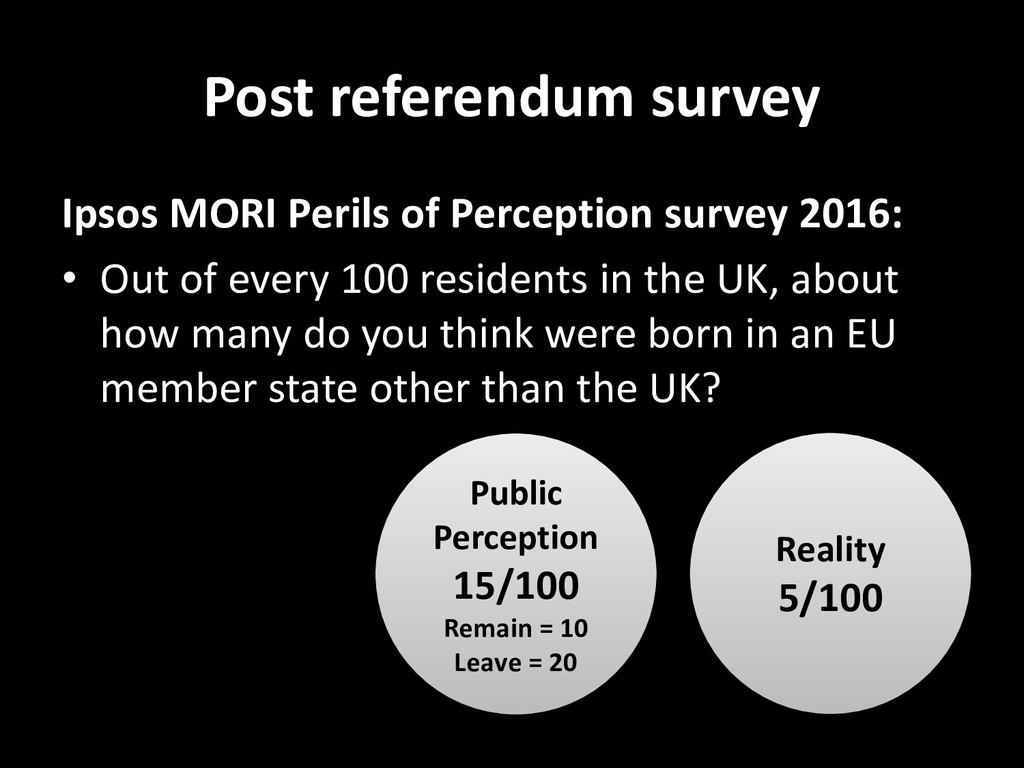
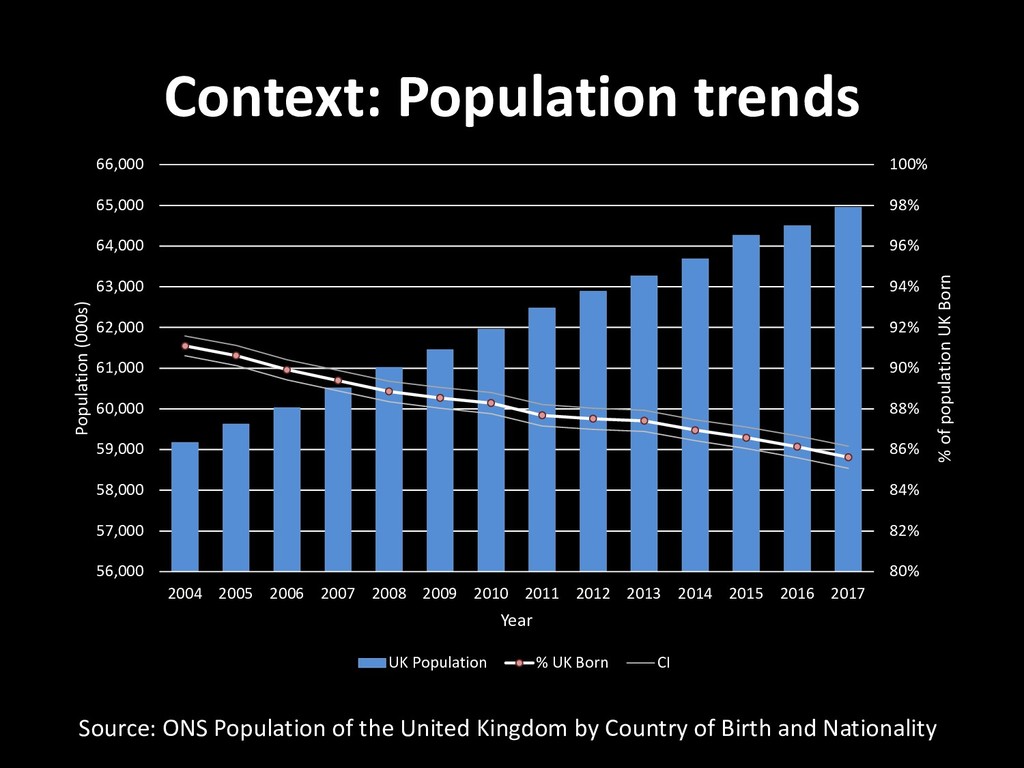
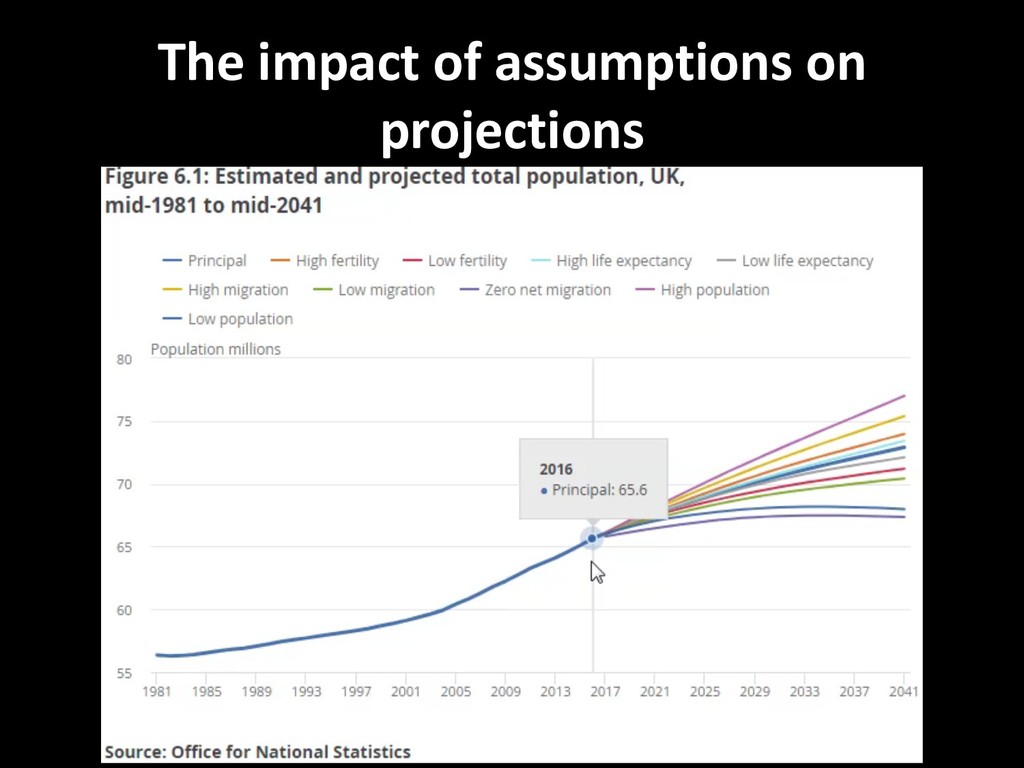
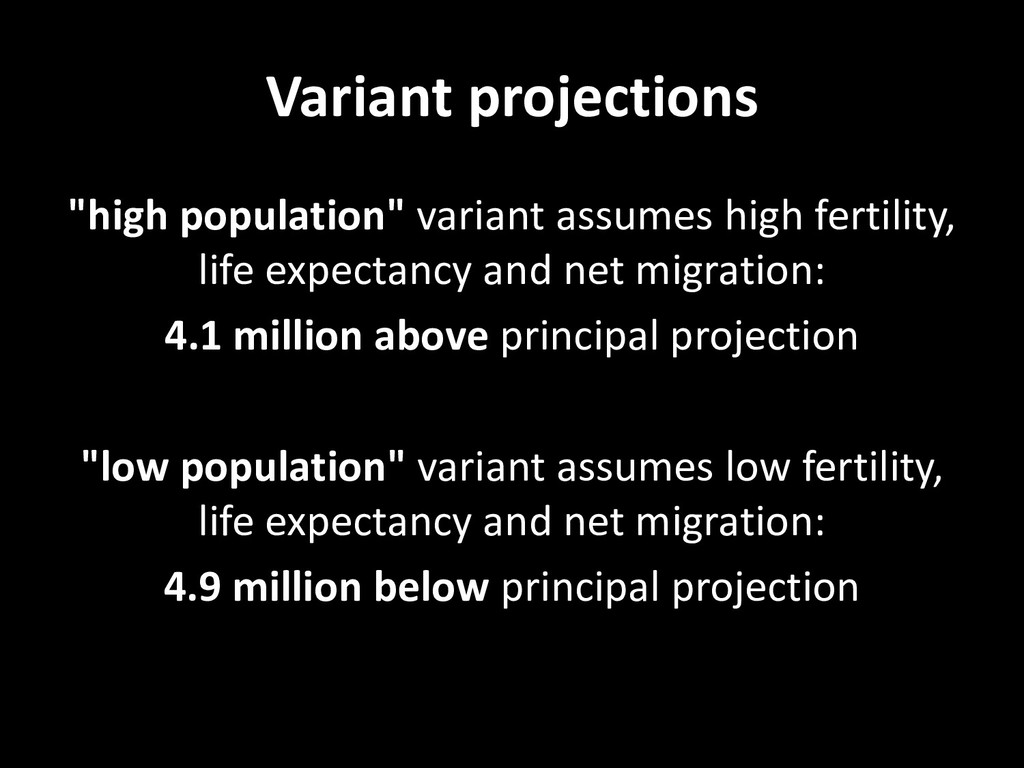
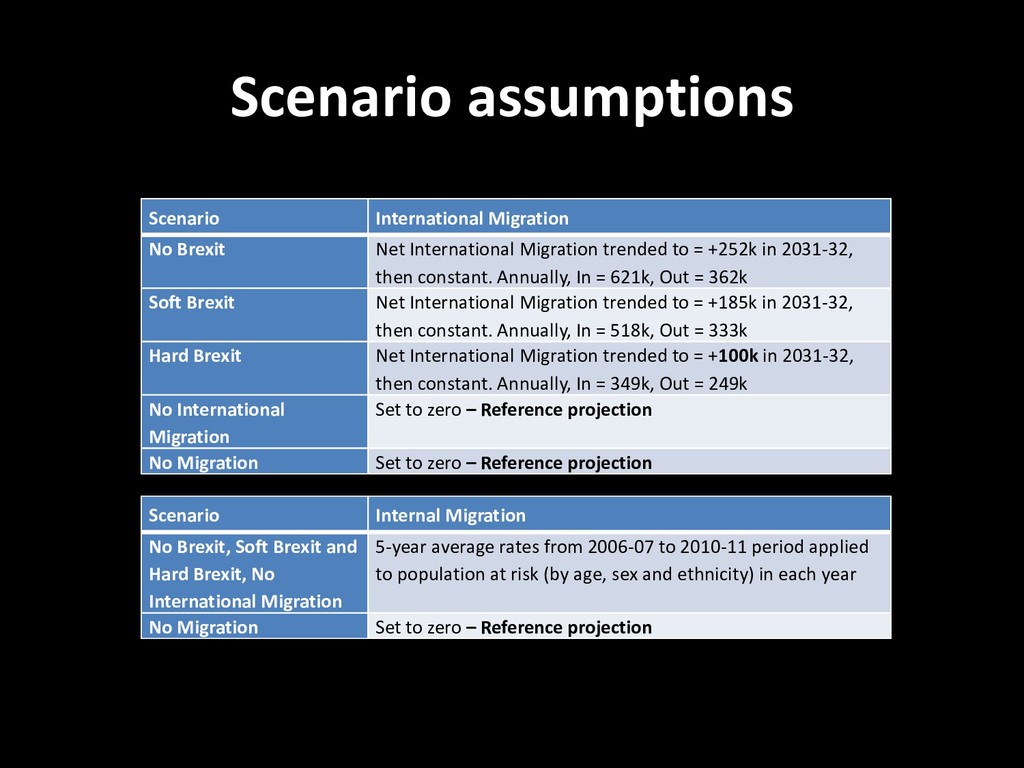
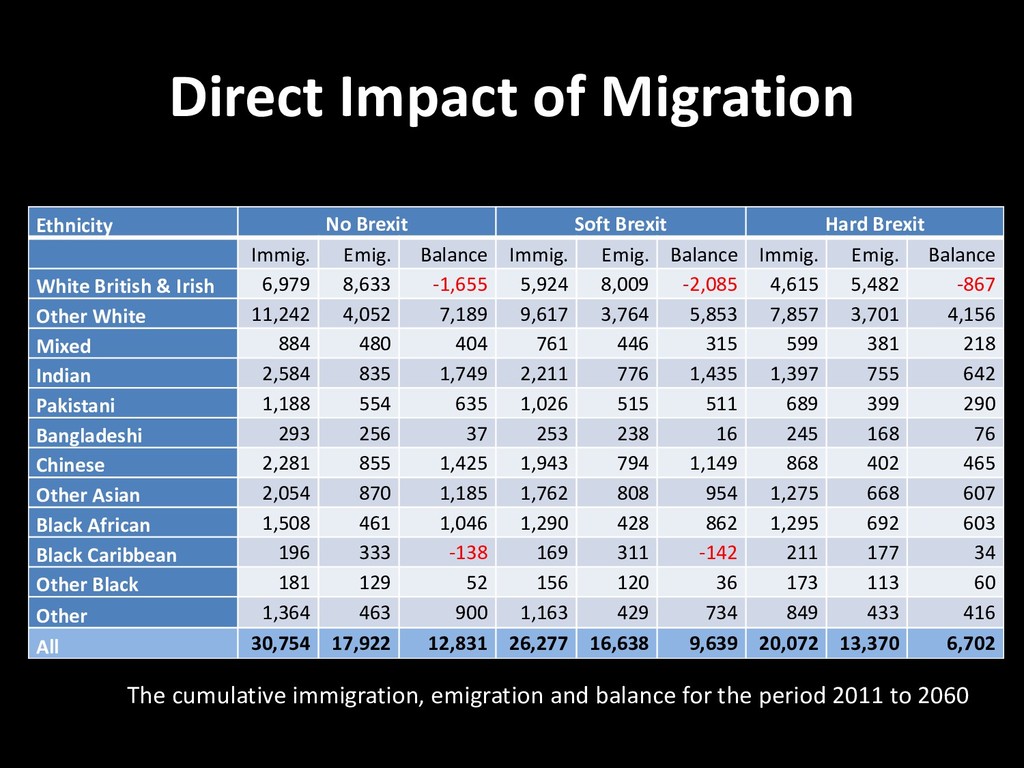
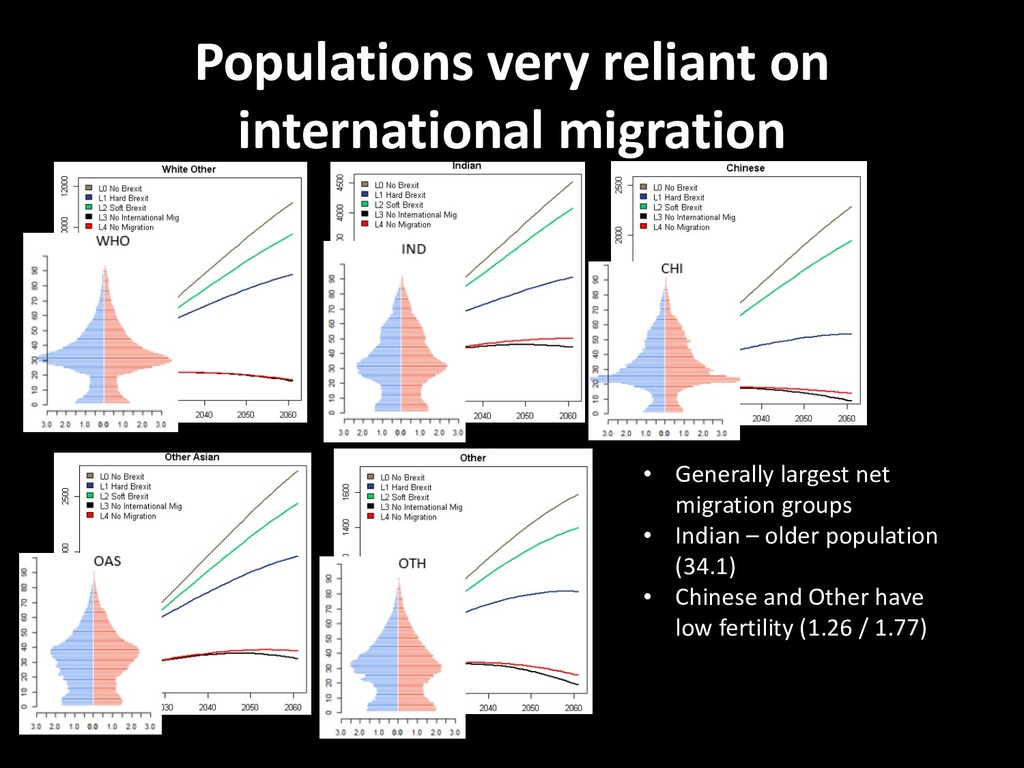
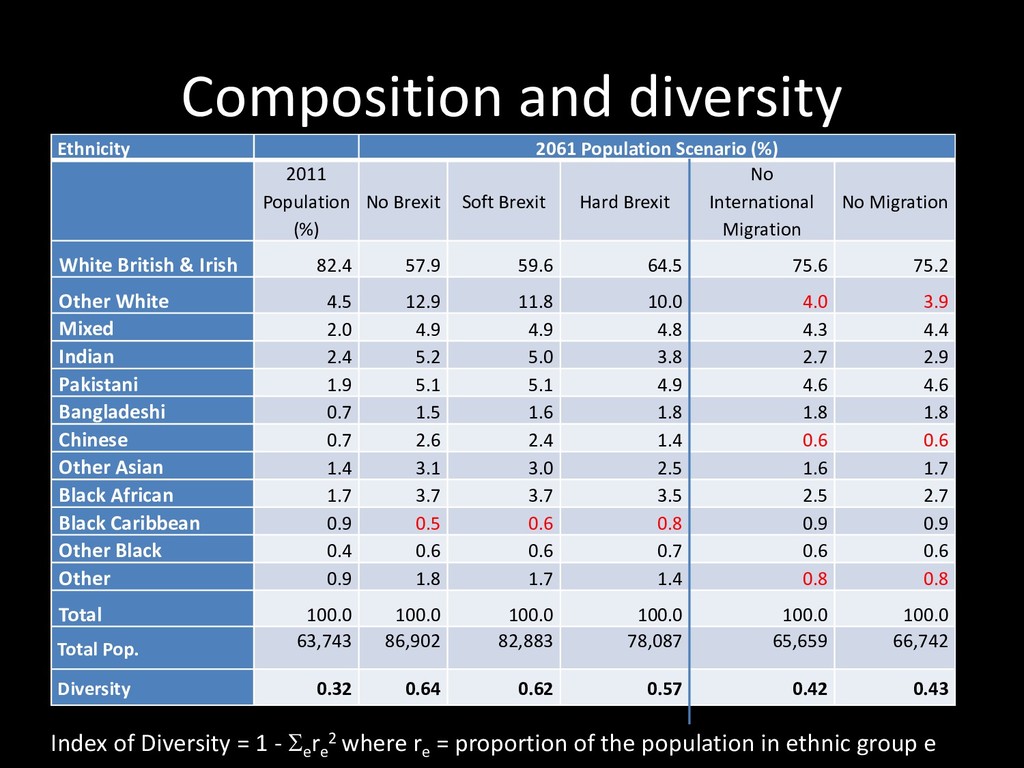
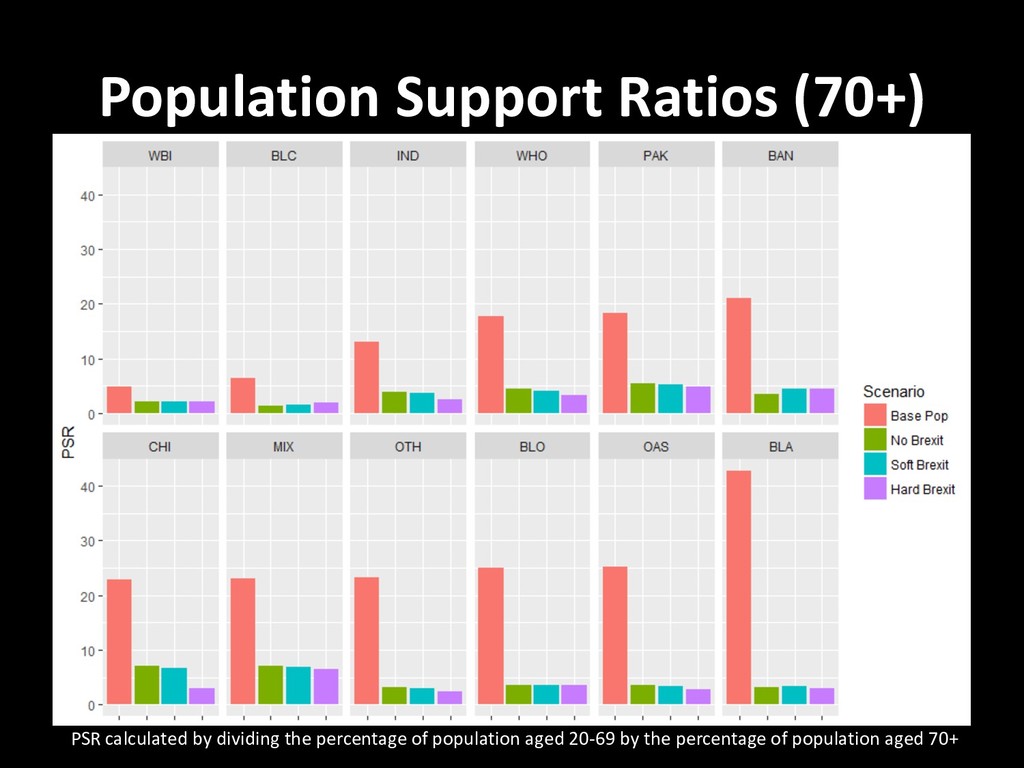
• What percentage of the United Kingdom population do you think are immigrants to this country (i.e. not born in the UK)? Public Perception 31% Reality 13%
• Out of every 100 residents in the UK, about how many do you think were born in an EU member state other than the UK? Public Perception 15/100 Remain = 10 Leave = 20
• Out of every 100 residents in the UK, about how many do you think were born in an EU member state other than the UK? Reality 5/100 Public Perception 15/100 Remain = 10 Leave = 20
United Kingdom by Country of Birth and Nationality 80% 82% 84% 86% 88% 90% 92% 94% 96% 98% 100% 56,000 57,000 58,000 59,000 60,000 61,000 62,000 63,000 64,000 65,000 66,000 2004 2005 2006 2007 2008 2009 2010 2011 2012 2013 2014 2015 2016 2017 % of population UK Born Population (000s) Year UK Population % UK Born CI
and net migration: 4.1 million above principal projection "low population" variant assumes low fertility, life expectancy and net migration: 4.9 million below principal projection
Our overall aim is to understand and to forecast the ethnic composition, size and distribution of the United Kingdom’s population www.ethpop.org The research was supported by ESRC award ES/L013878/1 for the project Evaluation, Revision and Extension of Ethnic Population Projections – NewETHPOP
vary substantially by ethnic group: see Coleman (2006), Coleman (2010) Rees (2012). • Variation in service provision needs, e.g. – health care (Parliamentary office of Science and Technology 2007) – social care (Rees et al. 2009) – education (Penn, 2000) • Very important for monitoring ethnic advantage / disadvantage & segregation.
size, composition and distribution of the UK population by ethnicity? Method: Run a projection model which experiments with migration components Aim: To prepare us for what will be a new and different demographic future Key Question
160 180 200 0to4 5to9 10to14 15to19 20to24 25to29 30to34 35to39 40to44 45to49 50to54 55to59 60to64 65to69 70to74 75+ BAN BLA BLC CHI IND MIX OAS OBL OTH PAK WBI WHO Rate per 1,000 Estimated from 2011 Census tables UKMIG003, MU01AUK_LA_All and MMo1_BUK_All
trended to = +252k in 2031-32, then constant. Annually, In = 621k, Out = 362k Soft Brexit Net International Migration trended to = +185k in 2031-32, then constant. Annually, In = 518k, Out = 333k Hard Brexit Net International Migration trended to = +100k in 2031-32, then constant. Annually, In = 349k, Out = 249k No International Migration Set to zero – Reference projection No Migration Set to zero – Reference projection Scenario Internal Migration No Brexit, Soft Brexit and Hard Brexit, No International Migration 5-year average rates from 2006-07 to 2010-11 period applied to population at risk (by age, sex and ethnicity) in each year No Migration Set to zero – Reference projection
momentum to keep growing Very young populations: Pakistani = 27; Bangladeshi = 25.5; Mixed = 21.8 (youngest) Pakistani and Bangladeshi have very high fertility: TFR=3.2 and 3.47
who continue to age (WBI = 41.4; BLC = 38.7) They have relatively low fertility (WBI = 1.83; BLC = 1.75) They have net out-migration (except BLC under Hard Brexit)
(%) No Brexit Soft Brexit Hard Brexit No International Migration No Migration White British & Irish 82.4 57.9 59.6 64.5 75.6 75.2 Other White 4.5 12.9 11.8 10.0 4.0 3.9 Mixed 2.0 4.9 4.9 4.8 4.3 4.4 Indian 2.4 5.2 5.0 3.8 2.7 2.9 Pakistani 1.9 5.1 5.1 4.9 4.6 4.6 Bangladeshi 0.7 1.5 1.6 1.8 1.8 1.8 Chinese 0.7 2.6 2.4 1.4 0.6 0.6 Other Asian 1.4 3.1 3.0 2.5 1.6 1.7 Black African 1.7 3.7 3.7 3.5 2.5 2.7 Black Caribbean 0.9 0.5 0.6 0.8 0.9 0.9 Other Black 0.4 0.6 0.6 0.7 0.6 0.6 Other 0.9 1.8 1.7 1.4 0.8 0.8 Total 100.0 100.0 100.0 100.0 100.0 100.0 Total Pop. 63,743 86,902 82,883 78,087 65,659 66,742 Diversity 0.32 0.64 0.62 0.57 0.42 0.43 Index of Diversity = 1 - S e re 2 where re = proportion of the population in ethnic group e
downturn in EU immigration, which is built into the Soft and Hard Brexit scenarios. • There was also a steep upturn in emigration, which we had not anticipated. • EU citizens are voting with their feet: they are not coming to work in the UK in as large numbers and are leaving to work elsewhere in larger numbers. *ONS (2017). Migration Statistics Quarterly Report: November 2017.
for demography. Australian Population Studies, 1(1): 73-85 • A simpler ‘static sequential’ projection and a more complex dynamic model • Still retains the ethnic dimension of projection