Upgrade to Pro — share decks privately, control downloads, hide ads and more …

Dimensions of Uncertainty Visualization Research

Dimensions of Uncertainty Visualization Research

Jennifer Mason, Penn State University
David Retchless, Penn State University
Alexander Klippel, Penn State University

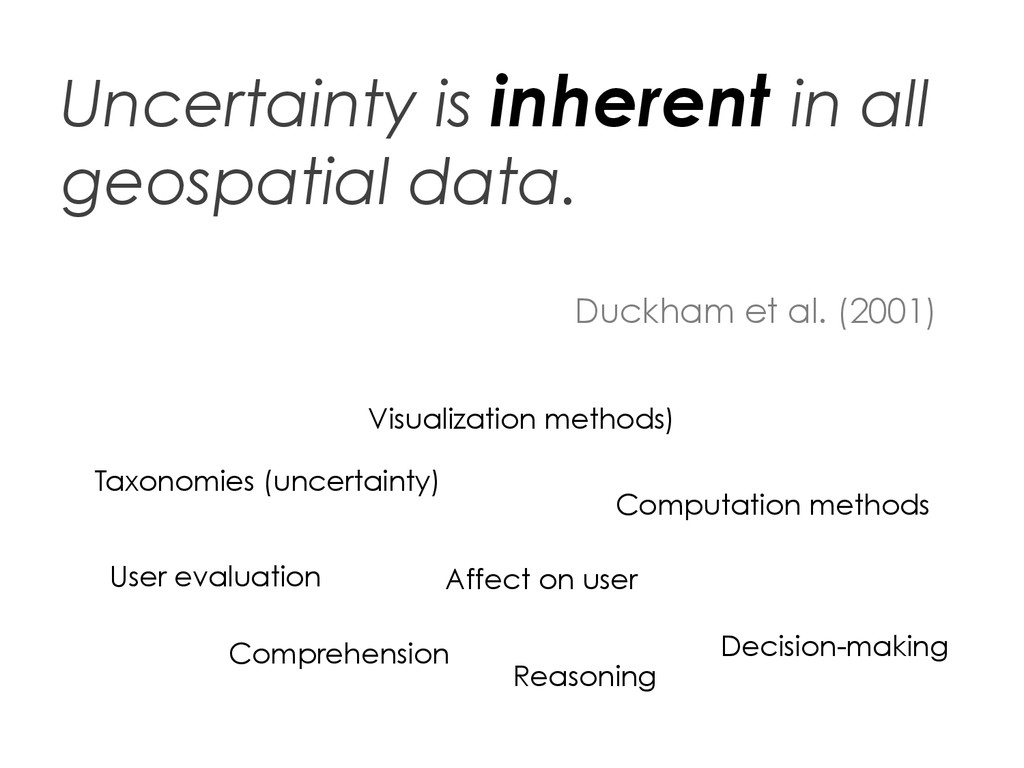
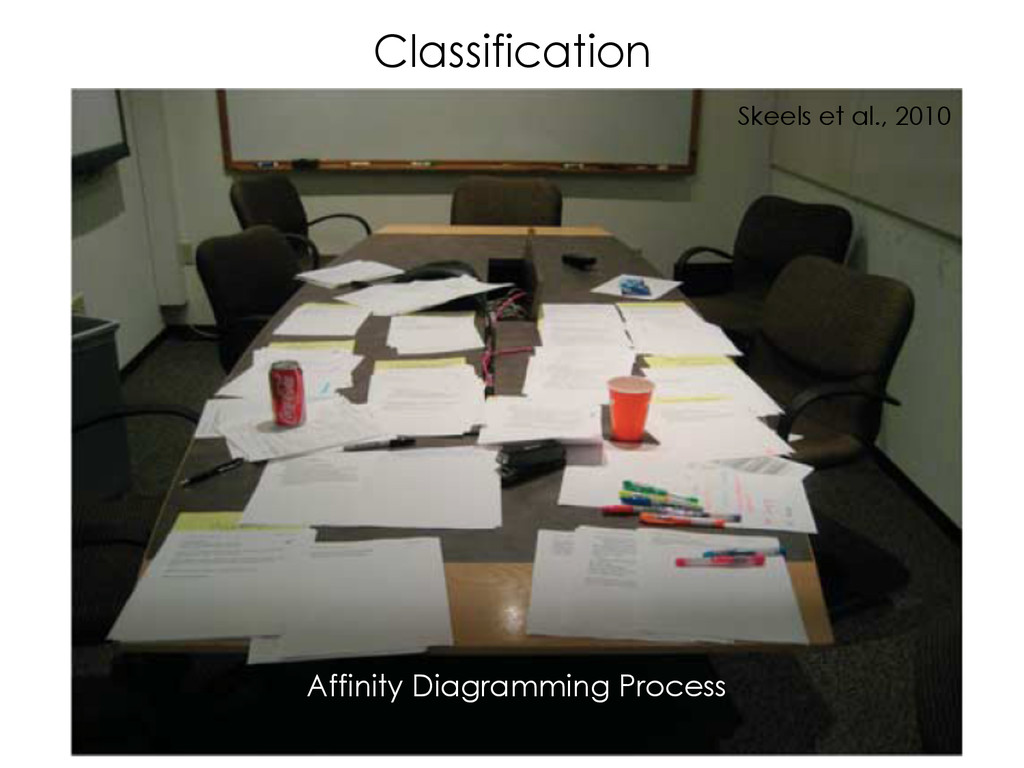
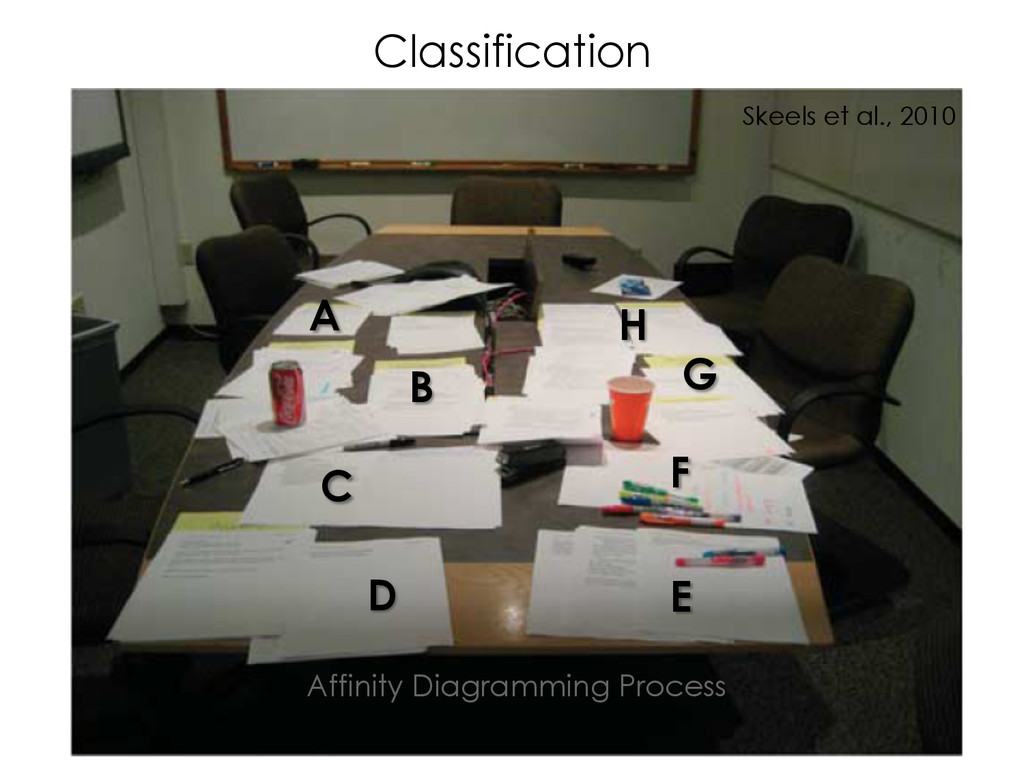
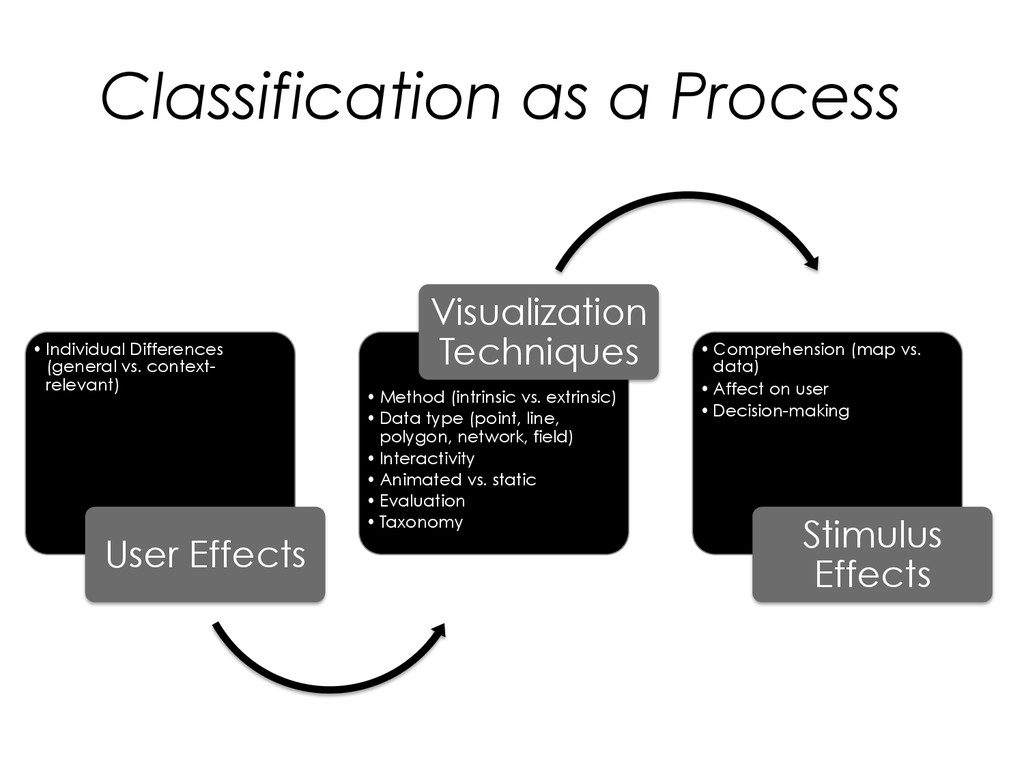
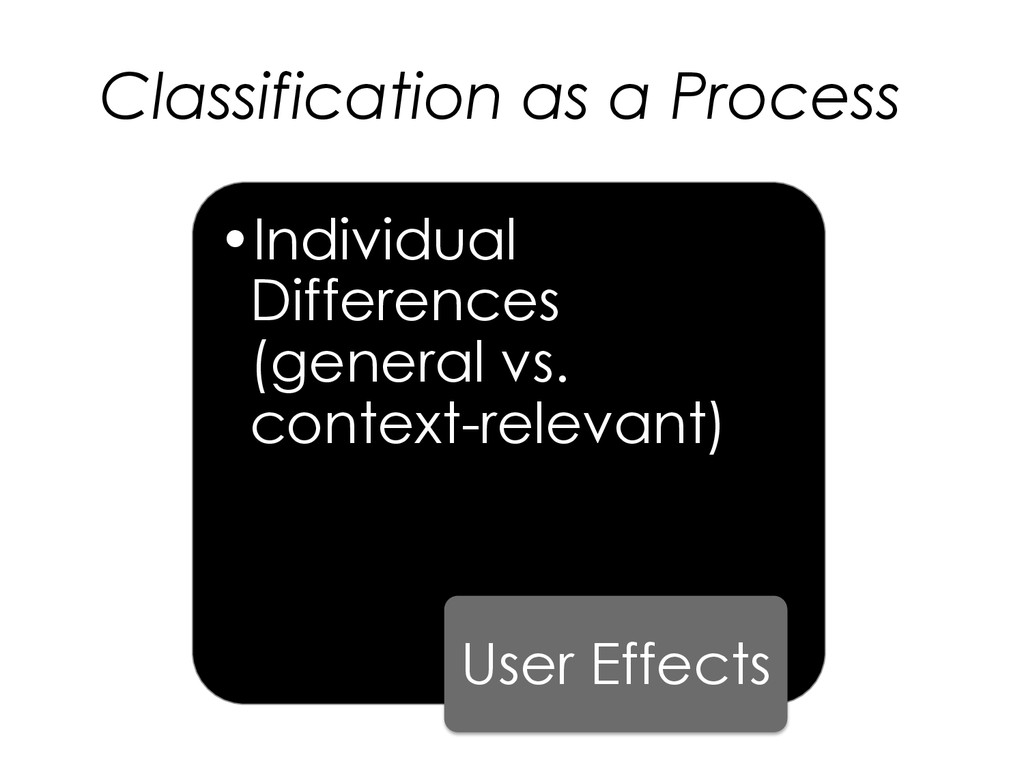
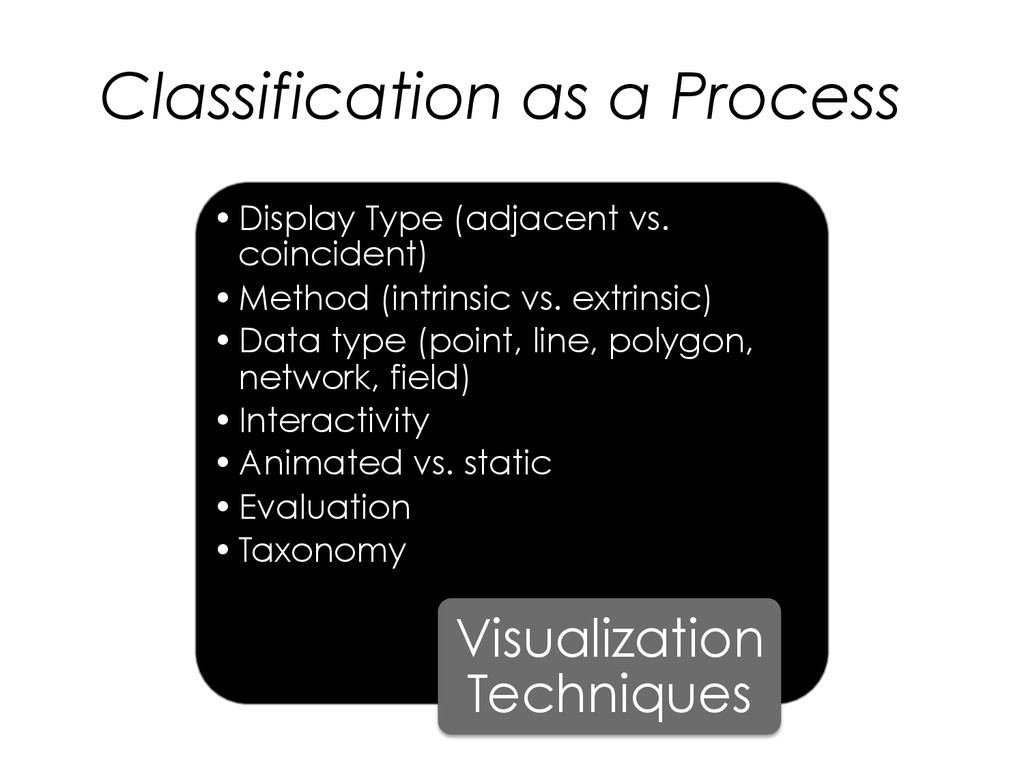
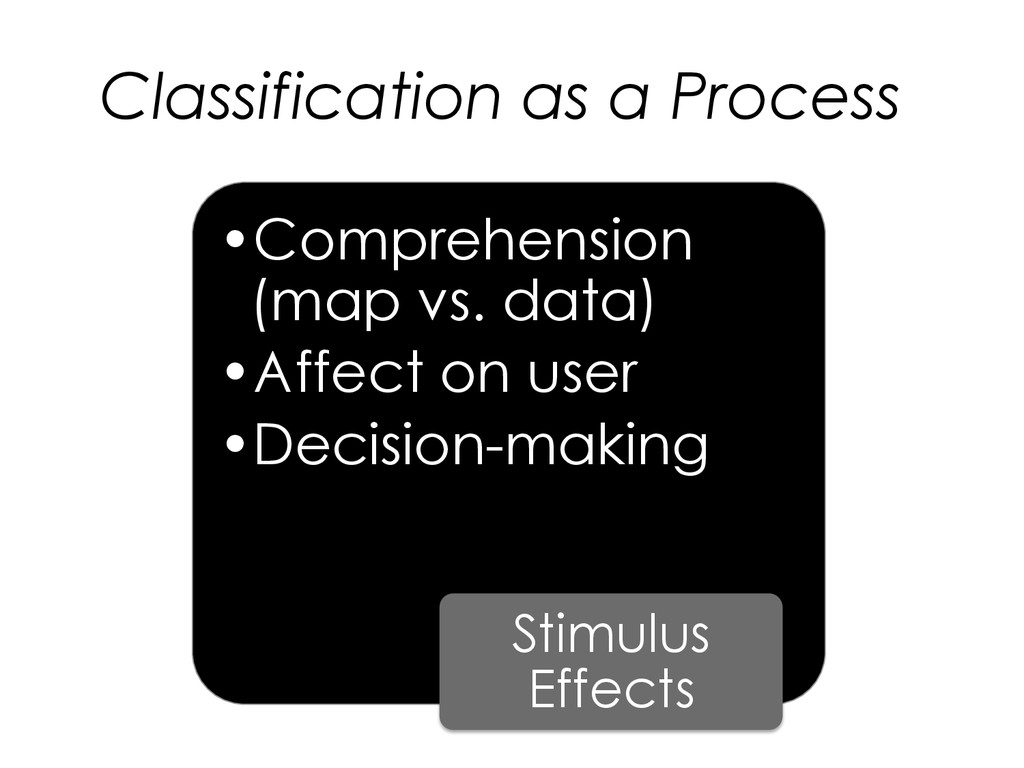
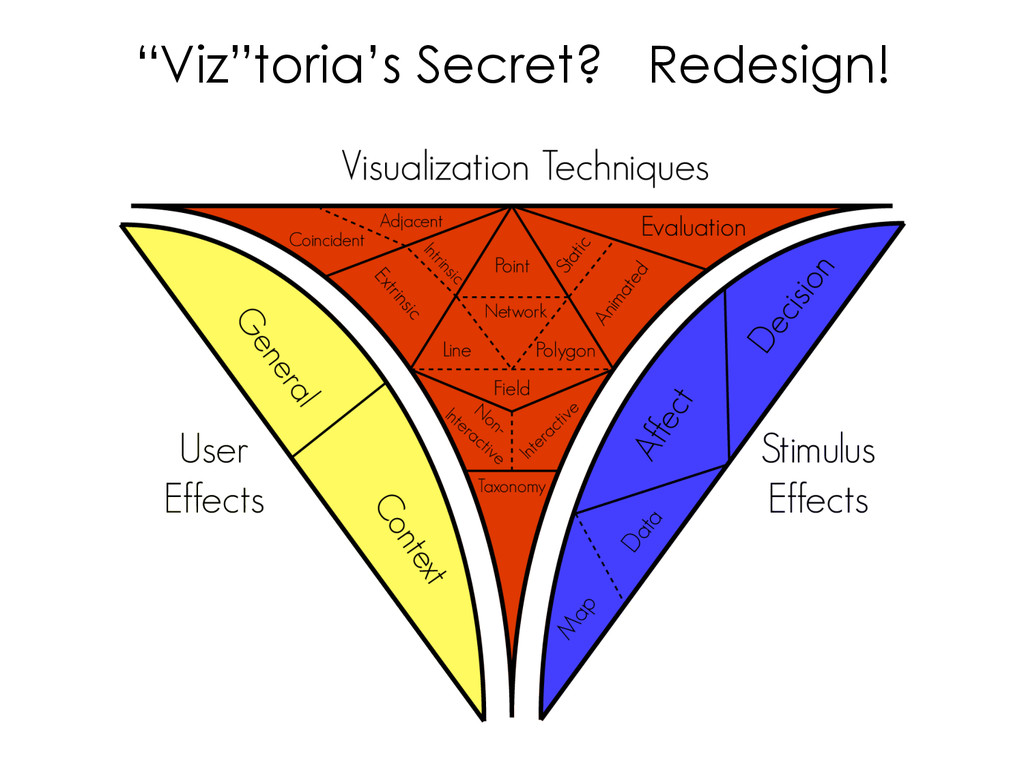
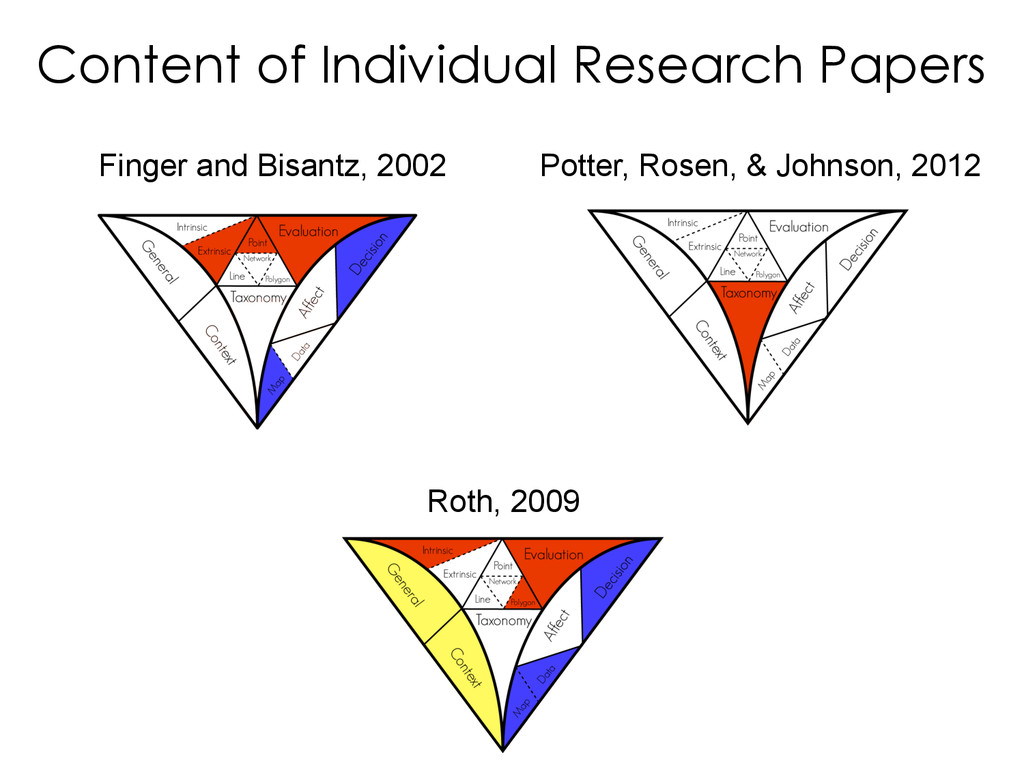
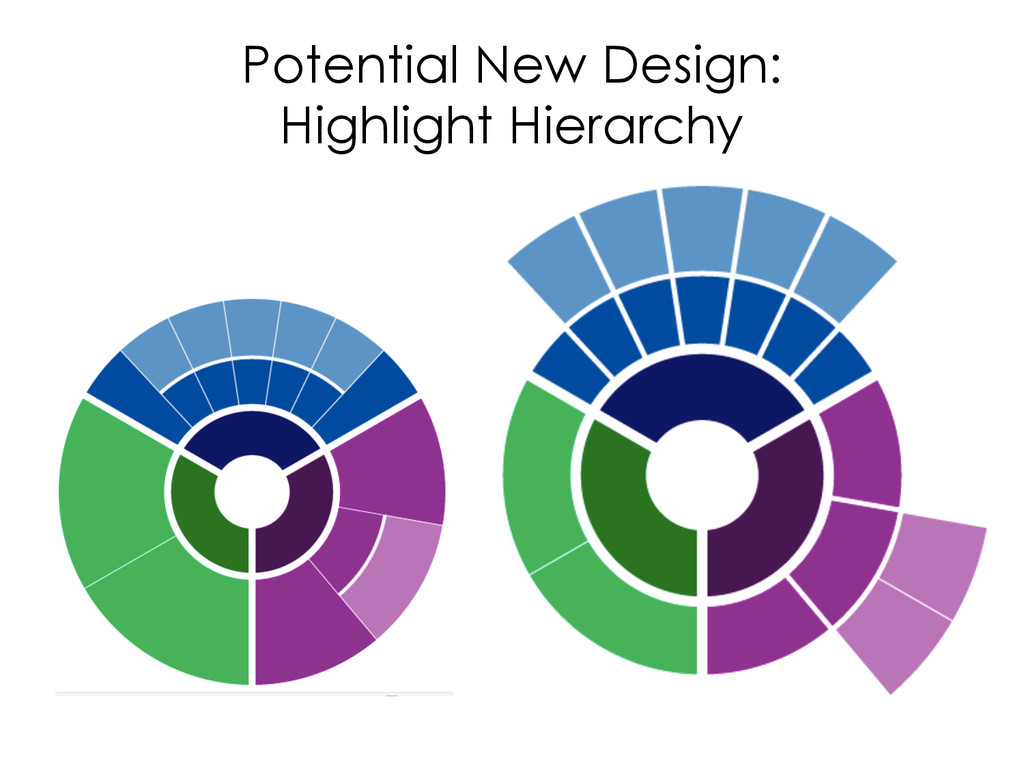
In recent years, uncertainty visualization techniques have taken a larger role in research as users have begun to adopt geospatial uncertainty visualization as an efficient mode of communication. This research surveys the literature on geospatial uncertainty visualization and classifies research in this subfield into different dimensions. These dimensions were borne through a systematic review of uncertainty visualization literature, iteratively identifying major topics and grouping them into similar categories, resulting in a classification of the field. Finally, a graphic was designed reflecting this classification to both organize and conceptualize the entire research field in a new way and to efficiently assist readers in quickly grasping the topics within an uncertainty visualization research paper at a glance. This research will help people develop a more thorough understanding of uncertainty visualization research while finding gaps that researchers should attend to in the future.

NACIS 2014

Nathaniel V. KELSO

October 10, 2014
Tweet

More Decks by Nathaniel V. KELSO

Other Decks in Design

Transcript

  1. JENNIFER S. MASON, DAVID RETCHLESS & ALEXANDER KLIPPEL Dimensions of

    Uncertainty Visualization Research ------------------------------------------------------------ PENNSYLVANIA STATE UNIVERSITY NACIS, OCTOBER 10 2014
  2. Uncertainty is inherent in all geospatial data. Duckham et al.

    (2001) Comprehension Computation methods Reasoning User evaluation Affect on user Decision-making Taxonomies (uncertainty) Visualization methods)
  3. Identify Major Topics Topics Organize Creative Commons – Attribution (CC

    BY 3.0) Arrows designed by Juan Pablo Bravo from the Noun Project Unstructured List
  4. Classification as a Process • Individual Differences (general vs. context- relevant)

    User Effects • Method (intrinsic vs. extrinsic) • Data type (point, line, polygon, network, field) • Interactivity • Animated vs. static • Evaluation • Taxonomy Visualization Techniques • Comprehension (map vs. data) • Affect on user • Decision-making Stimulus Effects
  5. Classification as a Process • Display Type (adjacent vs. coincident) • Method

    (intrinsic vs. extrinsic) • Data type (point, line, polygon, network, field) • Interactivity • Animated vs. static • Evaluation • Taxonomy Visualization Techniques
  6. Finger and Bisantz, 2002 Potter, Rosen, & Johnson, 2012 Roth,

    2009 Content of Individual Research Papers
  7. •  Lack of spatial network approaches •  Less on user

    effects •  More on map comprehension Future •  Reorder and analyze for trends over time •  Build website to automate image output Outlook
  8. THANK YOU!! Penn State Big Data in Social Science IGERT

    This work was supported by the National Science Foundation under IGERT Award #DGE-1144860, Big Data Social Science, and Pennsylvania State University