golang • Motivation – There are few documents about the troubleshooting features (e.g. debugger) for golang – The available documents are scattered on the many web pages – I consider it's nice to gather these information in the one place • Software version • Golang: 1.5.1 • OS: fedora22/x86_64
• GOTRACEBACK=crash # Capture core dump when user program aborts • Tips: Prevent variables from disappearing by optimization – Append `-gcflags “-N -l“` option to “go build” • How to capture – Terminate program abnormally, for example by segmentation fault – Send SIGABRT
extended gdb commands for golang • (gdb) source $GOROOT/src/runtime/runtime-gdb.py • Note: On golang 1.4.2, this script failed to load and doesn't work • Analyze program with the extended command written in the following URL • https://golang.org/doc/gdb – Note: Currently it can only analyze running process • Analyzing core dump doesn't work – Process is stopped at unsure point – “bt” doesn't work properly – “goroutine” fails with error
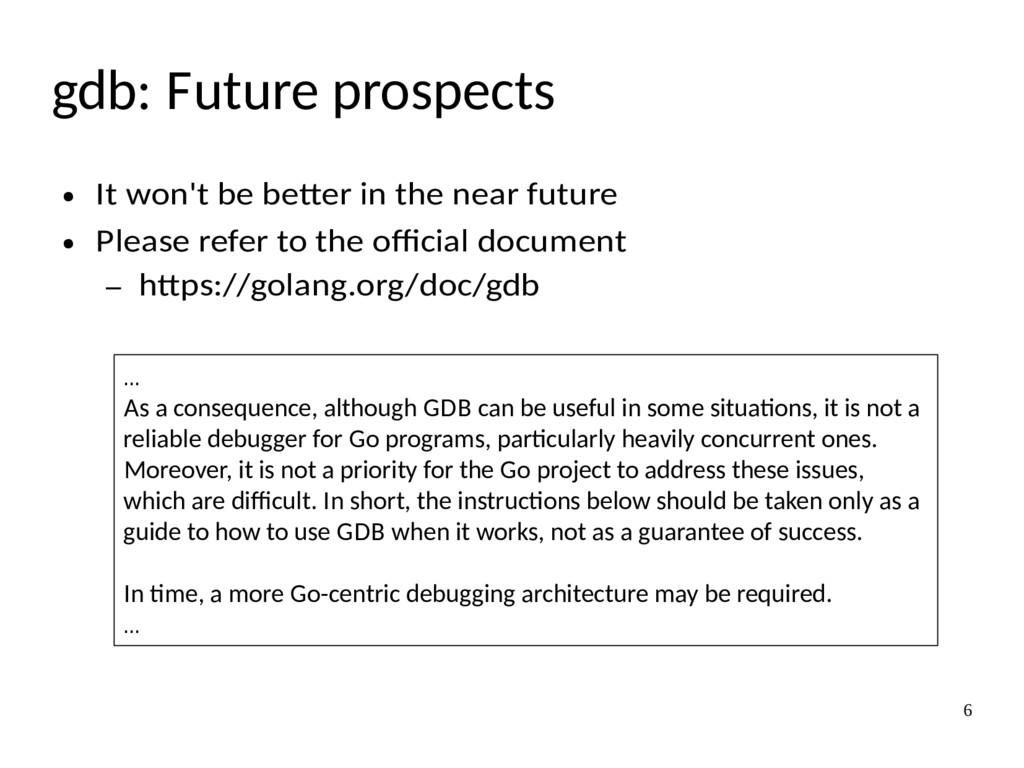
the near future • Please refer to the official document – https://golang.org/doc/gdb … As a consequence, although GDB can be useful in some situations, it is not a reliable debugger for Go programs, particularly heavily concurrent ones. Moreover, it is not a priority for the Go project to address these issues, which are difficult. In short, the instructions below should be taken only as a guide to how to use GDB when it works, not as a guarantee of success. In time, a more Go-centric debugging architecture may be required. …
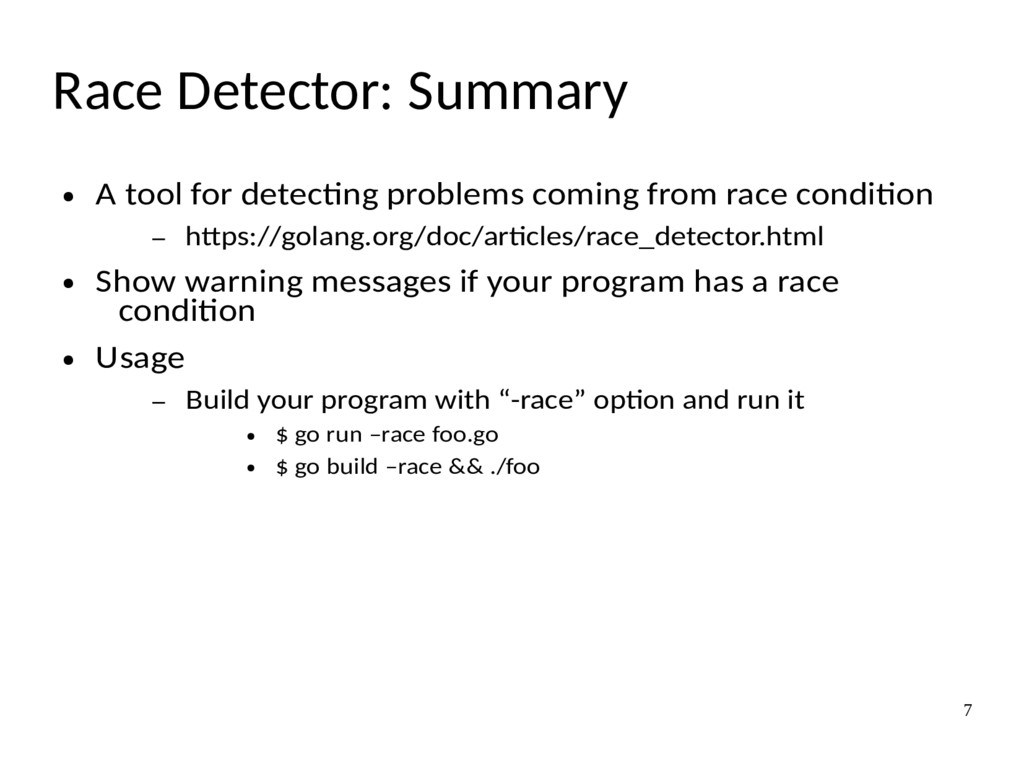
coming from race condition – https://golang.org/doc/articles/race_detector.html • Show warning messages if your program has a race condition • Usage – Build your program with “-race” option and run it • $ go run –race foo.go • $ go build –race && ./foo
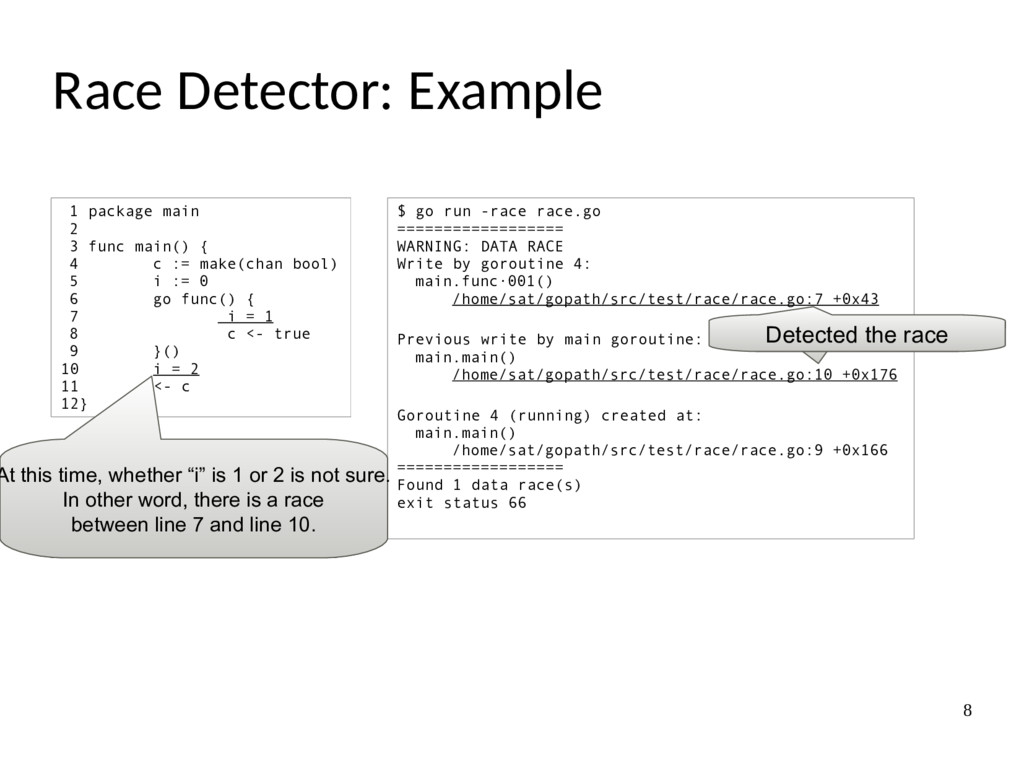
WARNING: DATA RACE Write by goroutine 4: main.func·001() /home/sat/gopath/src/test/race/race.go:7 +0x43 Previous write by main goroutine: main.main() /home/sat/gopath/src/test/race/race.go:10 +0x176 Goroutine 4 (running) created at: main.main() /home/sat/gopath/src/test/race/race.go:9 +0x166 ================== Found 1 data race(s) exit status 66 1 package main 2 3 func main() { 4 c := make(chan bool) 5 i := 0 6 go func() { 7 i = 1 8 c <- true 9 }() 10 i = 2 11 <- c 12} At this time, whether “i” is 1 or 2 is not sure. In other word, there is a race between line 7 and line 10. Detected the race
• Usage is written in “README.md” at the above mentioned URL – Although there is only “go get” in “Installation” section, the following commands should be run to use “godebug” program 1. go get github.com/mailgun/godebug 2. cd $GOPATH/src/github.com/mailgun/godebug 3. go install # Install godebug under $GOPATH/bin • Currently there few (less than gdb) features • It would be better since this project is brand new and under development
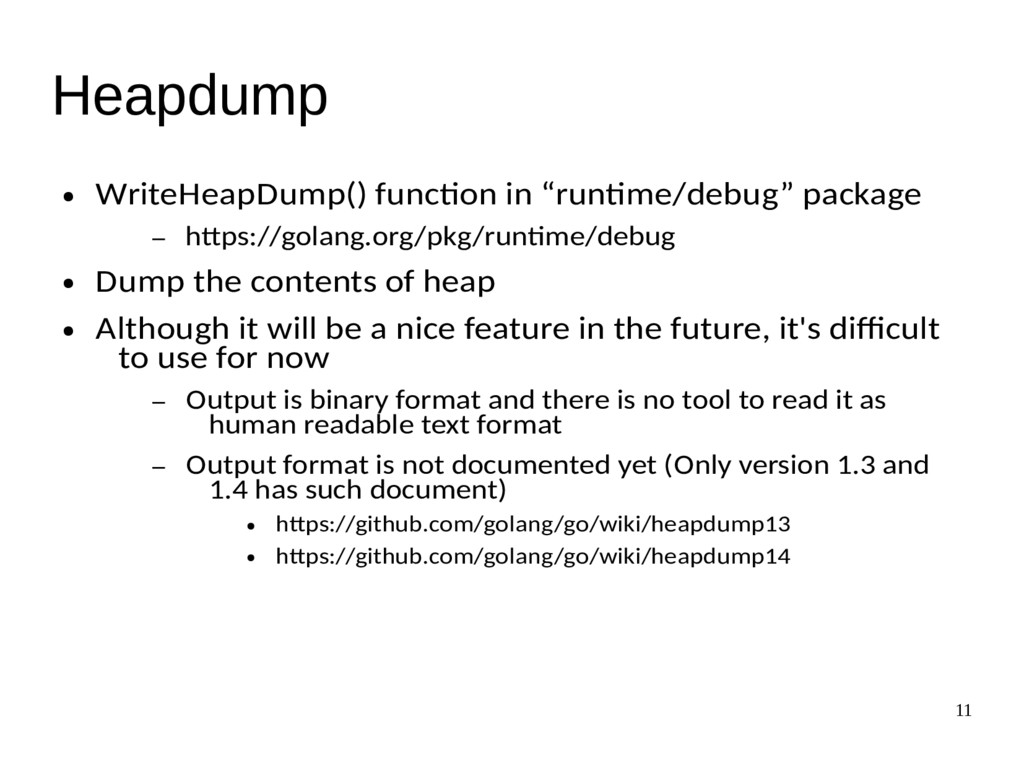
• Dump the contents of heap • Although it will be a nice feature in the future, it's difficult to use for now – Output is binary format and there is no tool to read it as human readable text format – Output format is not documented yet (Only version 1.3 and 1.4 has such document) • https://github.com/golang/go/wiki/heapdump13 • https://github.com/golang/go/wiki/heapdump14
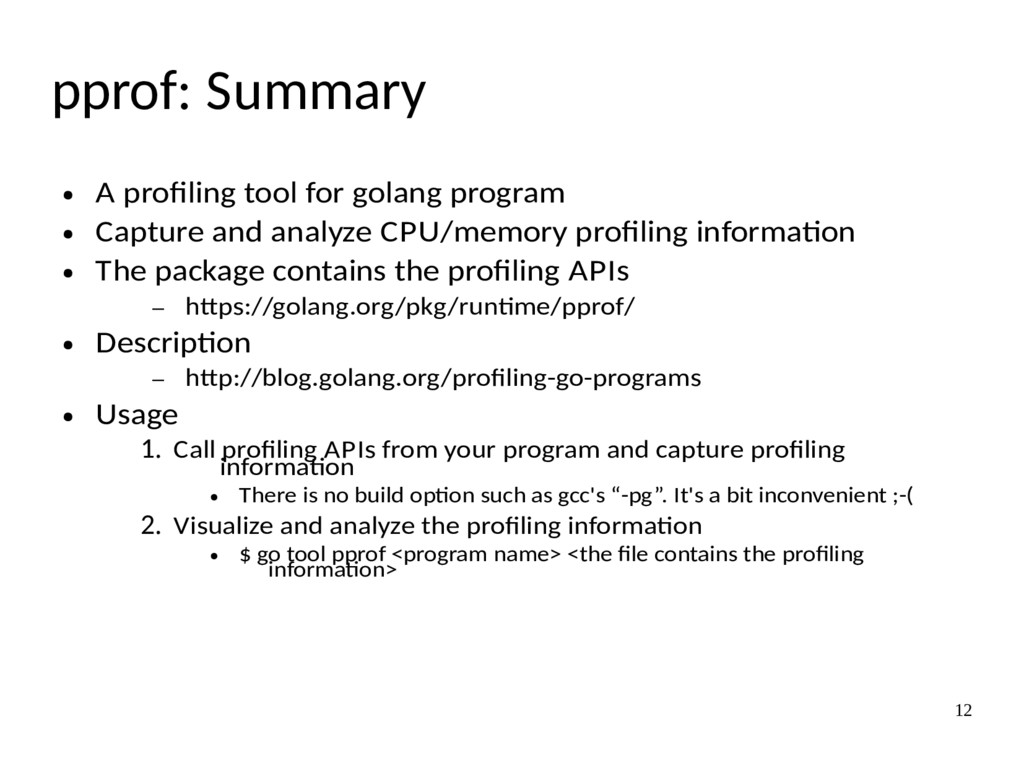
• Capture and analyze CPU/memory profiling information • The package contains the profiling APIs – https://golang.org/pkg/runtime/pprof/ • Description – http://blog.golang.org/profiling-go-programs • Usage 1. Call profiling APIs from your program and capture profiling information • There is no build option such as gcc's “-pg”. It's a bit inconvenient ;-( 2. Visualize and analyze the profiling information • $ go tool pprof <program name> <the file contains the profiling information>
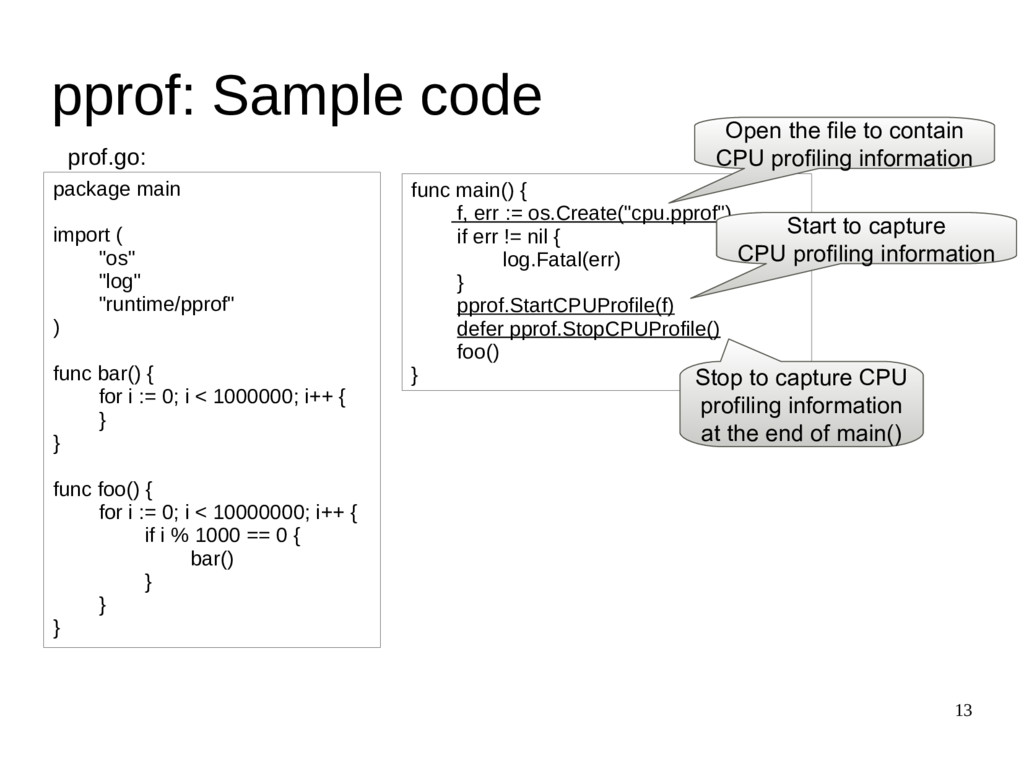
"runtime/pprof" ) func bar() { for i := 0; i < 1000000; i++ { } } func foo() { for i := 0; i < 10000000; i++ { if i % 1000 == 0 { bar() } } } func main() { f, err := os.Create("cpu.pprof") if err != nil { log.Fatal(err) } pprof.StartCPUProfile(f) defer pprof.StopCPUProfile() foo() } Start to capture CPU profiling information Stop to capture CPU profiling information at the end of main() prof.go: Open the file to contain CPU profiling information
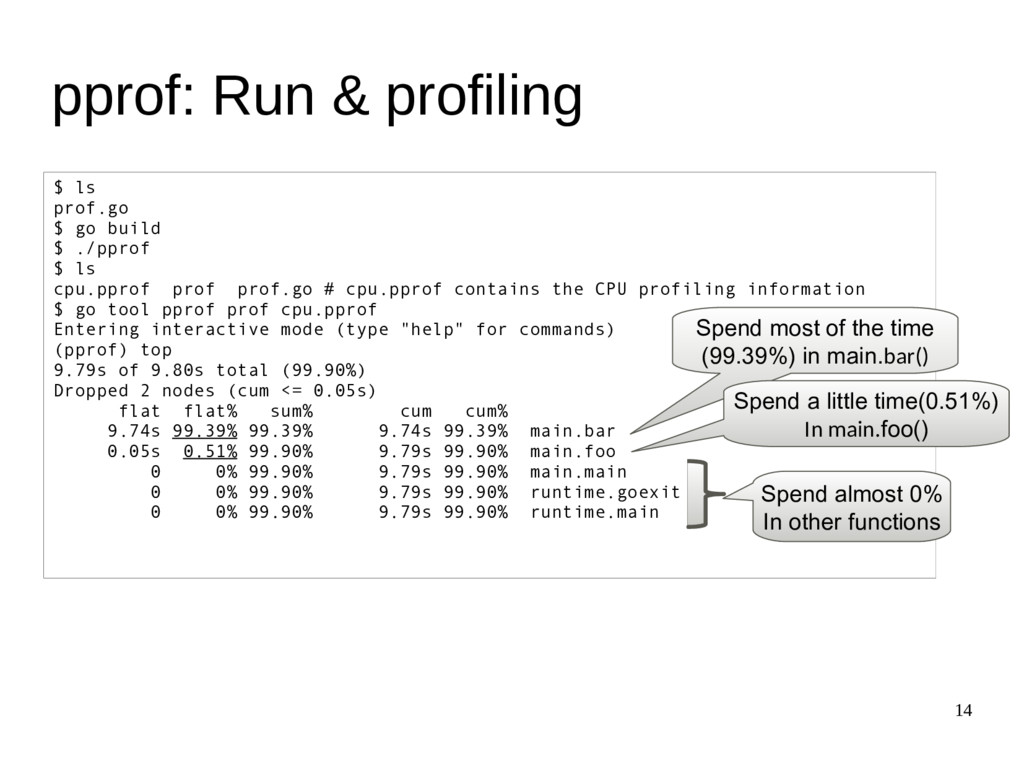
build $ ./pprof $ ls cpu.pprof prof prof.go # cpu.pprof contains the CPU profiling information $ go tool pprof prof cpu.pprof Entering interactive mode (type "help" for commands) (pprof) top 9.79s of 9.80s total (99.90%) Dropped 2 nodes (cum <= 0.05s) flat flat% sum% cum cum% 9.74s 99.39% 99.39% 9.74s 99.39% main.bar 0.05s 0.51% 99.90% 9.79s 99.90% main.foo 0 0% 99.90% 9.79s 99.90% main.main 0 0% 99.90% 9.79s 99.90% runtime.goexit 0 0% 99.90% 9.79s 99.90% runtime.main Spend most of the time (99.39%) in main.bar() Spend a little time(0.51%) In main.foo() Spend almost 0% In other functions
golang • However, there is no way to analyze core dump – I consider it's one of the biggest weak point of golang – How to find root cause if your program crashes in a important system? Stack trace is insufficient in many case