lin´ earit´ e de l’amplificateur de puissance dans un contexte OFDM O. Abel GOUBA Signal Communications & Embedded Electronics IETR/SUPELEC, Rennes campus, France S´ eminaire SCEE 03 Mai 2012
Conclusion References Outline 1 Background and motivation 2 Linearity considering PAPR reduction and Predistortion Predistortion error definition Expressions of 1st and 2nd order moment of Linearity performance measured by EVM 3 PA efficiency considering PAPR reduction and Predistortion Definition of PA efficiency Expression of the power efficiency 4 Joint combination of PAPR reduction and Predistortion Discussion and analysis Simulations and results 2/24
Conclusion References Background and motivation 1 Background and motivation 2 Linearity considering PAPR reduction and Predistortion 3 PA efficiency considering PAPR reduction and Predistortion 4 Joint combination of PAPR reduction and Predistortion 3/24
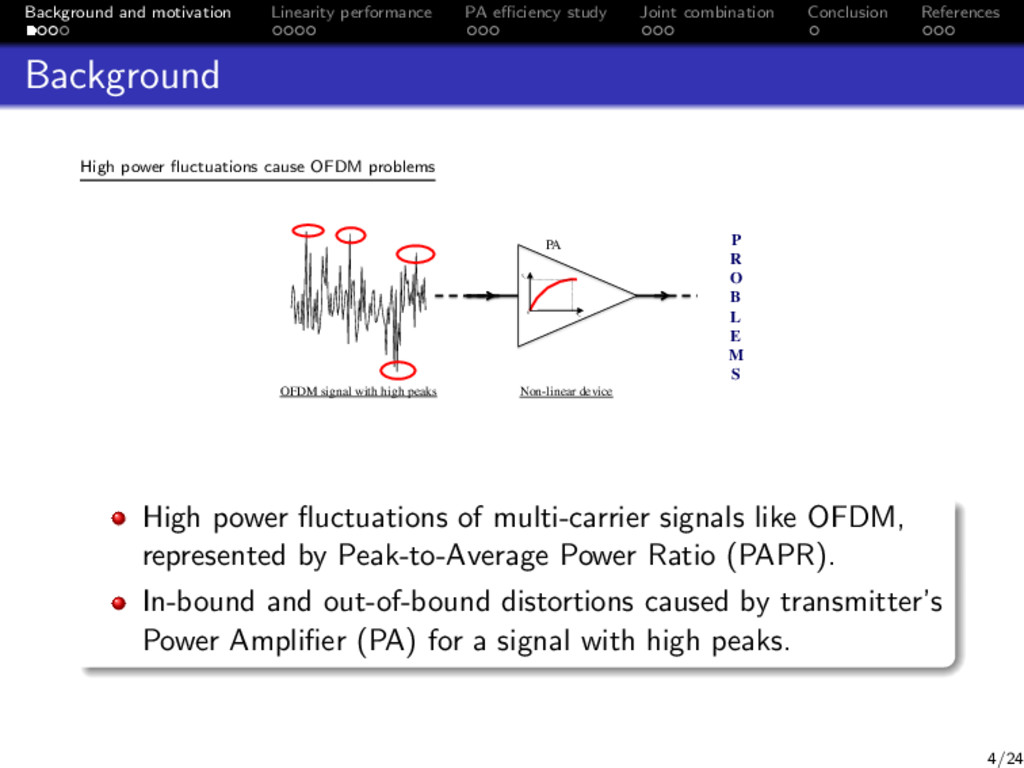
Conclusion References Background High power fluctuations cause OFDM problems PA P R O B L E M S OFDM signal with high peaks Non-linear device 0 in V out V High power fluctuations of multi-carrier signals like OFDM, represented by Peak-to-Average Power Ratio (PAPR). In-bound and out-of-bound distortions caused by transmitter’s Power Amplifier (PA) for a signal with high peaks. 4/24
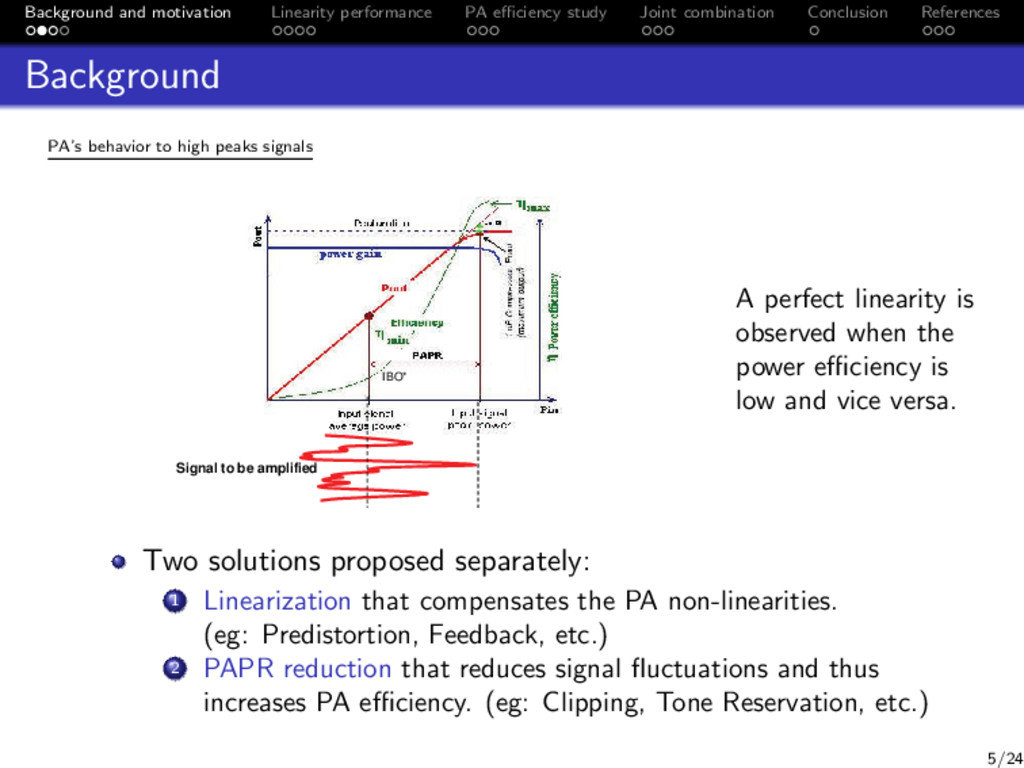
Conclusion References Background PA’s behavior to high peaks signals IBO* Signal to be amplified A perfect linearity is observed when the power efficiency is low and vice versa. Two solutions proposed separately: 1 Linearization that compensates the PA non-linearities. (eg: Predistortion, Feedback, etc.) 2 PAPR reduction that reduces signal fluctuations and thus increases PA efficiency. (eg: Clipping, Tone Reservation, etc.) 5/24
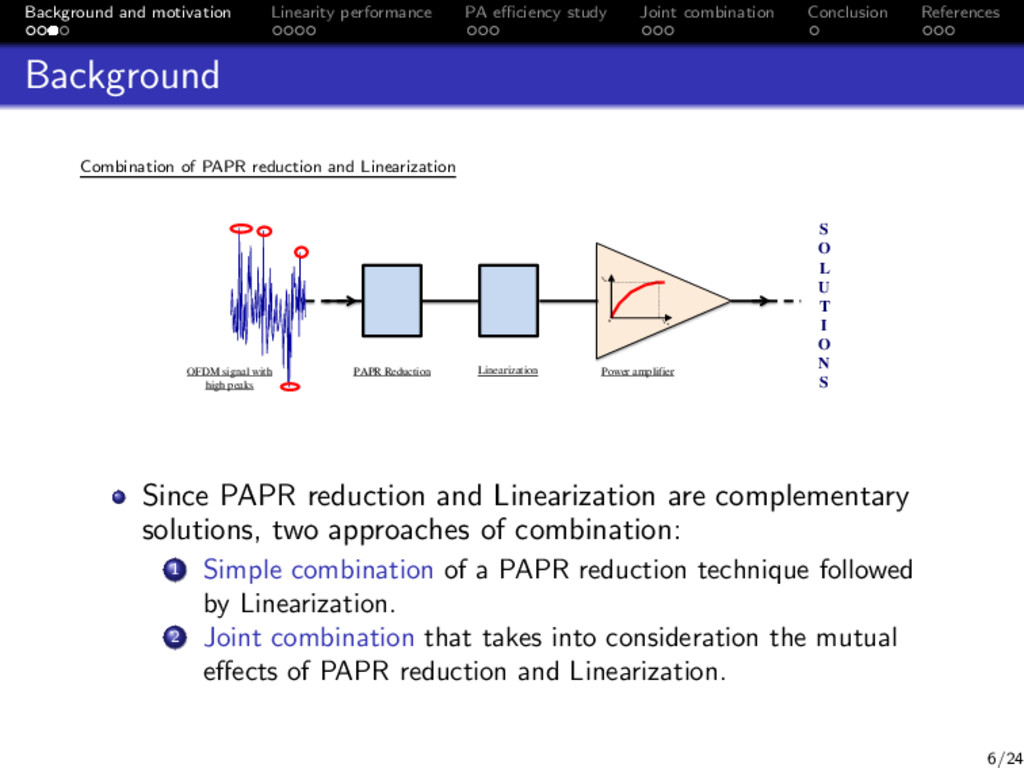
Conclusion References Background Combination of PAPR reduction and Linearization S O L U T I O N S OFDM signal with high peaks Power amplifier 0 in V out V PAPR Reduction Linearization Since PAPR reduction and Linearization are complementary solutions, two approaches of combination: 1 Simple combination of a PAPR reduction technique followed by Linearization. 2 Joint combination that takes into consideration the mutual effects of PAPR reduction and Linearization. 6/24
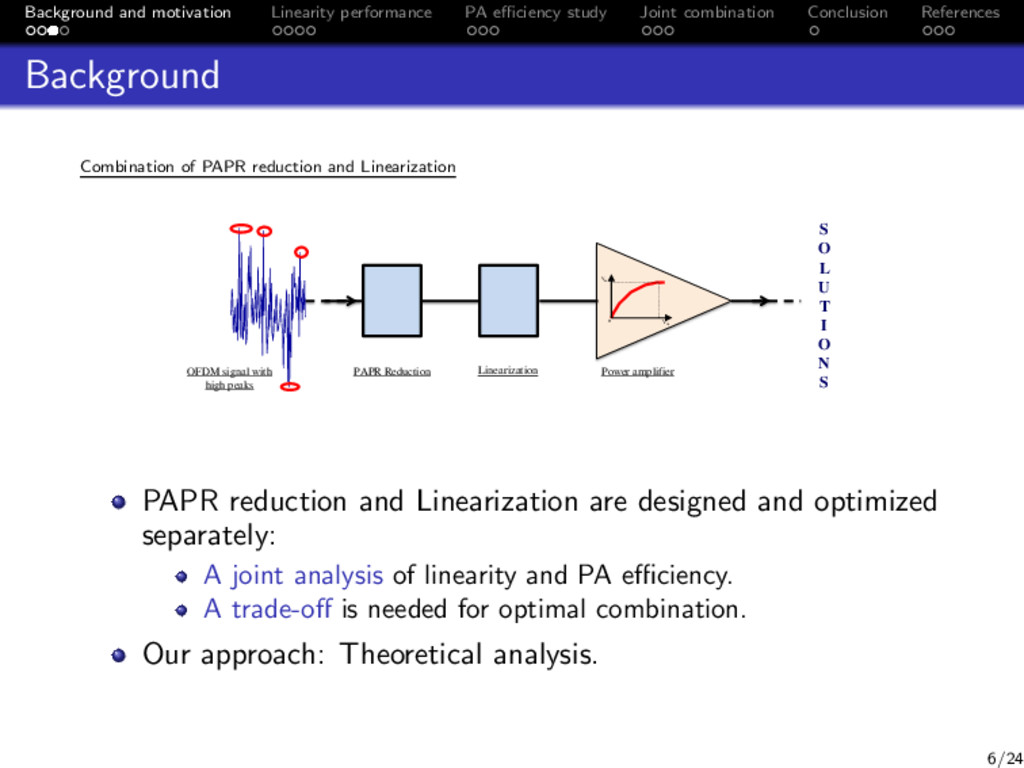
Conclusion References Background Combination of PAPR reduction and Linearization S O L U T I O N S OFDM signal with high peaks Power amplifier 0 in V out V PAPR Reduction Linearization PAPR reduction and Linearization are designed and optimized separately: A joint analysis of linearity and PA efficiency. A trade-off is needed for optimal combination. Our approach: Theoretical analysis. 6/24
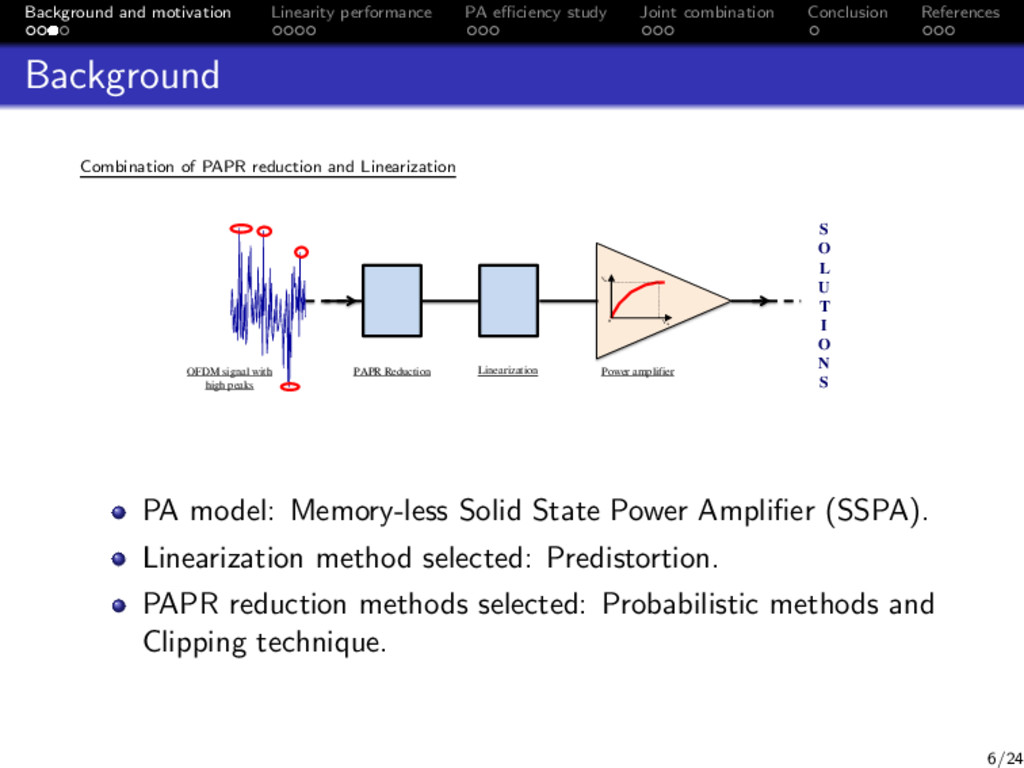
Conclusion References Background Combination of PAPR reduction and Linearization S O L U T I O N S OFDM signal with high peaks Power amplifier 0 in V out V PAPR Reduction Linearization PA model: Memory-less Solid State Power Amplifier (SSPA). Linearization method selected: Predistortion. PAPR reduction methods selected: Probabilistic methods and Clipping technique. 6/24
Conclusion References Motivation Study objectives Theoretical expressions of the linearity performance measured by EVM metric and the PA efficiency. Analytical trade-off that ensures a good linearity with reasonable efficiency by combining PAPR reduction and Predistortion. 7/24
Conclusion References Linearity considering PAPR reduction and Predistortion 1 Background and motivation 2 Linearity considering PAPR reduction and Predistortion Predistortion error definition Expressions of 1st and 2nd order moment of Linearity performance measured by EVM 3 PA efficiency considering PAPR reduction and Predistortion 4 Joint combination of PAPR reduction and Predistortion 8/24
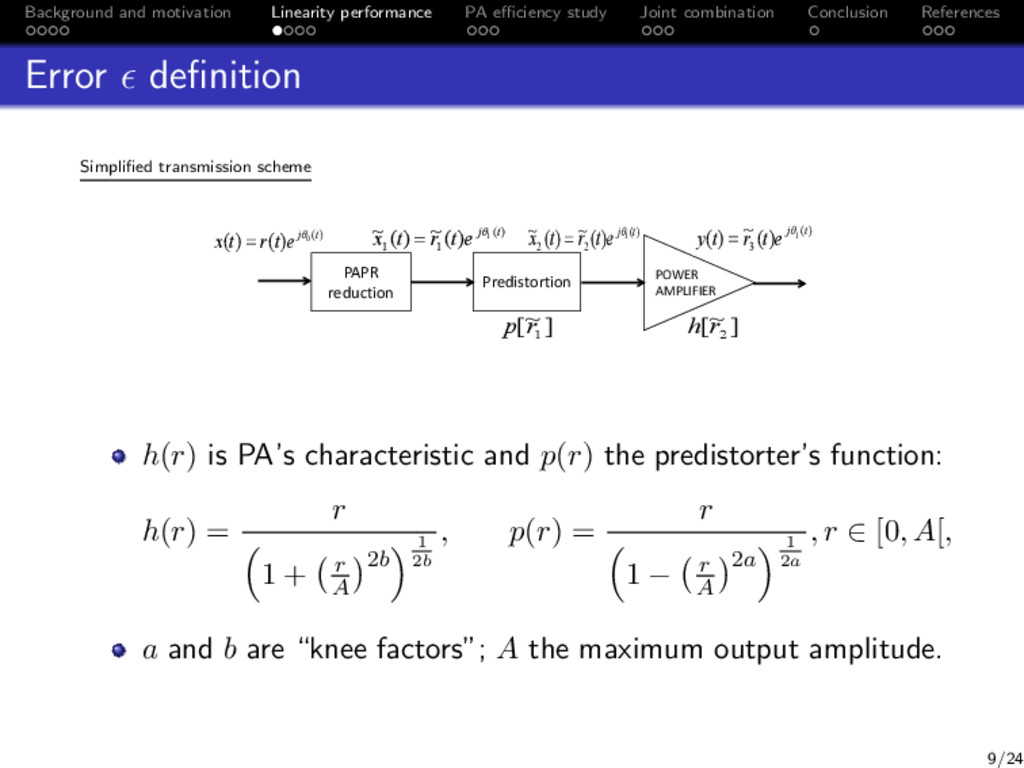
Conclusion References Error definition Simplified transmission scheme ) ( 0 ) ( ) ( t j e t r t x θ = ) ( 1 1 1 ) ( ~ ) ( ~ t j e t r t x θ = ] ~ [ 1 r p ] ~ [ 2 r h ) ( 2 2 1 ) ( ~ ) ( ~ t j e t r t x θ = PAPR reduction Predistortion POWER AMPLIFIER ) ( 3 1 ) ( ~ ) ( t j e t r t y θ = h(r) is PA’s characteristic and p(r) the predistorter’s function: h(r) = r 1 + r A 2b 1 2b , p(r) = r 1 − r A 2a 1 2a , r ∈ [0, A[, a and b are “knee factors”; A the maximum output amplitude. 9/24
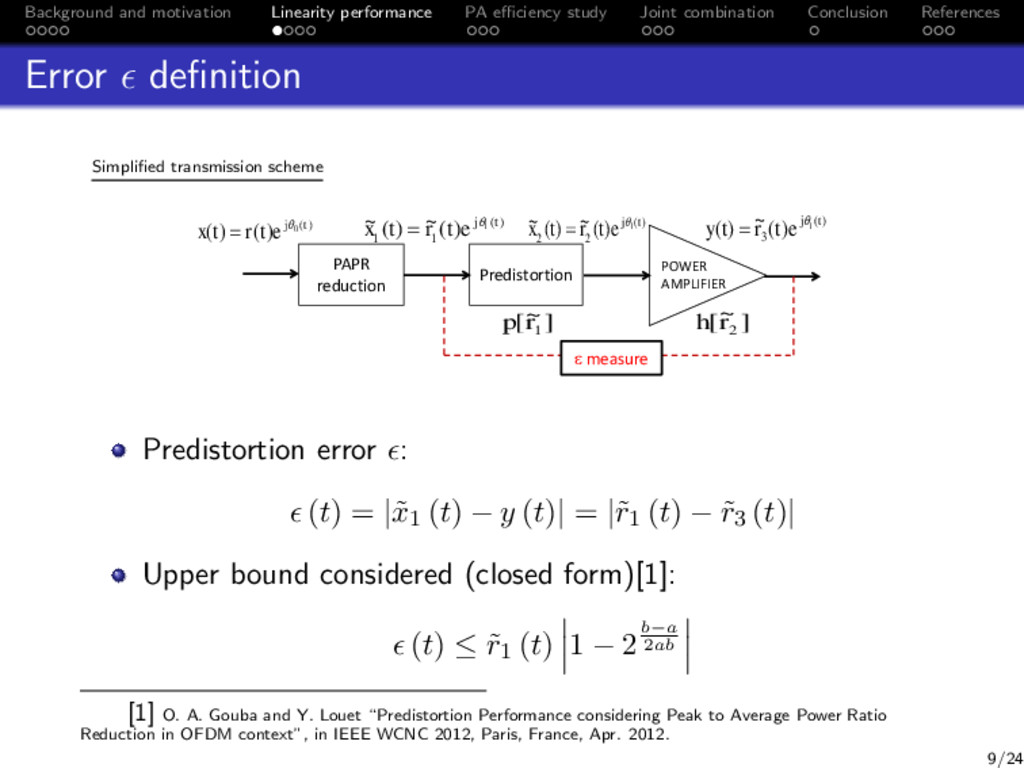
Conclusion References Error definition Simplified transmission scheme ) ( 0 ) ( ) ( t j e t r t x ) ( 1 1 1 ) ( ~ ) ( ~ t j e t r t x ] ~ [ 1 r p ] ~ [ 2 r h ) ( 2 2 1 ) ( ~ ) ( ~ t j e t r t x PAPR reduction Predistortion POWER AMPLIFIER ) ( 3 1 ) ( ~ ) ( t j e t r t y measure Predistortion error : (t) = |˜ x1 (t) − y (t)| = |˜ r1 (t) − ˜ r3 (t)| Upper bound considered (closed form)[1]: (t) ≤ ˜ r1 (t) 1 − 2b−a 2ab [1] O. A. Gouba and Y. Louet “Predistortion Performance considering Peak to Average Power Ratio Reduction in OFDM context”, in IEEE WCNC 2012, Paris, France, Apr. 2012. 9/24
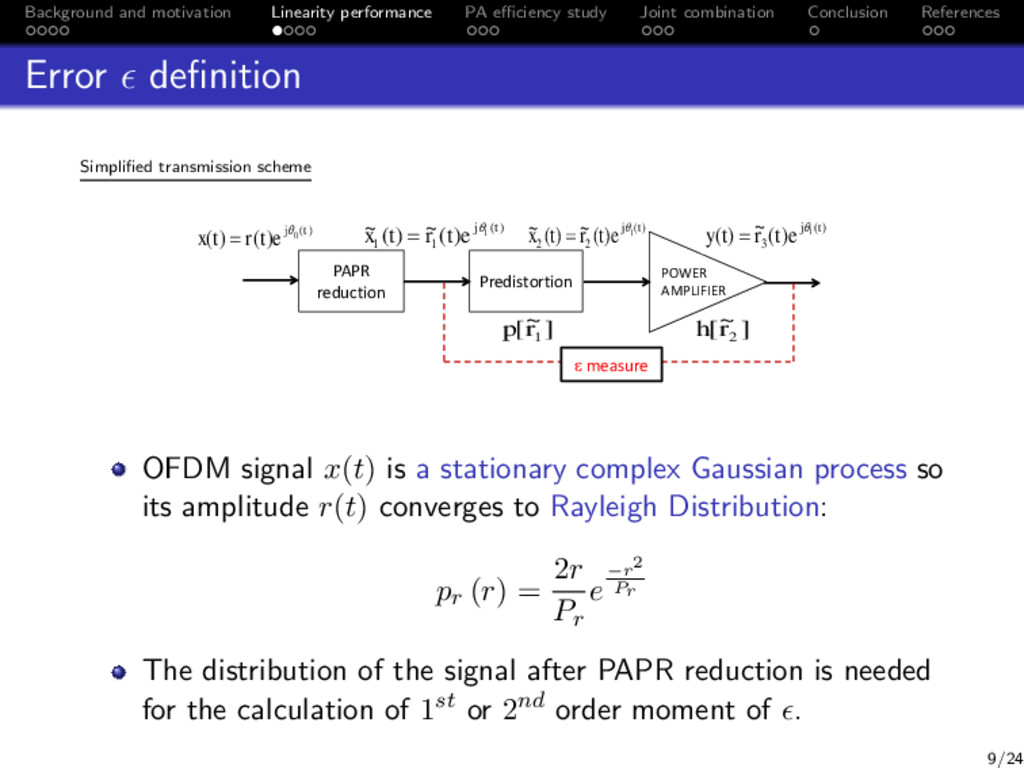
Conclusion References Error definition Simplified transmission scheme ) ( 0 ) ( ) ( t j e t r t x ) ( 1 1 1 ) ( ~ ) ( ~ t j e t r t x ] ~ [ 1 r p ] ~ [ 2 r h ) ( 2 2 1 ) ( ~ ) ( ~ t j e t r t x PAPR reduction Predistortion POWER AMPLIFIER ) ( 3 1 ) ( ~ ) ( t j e t r t y measure OFDM signal x(t) is a stationary complex Gaussian process so its amplitude r(t) converges to Rayleigh Distribution: pr (r) = 2r Pr e−r2 Pr The distribution of the signal after PAPR reduction is needed for the calculation of 1st or 2nd order moment of . 9/24
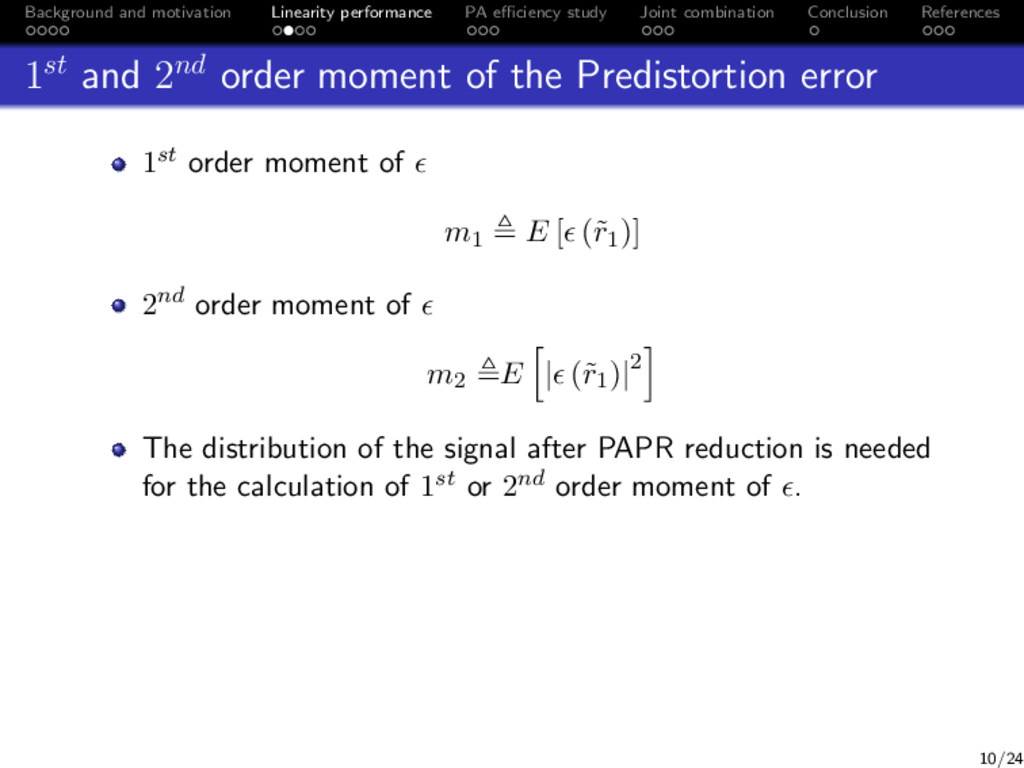
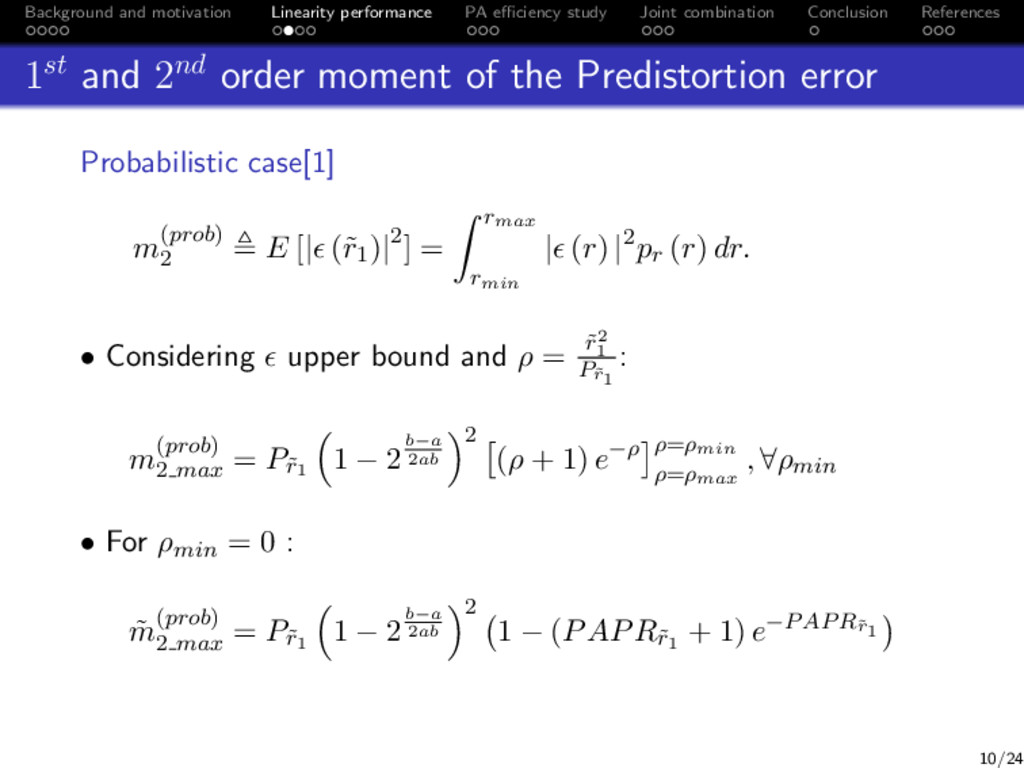
Conclusion References 1st and 2nd order moment of the Predistortion error 1st order moment of m1 E [ (˜ r1)] 2nd order moment of m2 E | (˜ r1)|2 The distribution of the signal after PAPR reduction is needed for the calculation of 1st or 2nd order moment of . 10/24
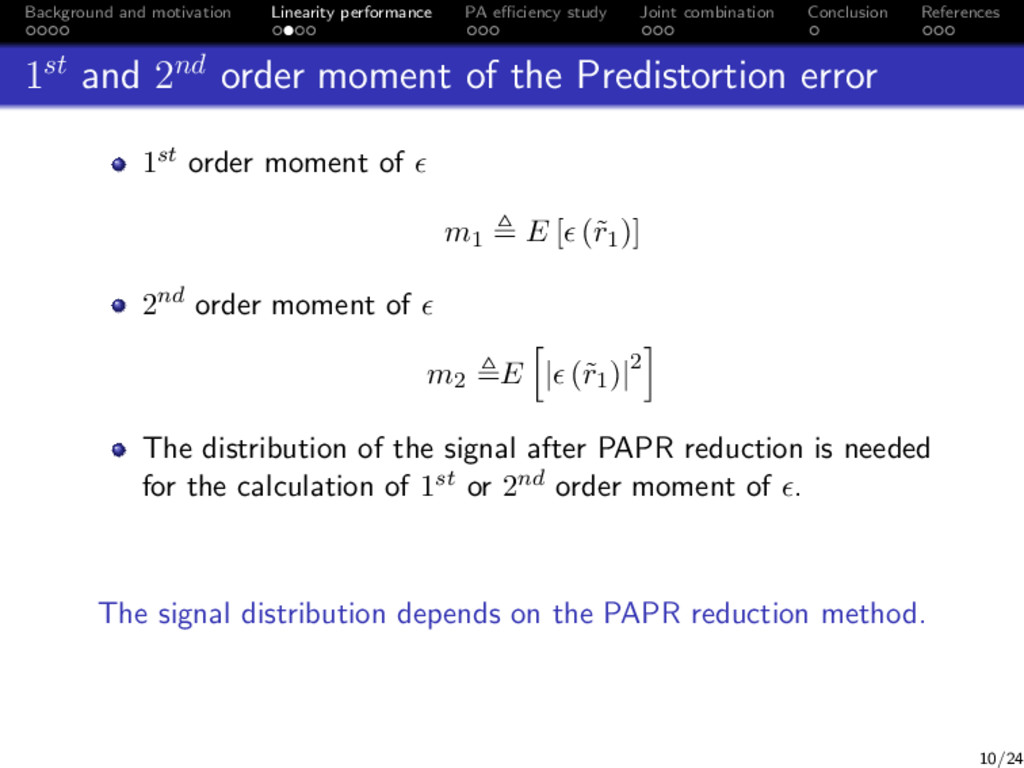
Conclusion References 1st and 2nd order moment of the Predistortion error 1st order moment of m1 E [ (˜ r1)] 2nd order moment of m2 E | (˜ r1)|2 The distribution of the signal after PAPR reduction is needed for the calculation of 1st or 2nd order moment of . The signal distribution depends on the PAPR reduction method. 10/24
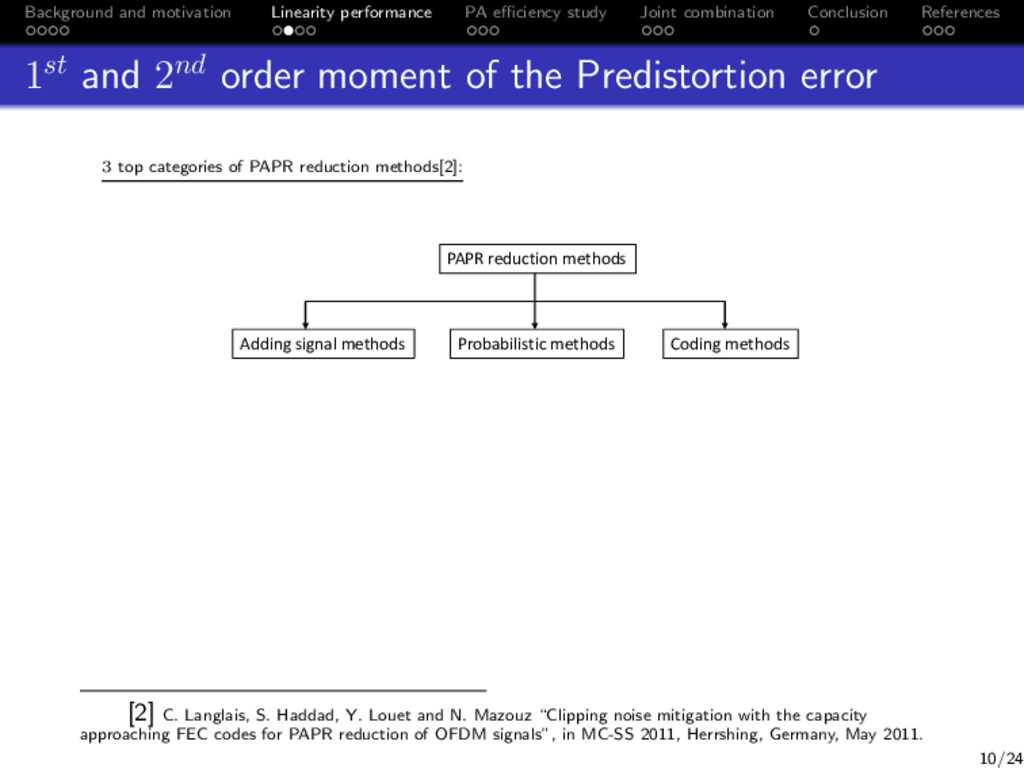
Conclusion References 1st and 2nd order moment of the Predistortion error 3 top categories of PAPR reduction methods[2]: PAPR reduction methods Adding signal methods Probabilistic methods Coding methods [2] C. Langlais, S. Haddad, Y. Louet and N. Mazouz “Clipping noise mitigation with the capacity approaching FEC codes for PAPR reduction of OFDM signals”, in MC-SS 2011, Herrshing, Germany, May 2011. 10/24
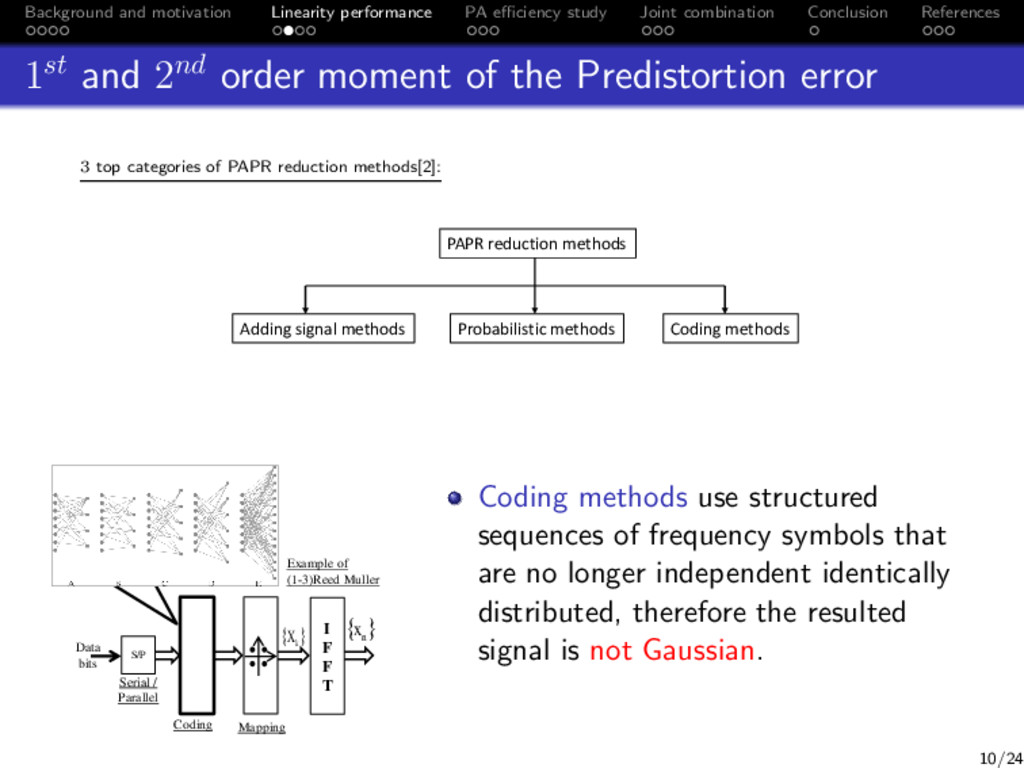
Conclusion References 1st and 2nd order moment of the Predistortion error 3 top categories of PAPR reduction methods[2]: PAPR reduction methods Adding signal methods Probabilistic methods Coding methods Data bits Coding I F F T Mapping Serial / Parallel S/P Example of (1-3)Reed Muller k X n x Coding methods use structured sequences of frequency symbols that are no longer independent identically distributed, therefore the resulted signal is not Gaussian. 10/24
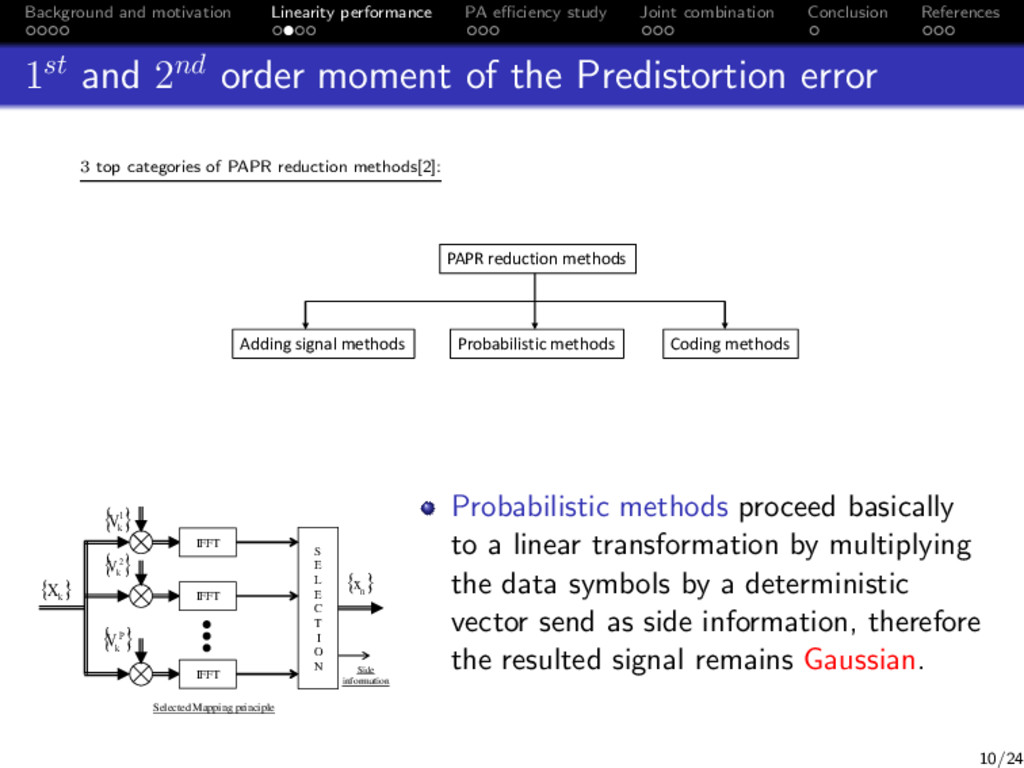
Conclusion References 1st and 2nd order moment of the Predistortion error 3 top categories of PAPR reduction methods[2]: PAPR reduction methods Adding signal methods Probabilistic methods Coding methods S E L E C T I O N IFFT IFFT IFFT 1 k V 2 k V P k V k X n x Side information Selected Mapping principle Probabilistic methods proceed basically to a linear transformation by multiplying the data symbols by a deterministic vector send as side information, therefore the resulted signal remains Gaussian. 10/24
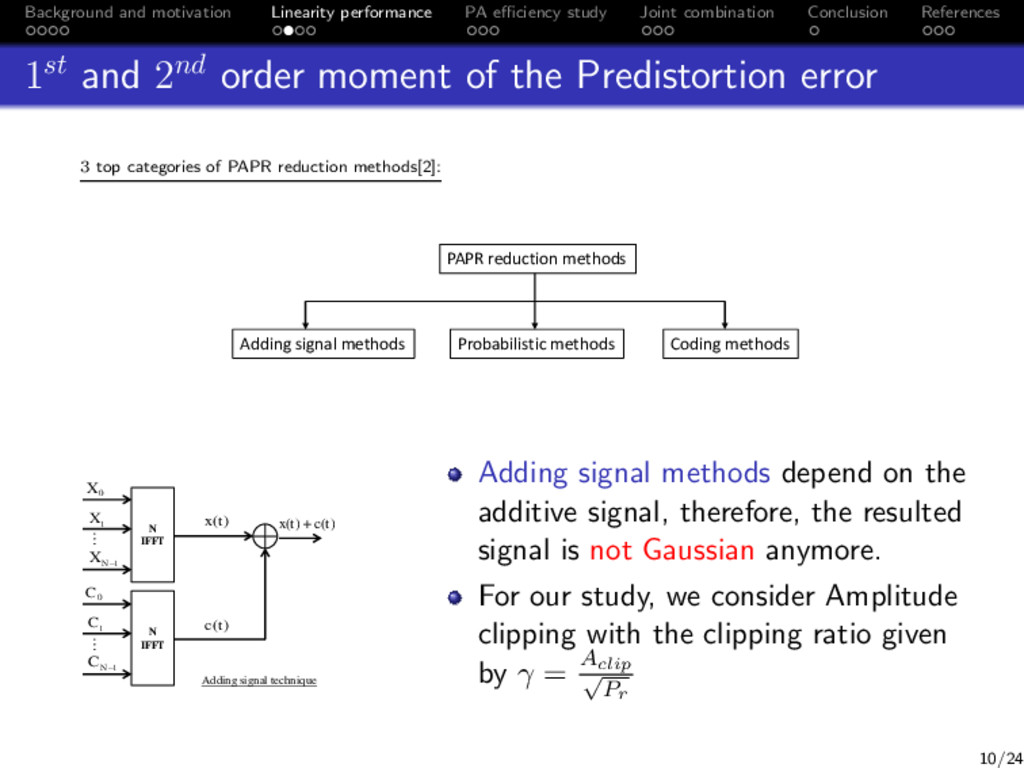
Conclusion References 1st and 2nd order moment of the Predistortion error 3 top categories of PAPR reduction methods[2]: PAPR reduction methods Adding signal methods Probabilistic methods Coding methods N IFFT N IFFT 0 X 1 X 1 N X 0 C 1 C 1 N C ) (t c ) (t x ) ( ) ( t c t x Adding signal technique Adding signal methods depend on the additive signal, therefore, the resulted signal is not Gaussian anymore. For our study, we consider Amplitude clipping with the clipping ratio given by γ = Aclip √ Pr 10/24
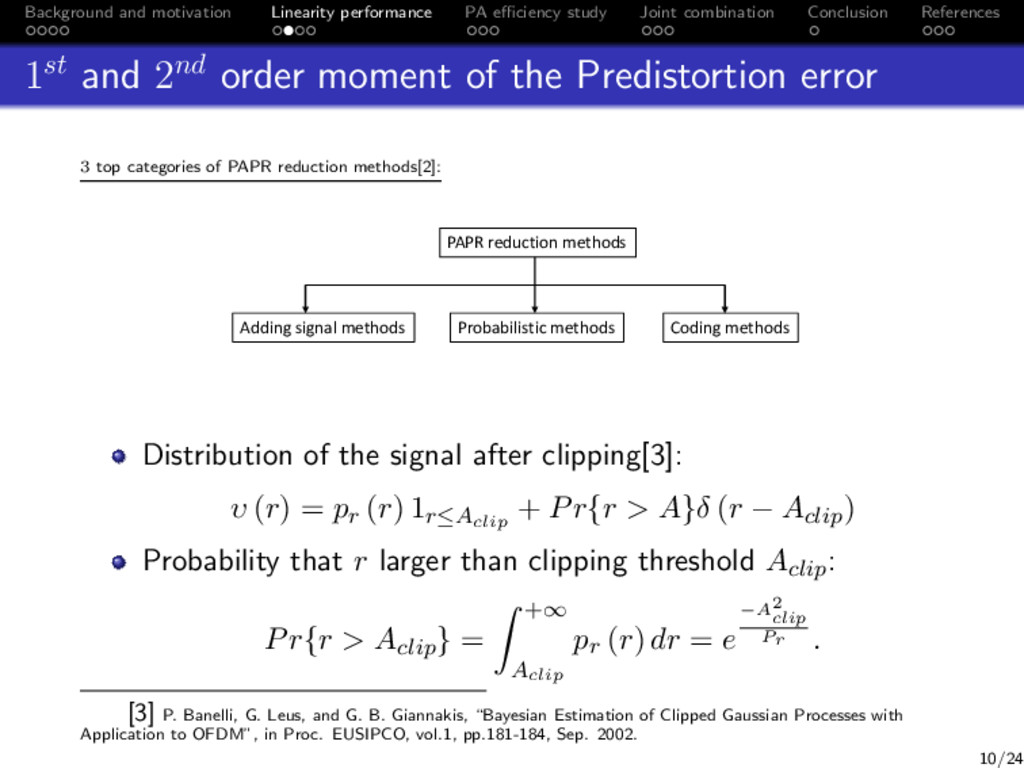
Conclusion References 1st and 2nd order moment of the Predistortion error 3 top categories of PAPR reduction methods[2]: PAPR reduction methods Adding signal methods Probabilistic methods Coding methods Distribution of the signal after clipping[3]: υ (r) = pr (r) 1r≤Aclip + Pr{r > A}δ (r − Aclip) Probability that r larger than clipping threshold Aclip: Pr{r > Aclip} = +∞ Aclip pr (r) dr = e −A2 clip Pr . [3] P. Banelli, G. Leus, and G. B. Giannakis, “Bayesian Estimation of Clipped Gaussian Processes with Application to OFDM”, in Proc. EUSIPCO, vol.1, pp.181-184, Sep. 2002. 10/24
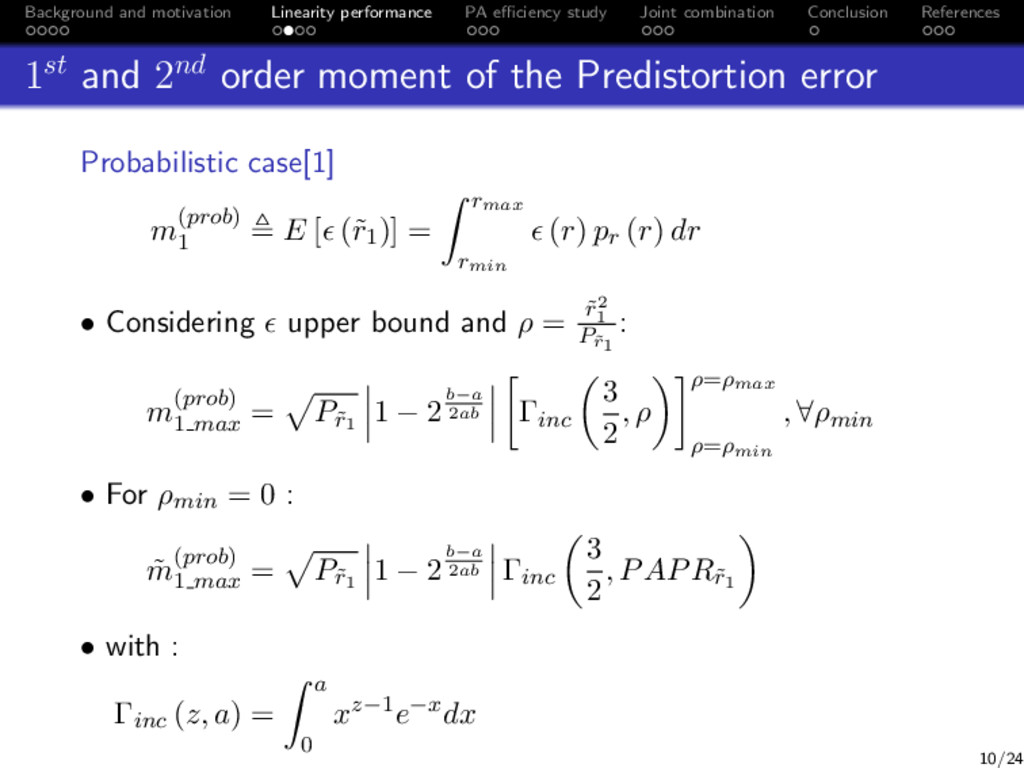
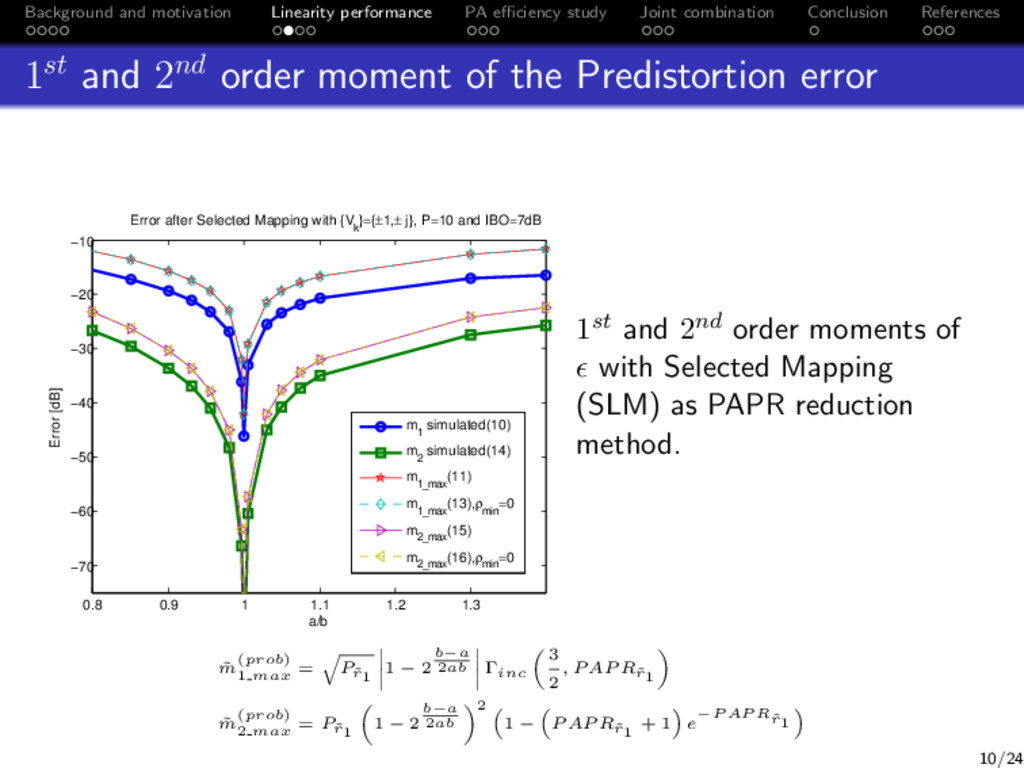
Conclusion References 1st and 2nd order moment of the Predistortion error 0.8 0.9 1 1.1 1.2 1.3 −70 −60 −50 −40 −30 −20 −10 Error after Selected Mapping with {V k }={±1,± j}, P=10 and IBO=7dB a/b Error [dB] m 1 simulated(10) m 2 simulated(14) m 1_max (11) m 1_max (13),ρ min =0 m 2_max (15) m 2_max (16),ρ min =0 1st and 2nd order moments of with Selected Mapping (SLM) as PAPR reduction method. ˜ m(prob) 1 max = P˜ r1 1 − 2 b−a 2ab Γinc 3 2 , P AP R˜ r1 ˜ m(prob) 2 max = P˜ r1 1 − 2 b−a 2ab 2 1 − P AP R˜ r1 + 1 e −P AP R˜ r1 10/24
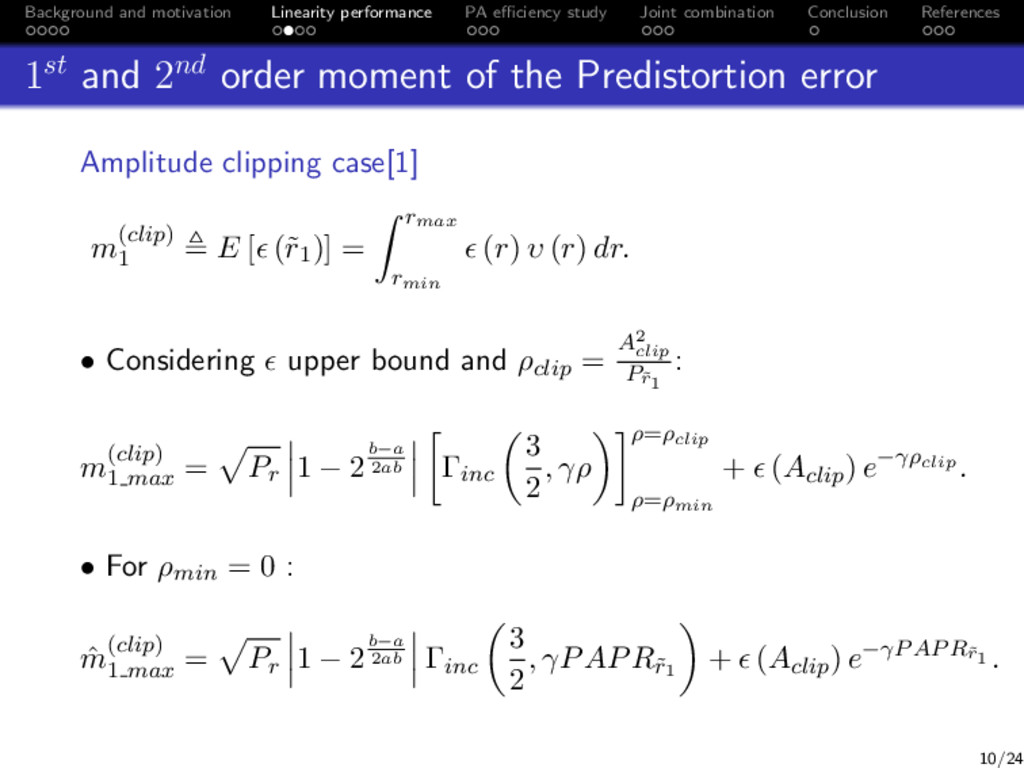
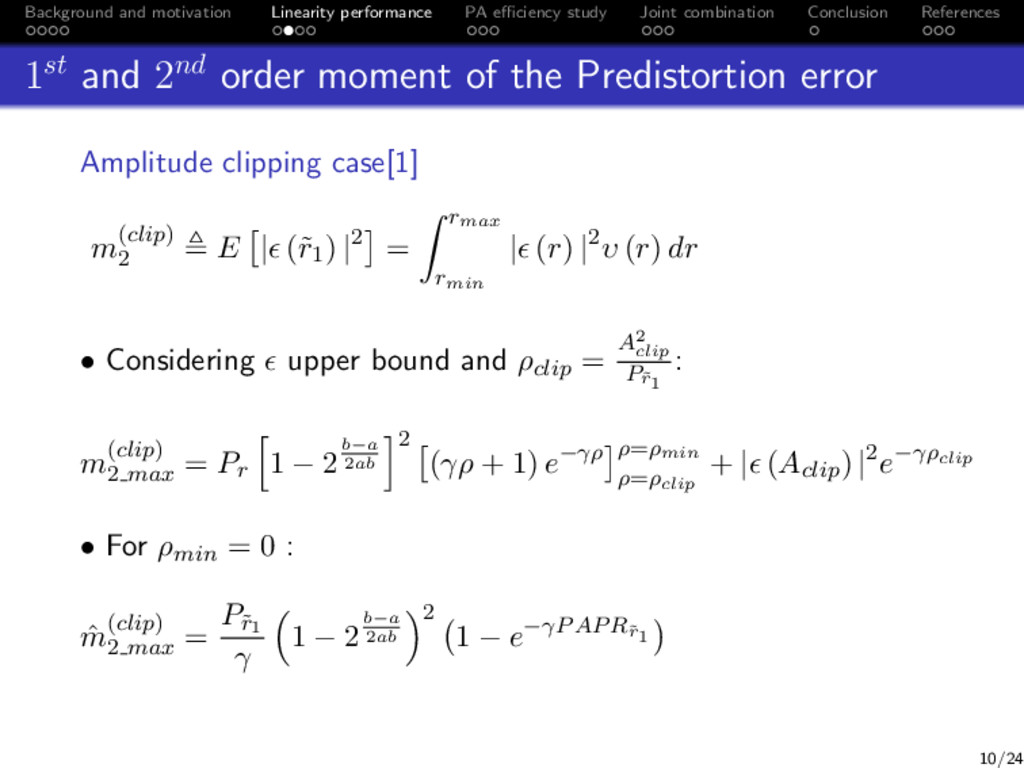
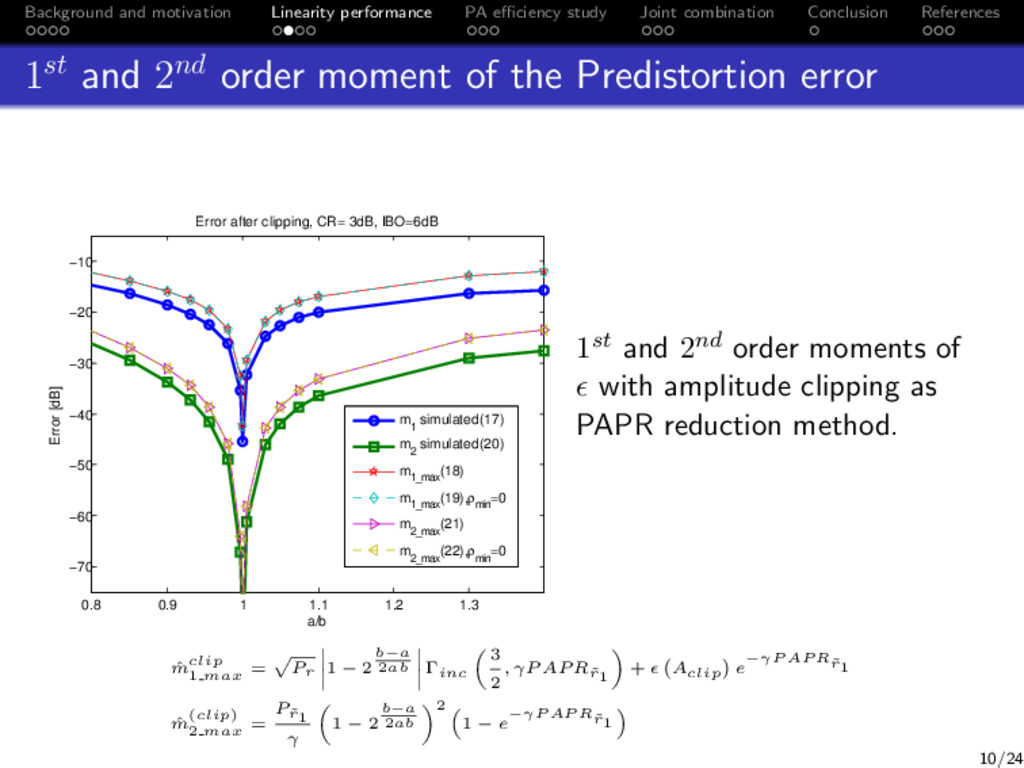
Conclusion References 1st and 2nd order moment of the Predistortion error 0.8 0.9 1 1.1 1.2 1.3 −70 −60 −50 −40 −30 −20 −10 Error after clipping, CR= 3dB, IBO=6dB a/b Error [dB] m 1 simulated(17) m 2 simulated(20) m 1_max (18) m 1_max (19),ρ min =0 m 2_max (21) m 2_max (22),ρ min =0 1st and 2nd order moments of with amplitude clipping as PAPR reduction method. ˆ mclip 1 max = Pr 1 − 2 b−a 2ab Γinc 3 2 , γP AP R˜ r1 + Aclip e −γP AP R˜ r1 ˆ m(clip) 2 max = P˜ r1 γ 1 − 2 b−a 2ab 2 1 − e −γP AP R˜ r1 10/24
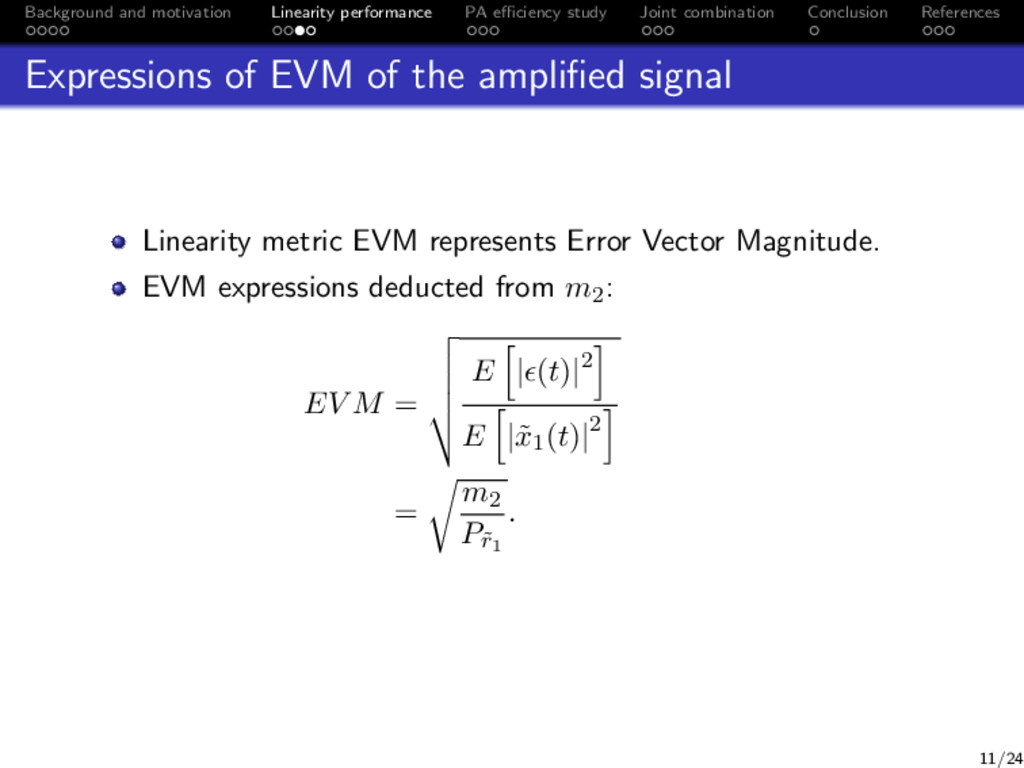
Conclusion References Expressions of EVM of the amplified signal Linearity metric EVM represents Error Vector Magnitude. EVM expressions deducted from m2: EV M = E | (t)|2 E |˜ x1(t)|2 = m2 P˜ r1 . 11/24
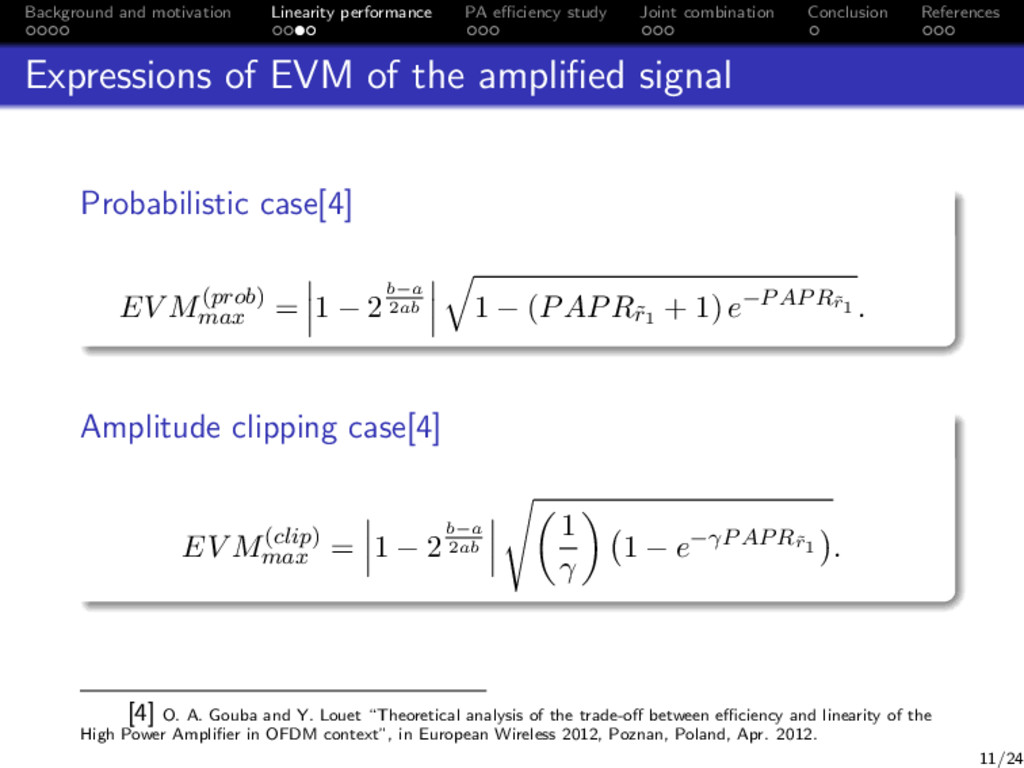
Conclusion References Expressions of EVM of the amplified signal Probabilistic case[4] EV M(prob) max = 1 − 2b−a 2ab 1 − (PAPR˜ r1 + 1) e−PAPR˜ r1 . Amplitude clipping case[4] EV M(clip) max = 1 − 2b−a 2ab 1 γ 1 − e−γPAPR˜ r1 . [4] O. A. Gouba and Y. Louet “Theoretical analysis of the trade-off between efficiency and linearity of the High Power Amplifier in OFDM context”, in European Wireless 2012, Poznan, Poland, Apr. 2012. 11/24
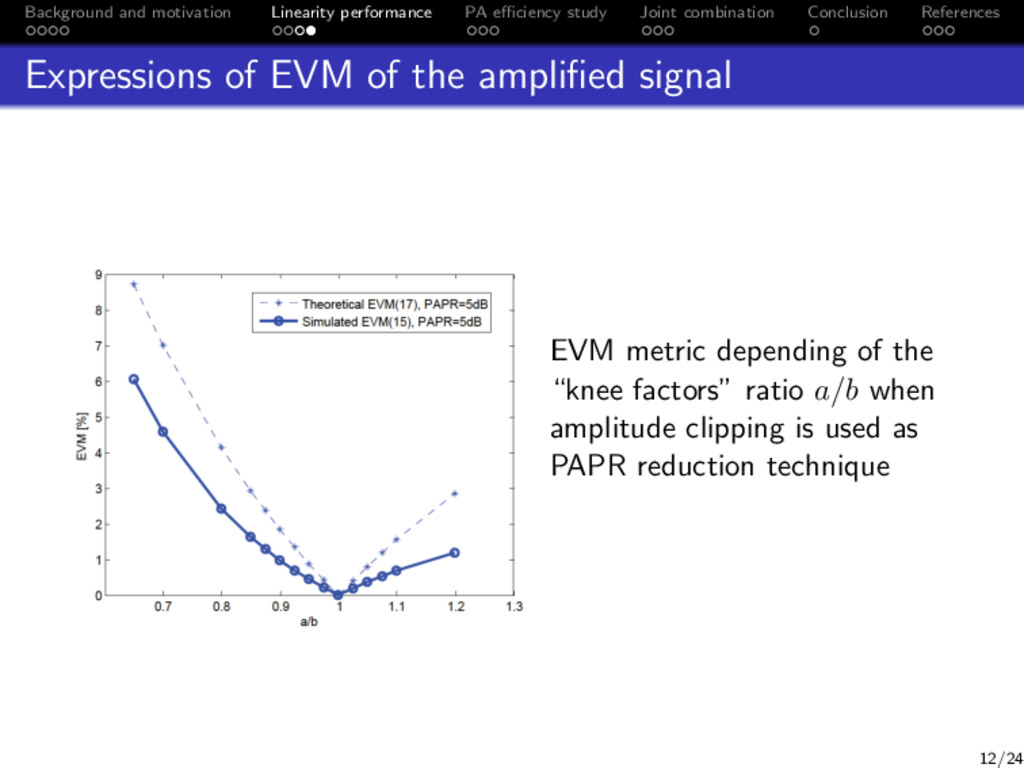
Conclusion References Expressions of EVM of the amplified signal EVM metric depending of the “knee factors” ratio a/b when amplitude clipping is used as PAPR reduction technique 12/24
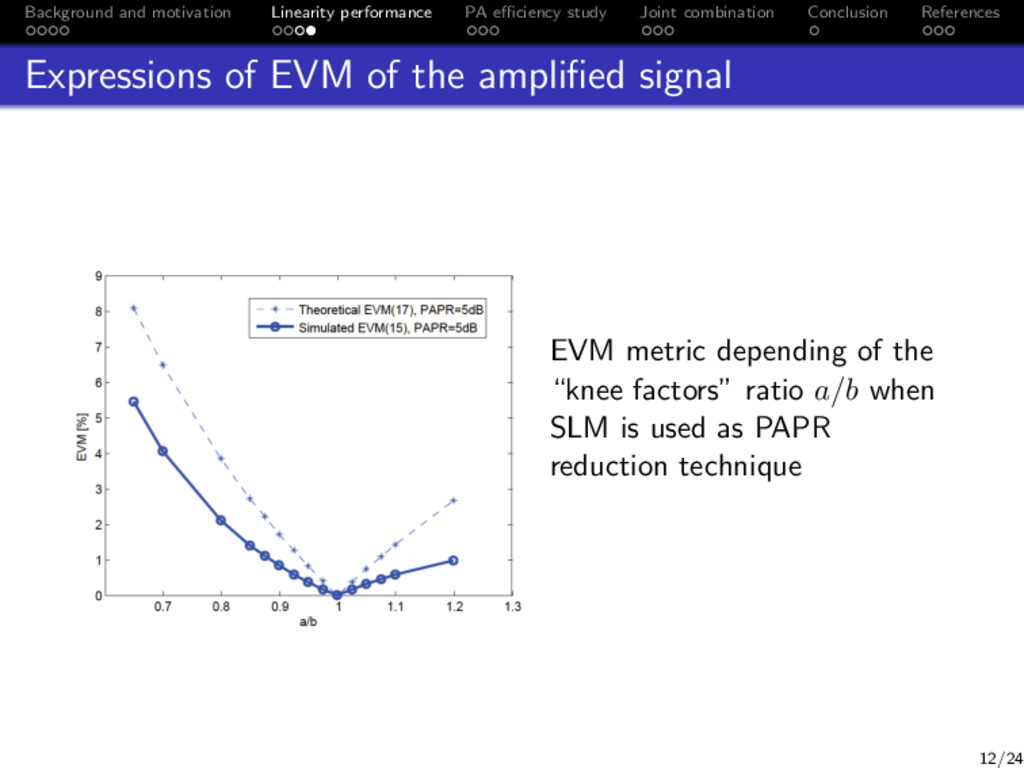
Conclusion References Expressions of EVM of the amplified signal EVM metric depending of the “knee factors” ratio a/b when SLM is used as PAPR reduction technique 12/24
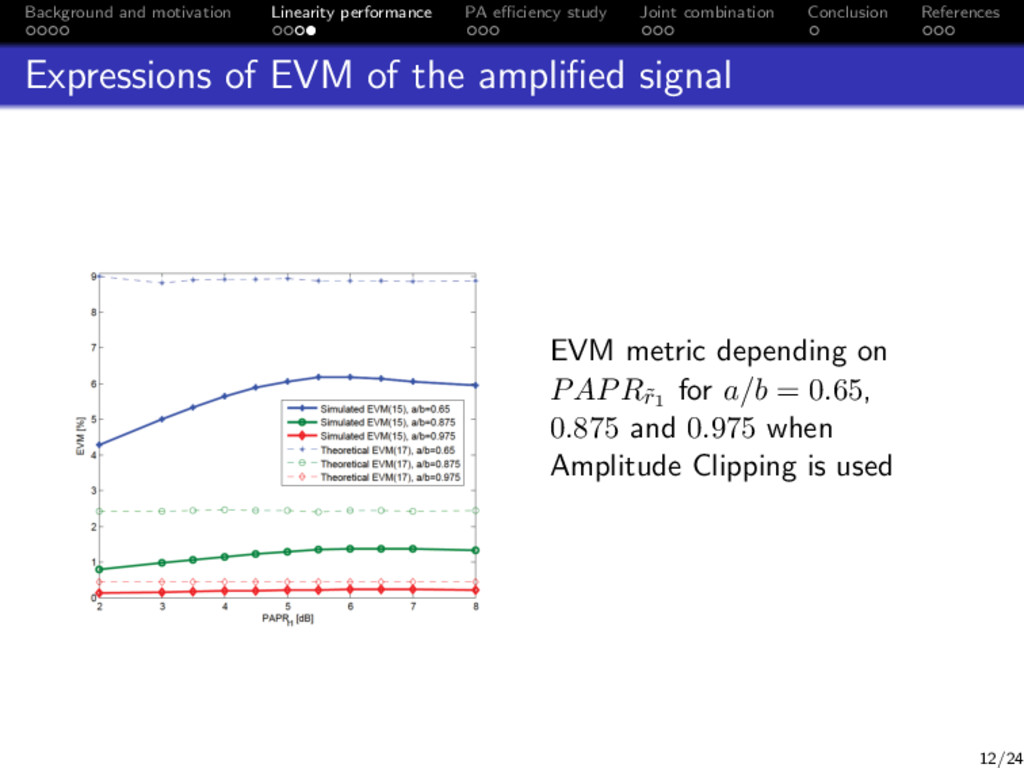
Conclusion References Expressions of EVM of the amplified signal EVM metric depending on PAPR˜ r1 for a/b = 0.65, 0.875 and 0.975 when Amplitude Clipping is used 12/24
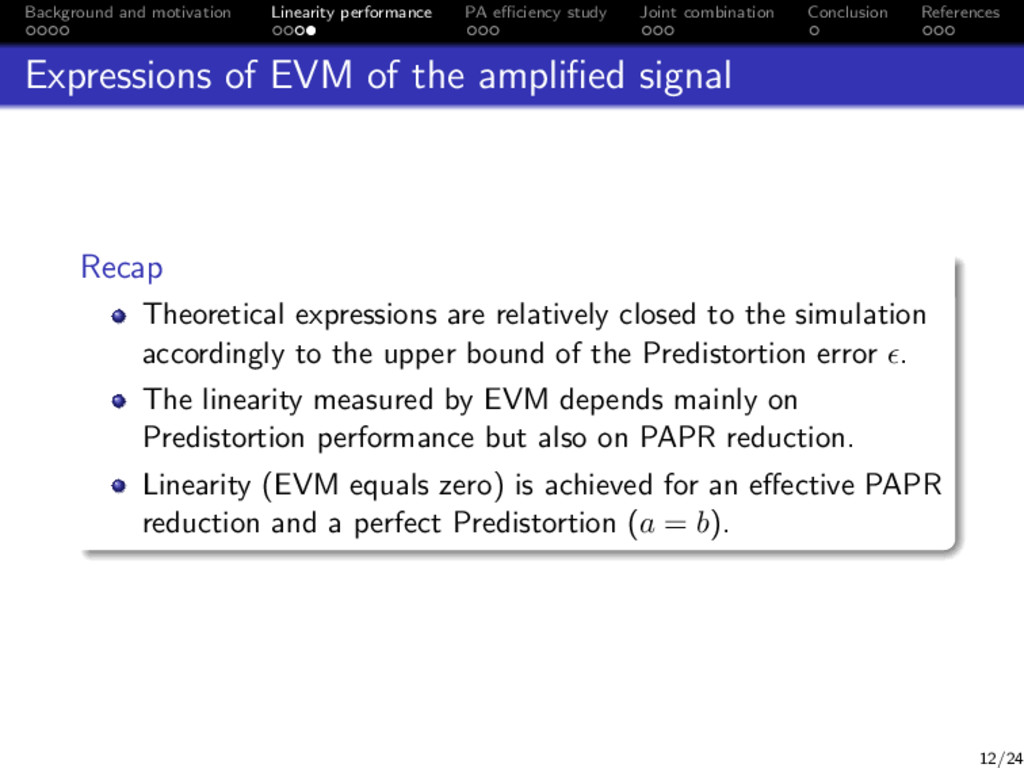
Conclusion References Expressions of EVM of the amplified signal Recap Theoretical expressions are relatively closed to the simulation accordingly to the upper bound of the Predistortion error . The linearity measured by EVM depends mainly on Predistortion performance but also on PAPR reduction. Linearity (EVM equals zero) is achieved for an effective PAPR reduction and a perfect Predistortion (a = b). 12/24
Conclusion References PA efficiency considering PAPR reduction and Predistortion 1 Background and motivation 2 Linearity considering PAPR reduction and Predistortion 3 PA efficiency considering PAPR reduction and Predistortion Definition of PA efficiency Expression of the power efficiency 4 Joint combination of PAPR reduction and Predistortion 13/24
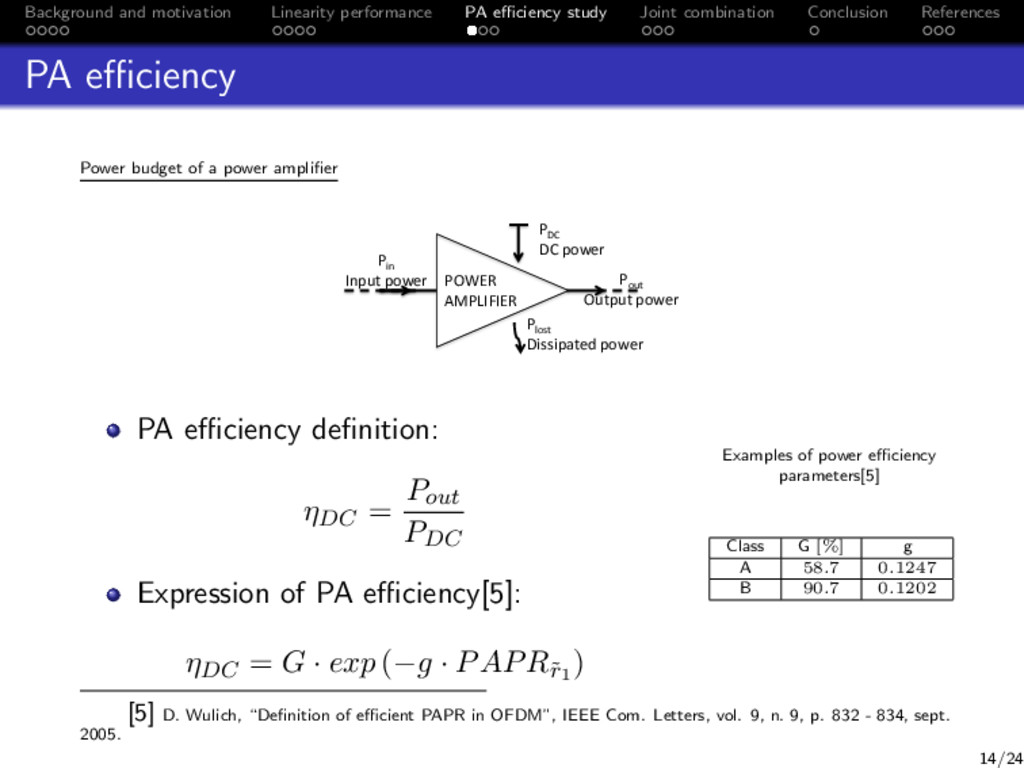
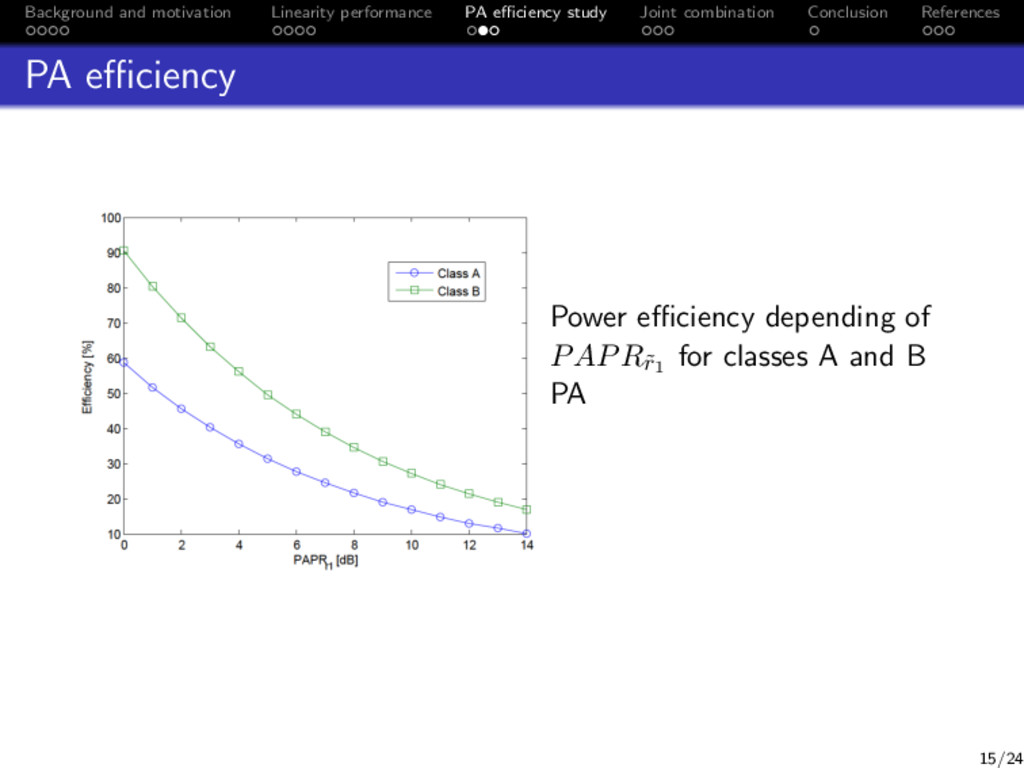
Conclusion References PA efficiency Power budget of a power amplifier POWER AMPLIFIER Pin Input power Pout Output power PDC DC power Plost Dissipated power PA efficiency definition: ηDC = Pout PDC Expression of PA efficiency[5]: ηDC = G · exp (−g · PAPR˜ r1 ) Examples of power efficiency parameters[5] Class G [%] g A 58.7 0.1247 B 90.7 0.1202 [5] D. Wulich, “Definition of efficient PAPR in OFDM”, IEEE Com. Letters, vol. 9, n. 9, p. 832 - 834, sept. 2005. 14/24
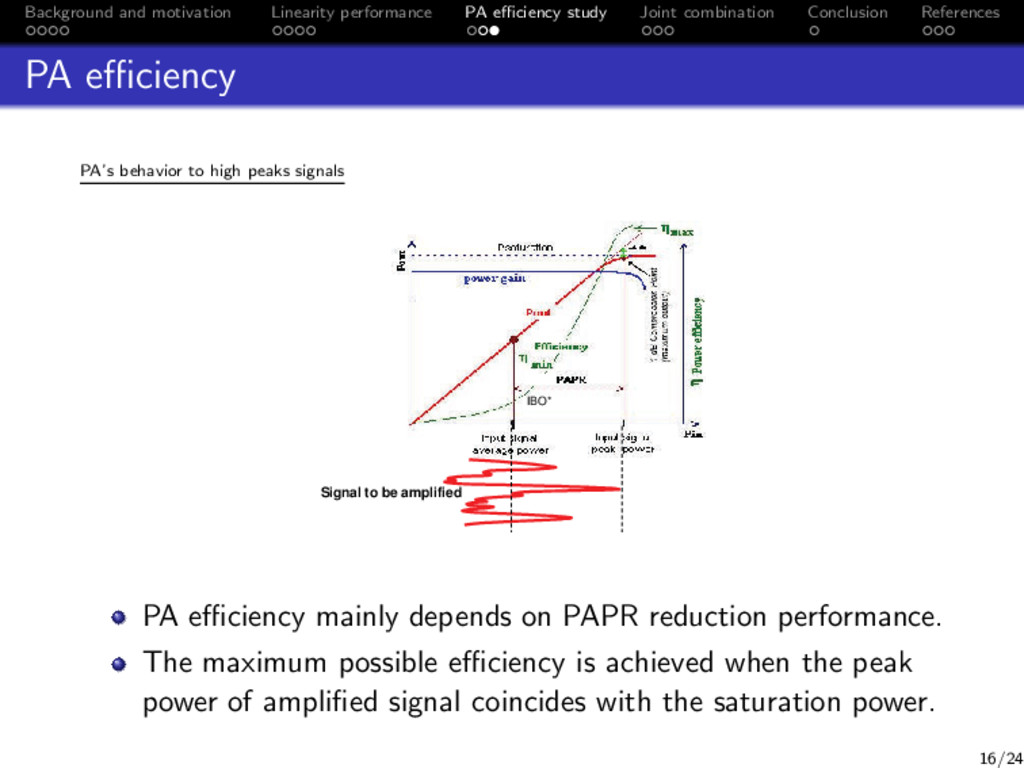
Conclusion References PA efficiency PA’s behavior to high peaks signals IBO* Signal to be amplified PA efficiency mainly depends on PAPR reduction performance. The maximum possible efficiency is achieved when the peak power of amplified signal coincides with the saturation power. 16/24
Conclusion References Joint combination of PAPR reduction and Predistortion 1 Background and motivation 2 Linearity considering PAPR reduction and Predistortion 3 PA efficiency considering PAPR reduction and Predistortion 4 Joint combination of PAPR reduction and Predistortion Discussion and analysis Simulations and results 17/24
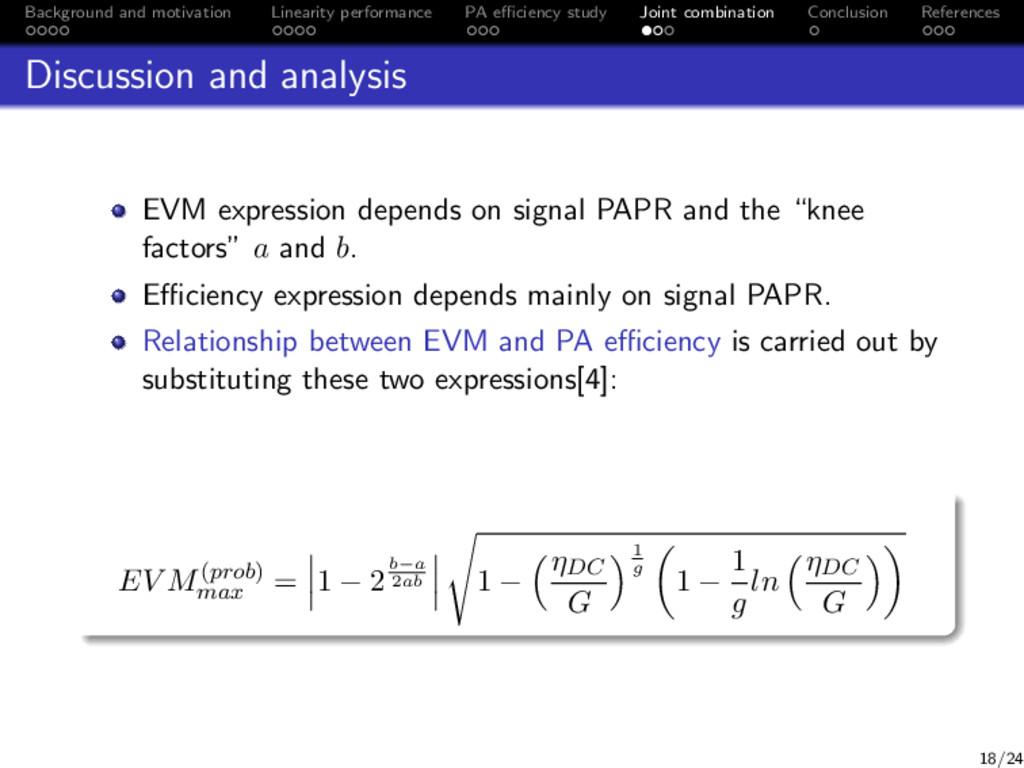
Conclusion References Discussion and analysis EVM expression depends on signal PAPR and the “knee factors” a and b. Efficiency expression depends mainly on signal PAPR. Relationship between EVM and PA efficiency is carried out by substituting these two expressions[4]: EV M(prob) max = 1 − 2b−a 2ab 1 − ηDC G 1 g 1 − 1 g ln ηDC G 18/24
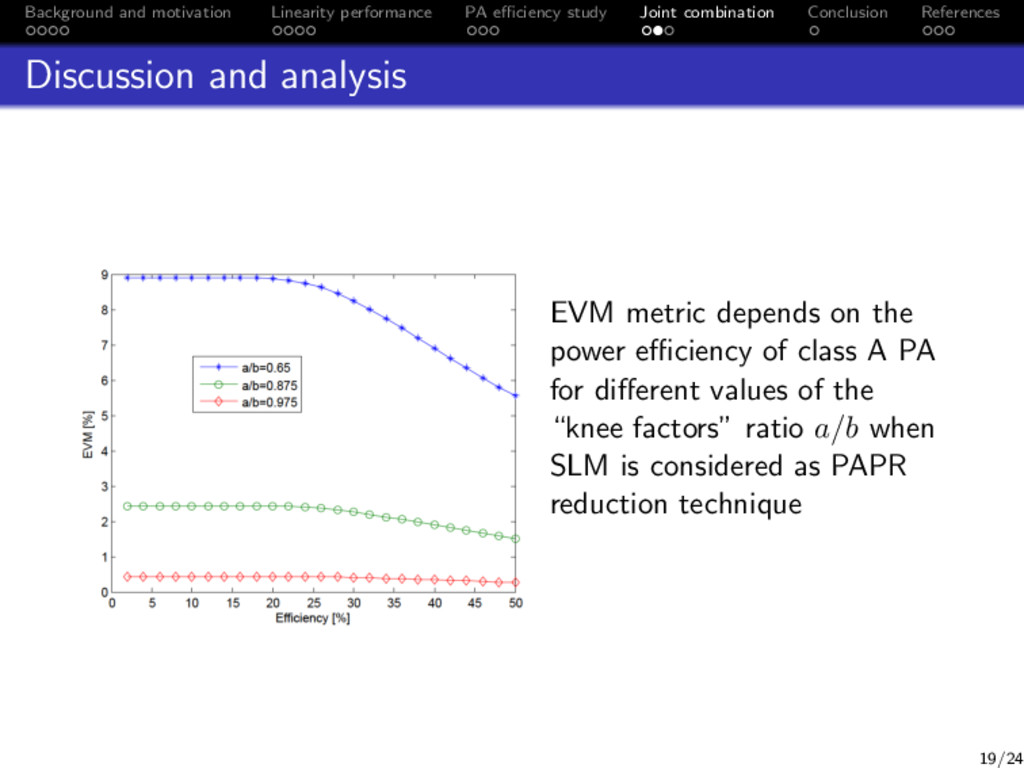
Conclusion References Discussion and analysis EVM metric depends on the power efficiency of class A PA for different values of the “knee factors” ratio a/b when SLM is considered as PAPR reduction technique 19/24
Conclusion References Discussion and analysis Recommendations for PAPR reduction and Predistortion combination: High PAPR reduction gain and minimum drawbacks Effective Predistortion designed taking into account PAPR reduction (maximum linearity) Input Back-Off (IBO) of the PA equal to the signal’s PAPR (maximum efficiency) Adaptive Predistortion can also be considered. 19/24
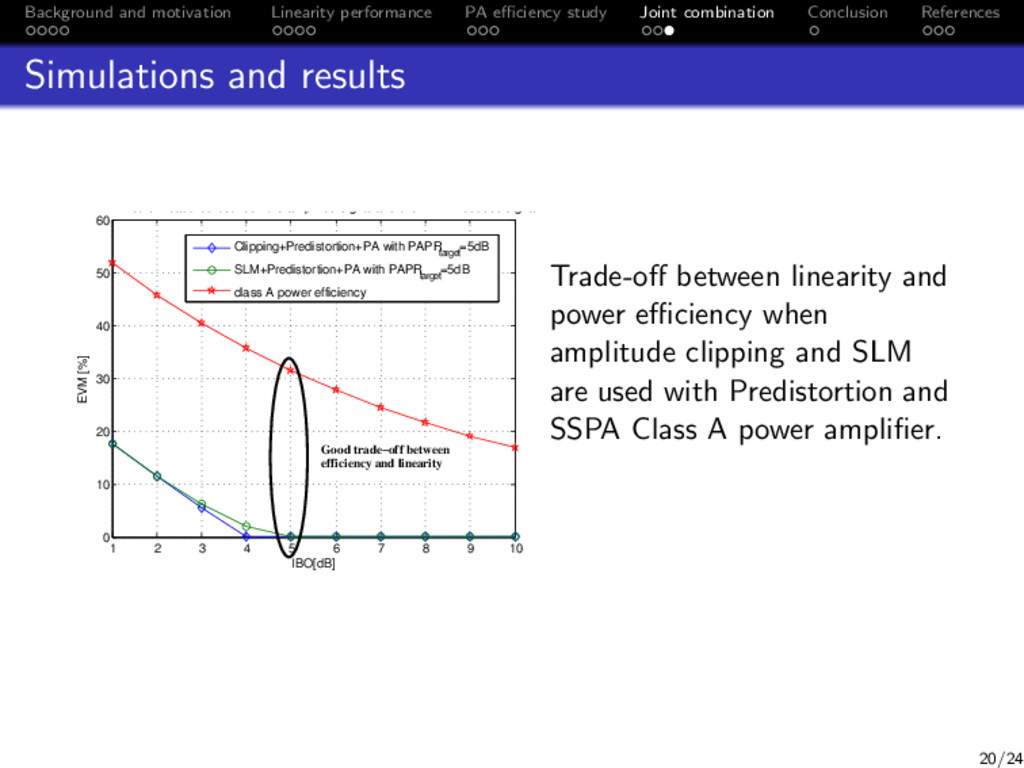
Conclusion References Simulations and results 1 2 3 4 5 6 7 8 9 10 0 10 20 30 40 50 60 IBO[dB] EVM [%] EVM metric measured between the amplified signal and the PAPR reduced signal Clipping+Predistortion+PA with PAPR target =5dB SLM+Predistortion+PA with PAPR target =5dB class A power efficiency Good trade−off between efficiency and linearity Trade-off between linearity and power efficiency when amplitude clipping and SLM are used with Predistortion and SSPA Class A power amplifier. 20/24
Conclusion References Simulations and results Recap The main goal of our trade-off analysis is to ensure good linearity with reasonable efficiency. Relationship between EVM and PA efficiency. Optimal combination of PAPR reduction and Predistortion. 20/24
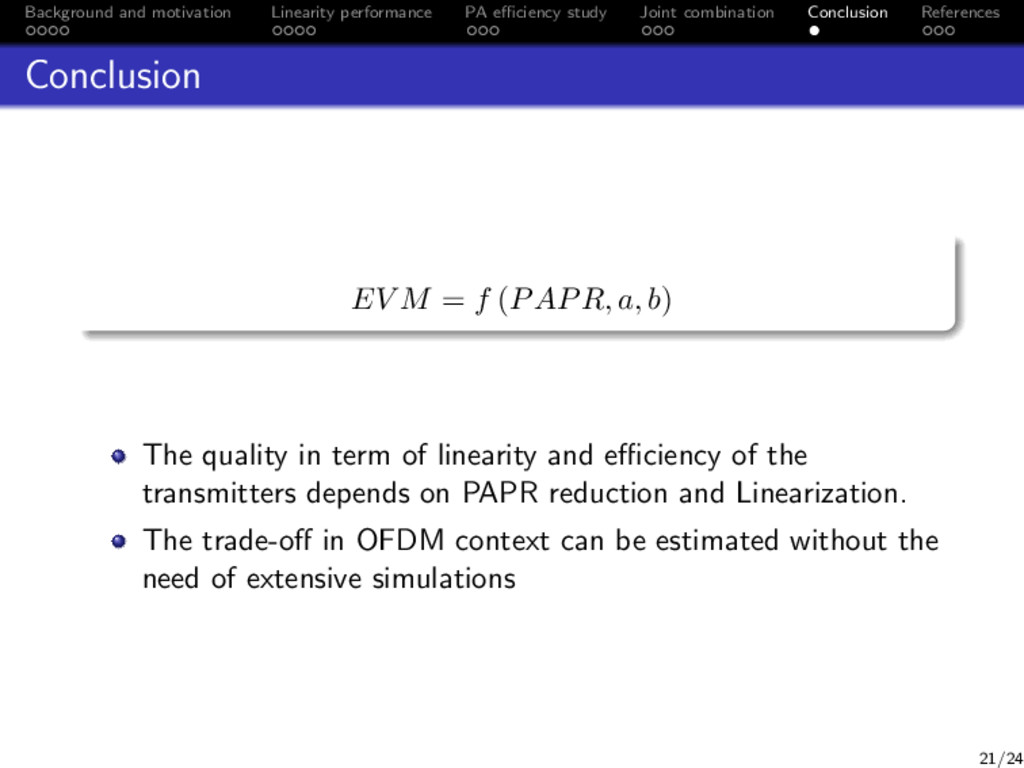
Conclusion References Conclusion EV M = f (PAPR, a, b) The quality in term of linearity and efficiency of the transmitters depends on PAPR reduction and Linearization. The trade-off in OFDM context can be estimated without the need of extensive simulations 21/24
Conclusion References References I [1] O. A. Gouba and Y. Louet “Predistortion Performance considering Peak to Average Power Ratio Reduction in OFDM context”, in IEEE WCNC 2012, Paris, France, Apr. 2012. [2] C. Langlais, S. Haddad, Y. Louet and N. Mazouz “Clipping noise mitigation with the capacity approaching FEC codes for PAPR reduction of OFDM signals”, in MC-SS 2011, Herrshing, Germany, May 2011. [3] P. Banelli, G. Leus, and G. B. Giannakis, “Bayesian Estimation of Clipped Gaussian Processes with Application to OFDM”, in Proc. EUSIPCO, vol.1, pp.181-184, Sep. 2002. 22/24
Conclusion References References II [4] O. A. Gouba and Y. Louet “Theoretical analysis of the trade-off between efficiency and linearity of the High Power Amplifier in OFDM context”, in European Wireless 2012, Poznan, Poland, Apr. 2012. [5] D. Wulich, “Definition of efficient PAPR in OFDM”, IEEE Com. Letters, vol. 9, n. 9, p. 832 - 834, sept. 2005. [6] O. A. Gouba and Y. Lou¨ et, “Joint study PAPR reduction and HPA predistortion”, URSI GASS 2011, Istanbul, Turkey, Aug. 2011. 23/24