Upgrade to Pro — share decks privately, control downloads, hide ads and more …

Stokes - New Dimensions in Monitoring Patterns of Urban Change

Stokes - New Dimensions in Monitoring Patterns of Urban Change

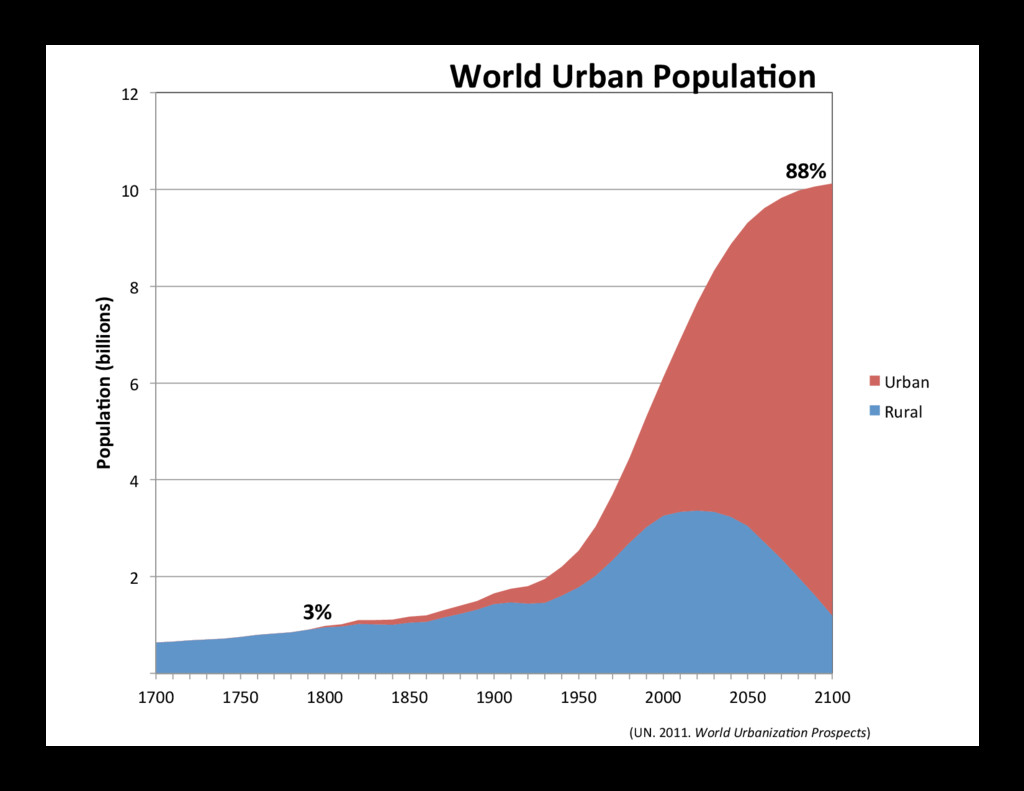
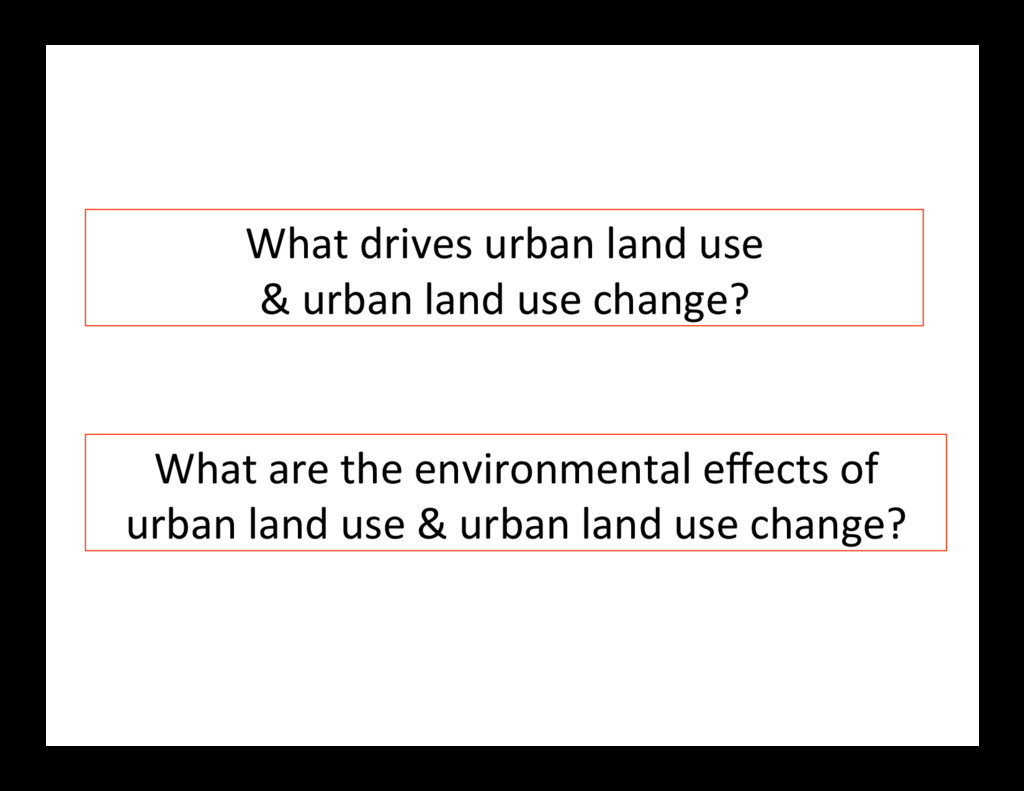
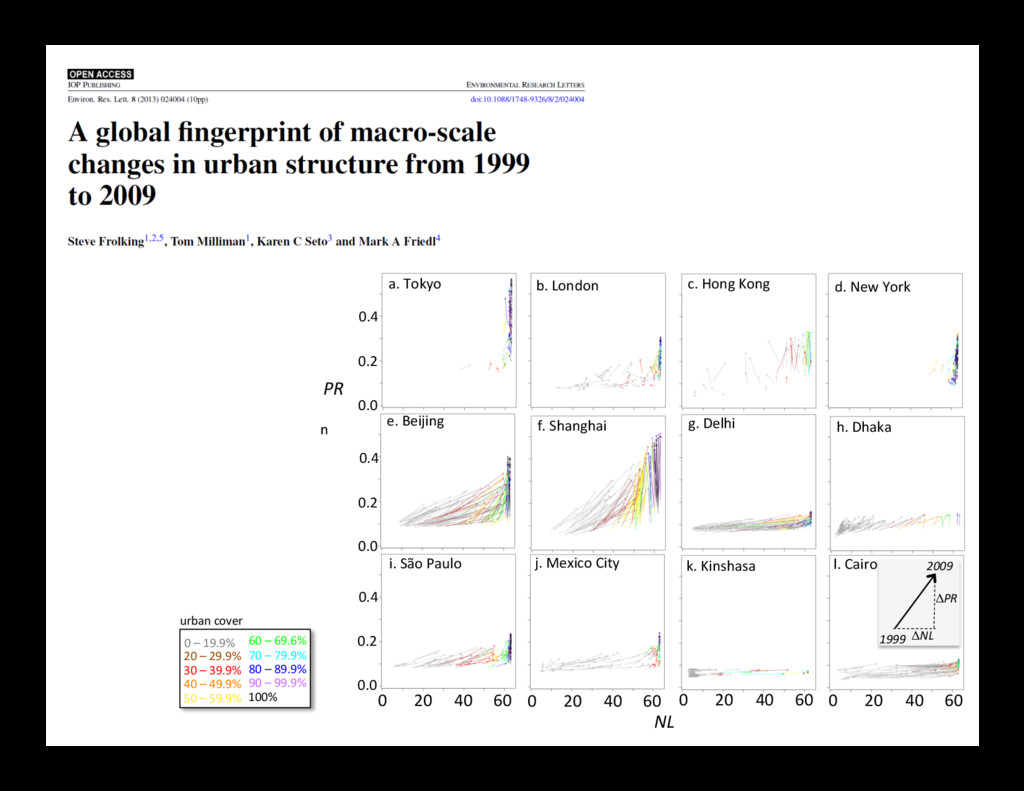
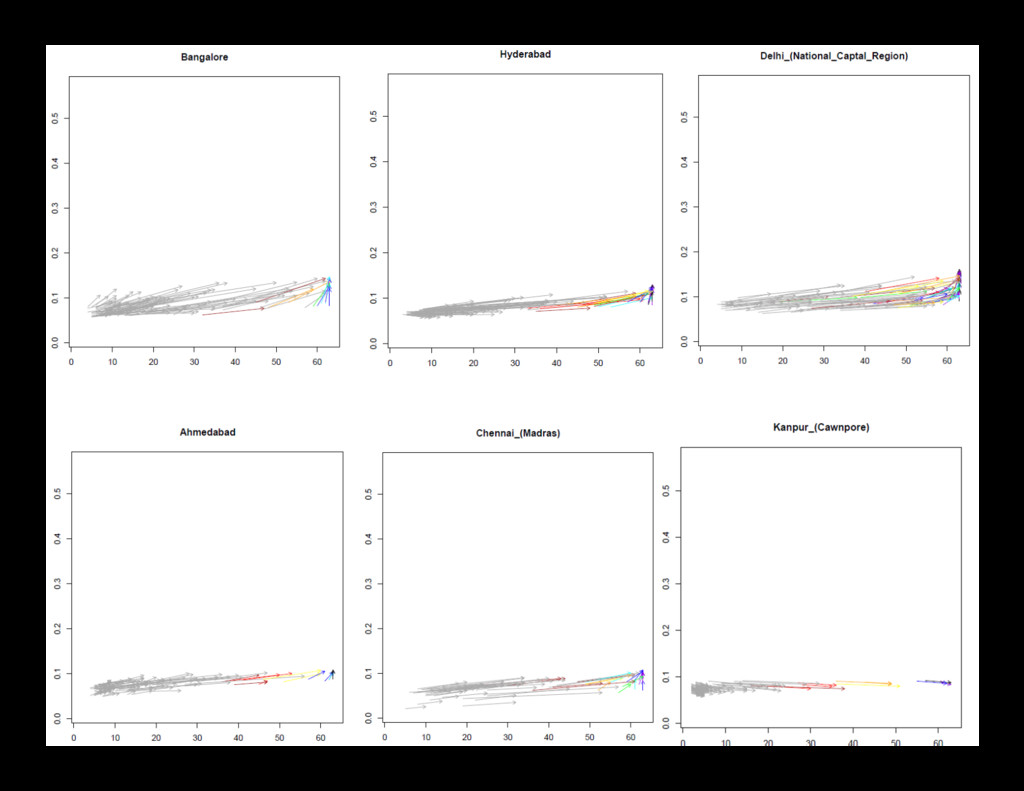
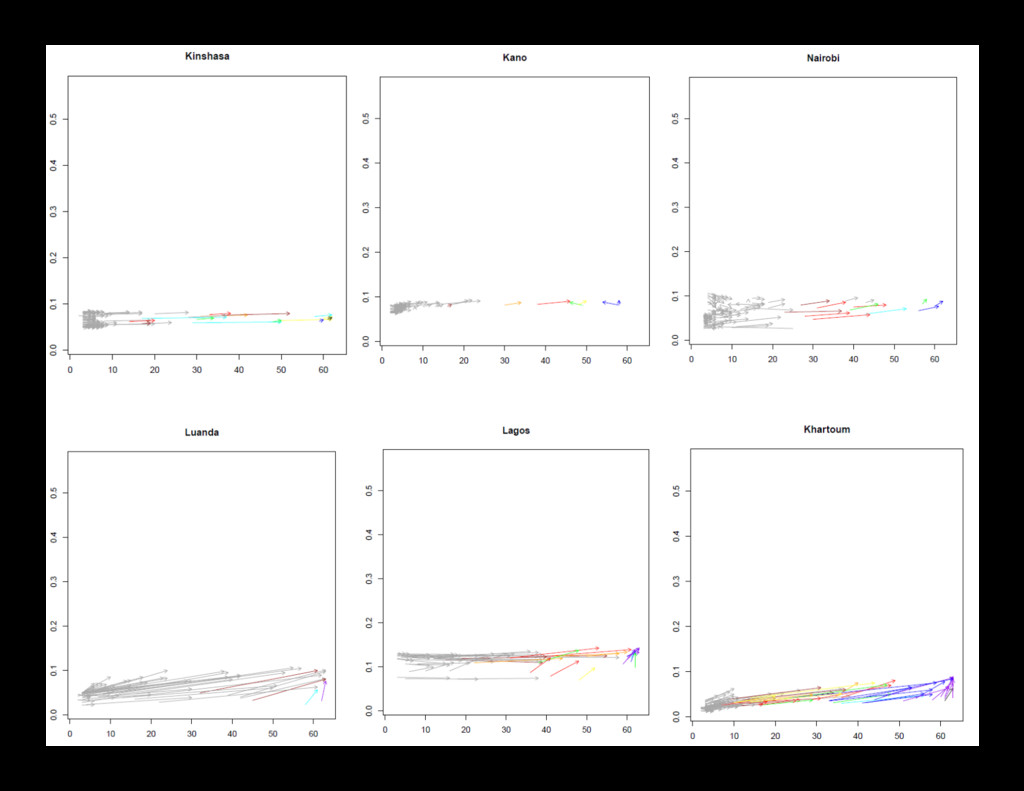
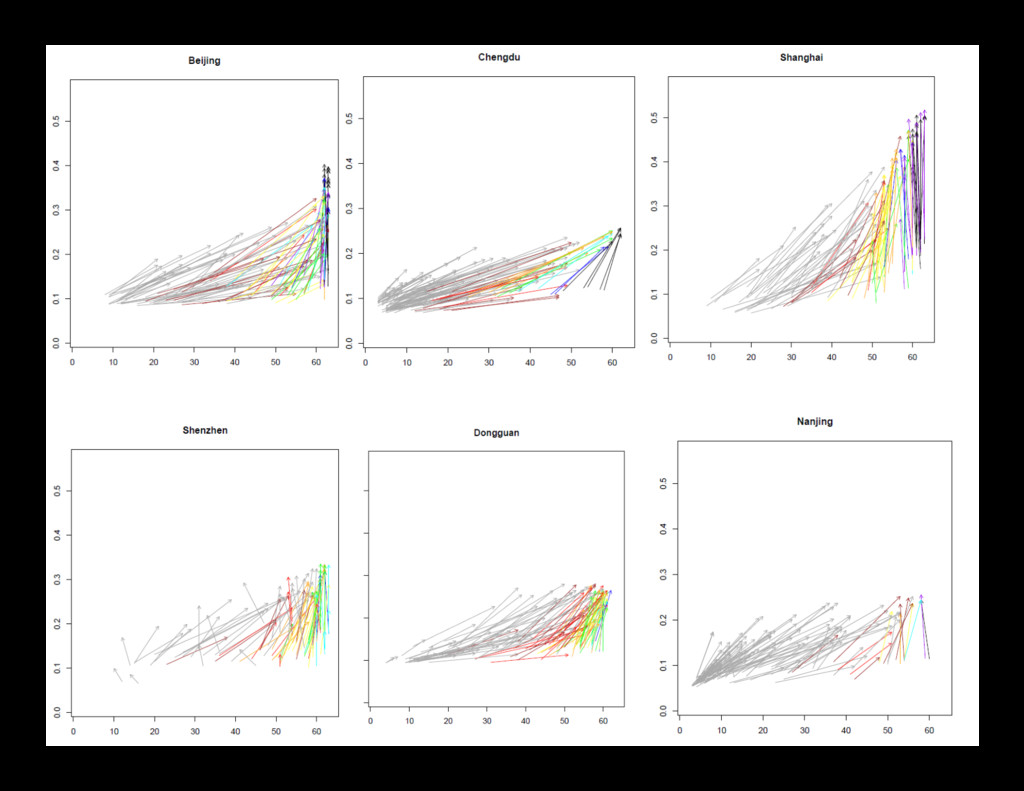
In the last 50 years, global urban populations have increased by 3 billion, and an additional 2.5 billion urban residents are expected by 2050. Critical to predicting the impact of urbanization on environmental and development outcomes, is to understand how urban areas are changing. Land use science has significantly added to our knowledge of urban expansion and its
impact on non-urban landscapes, such as agriculture and forests. However, to understand how urbanization will effect emissions and vulnerability, change within urban areas must be monitored.
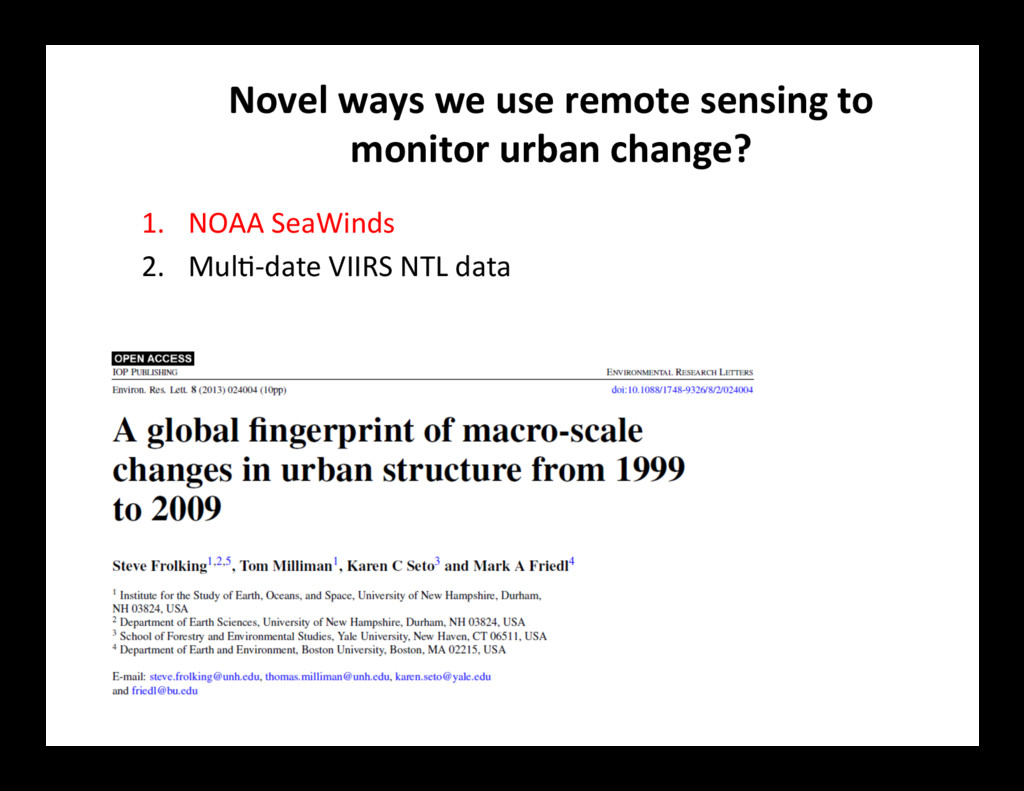
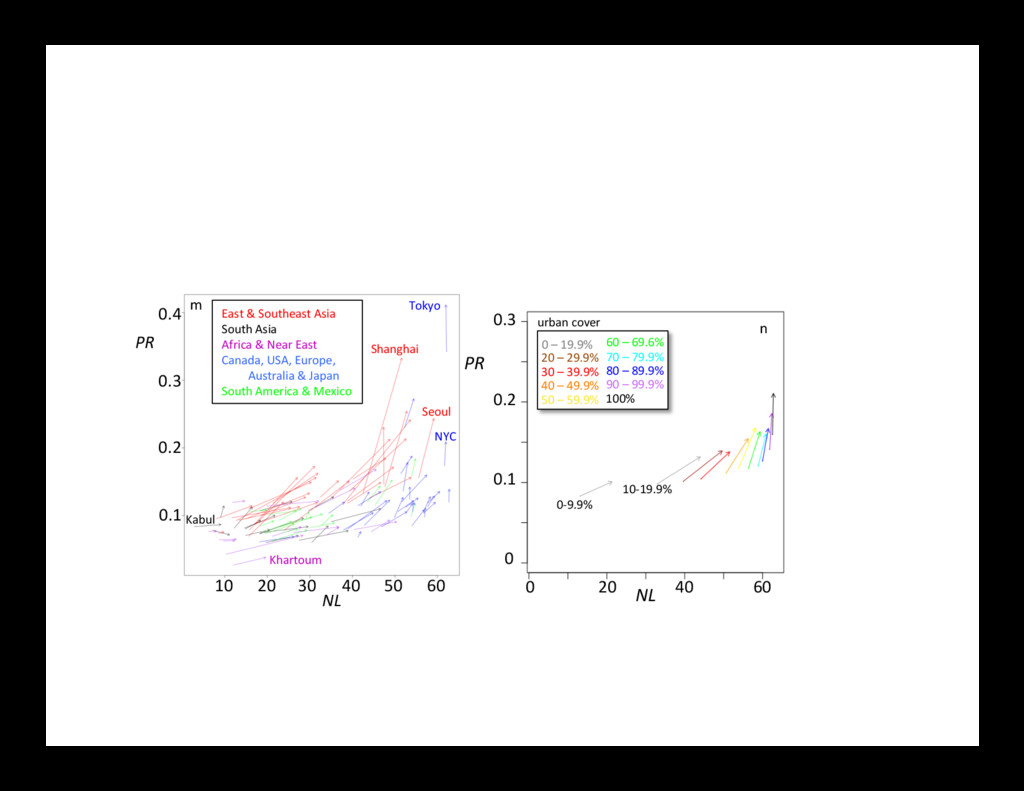
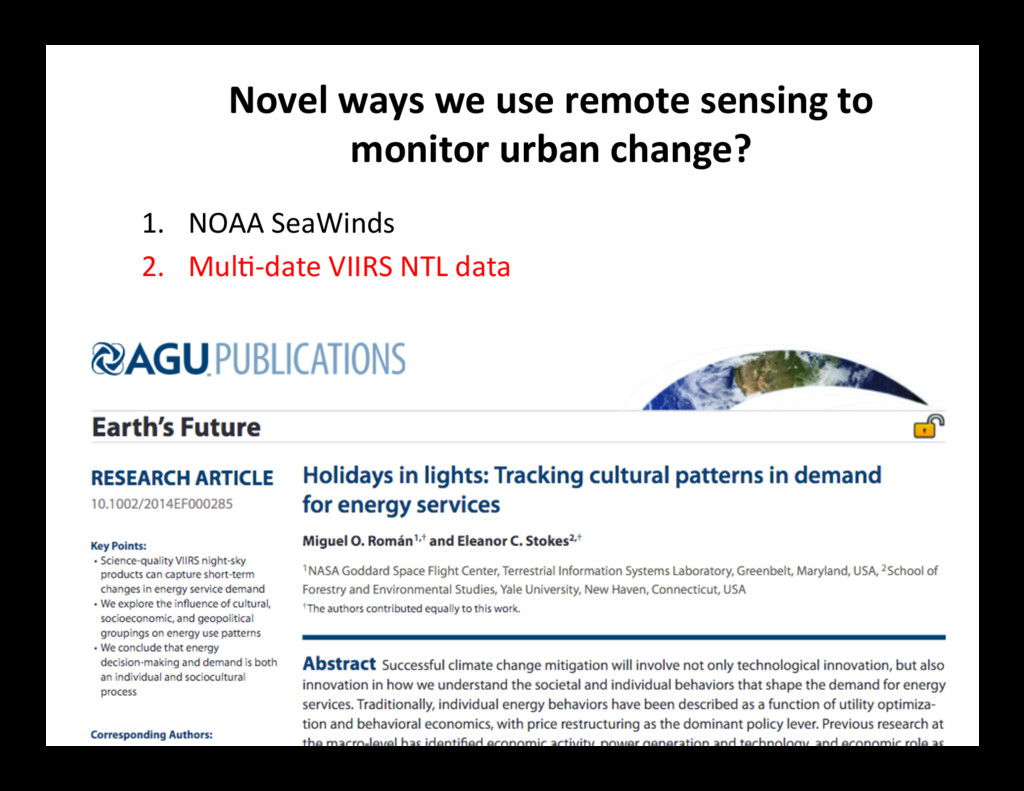
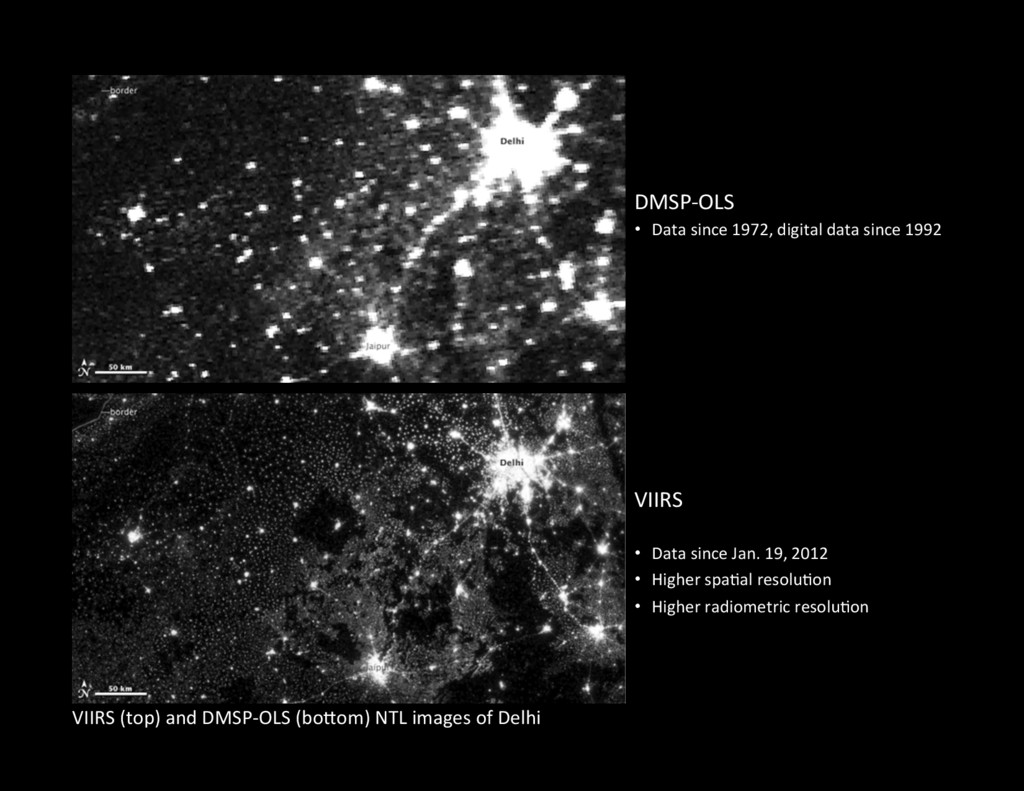
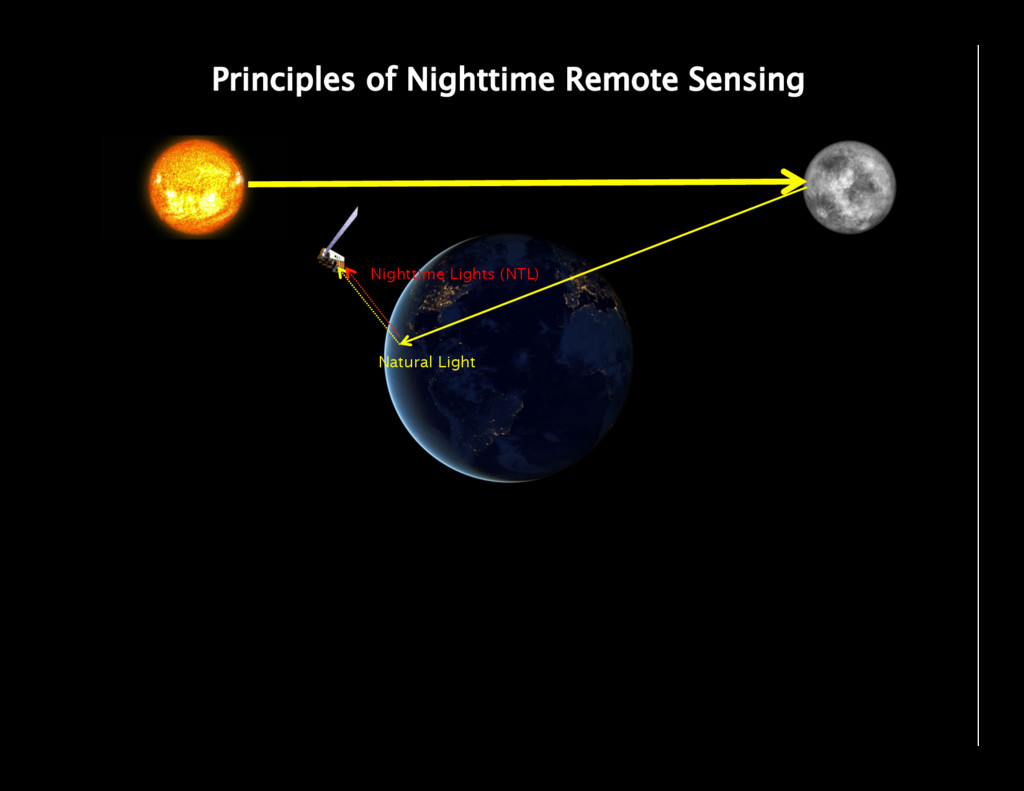
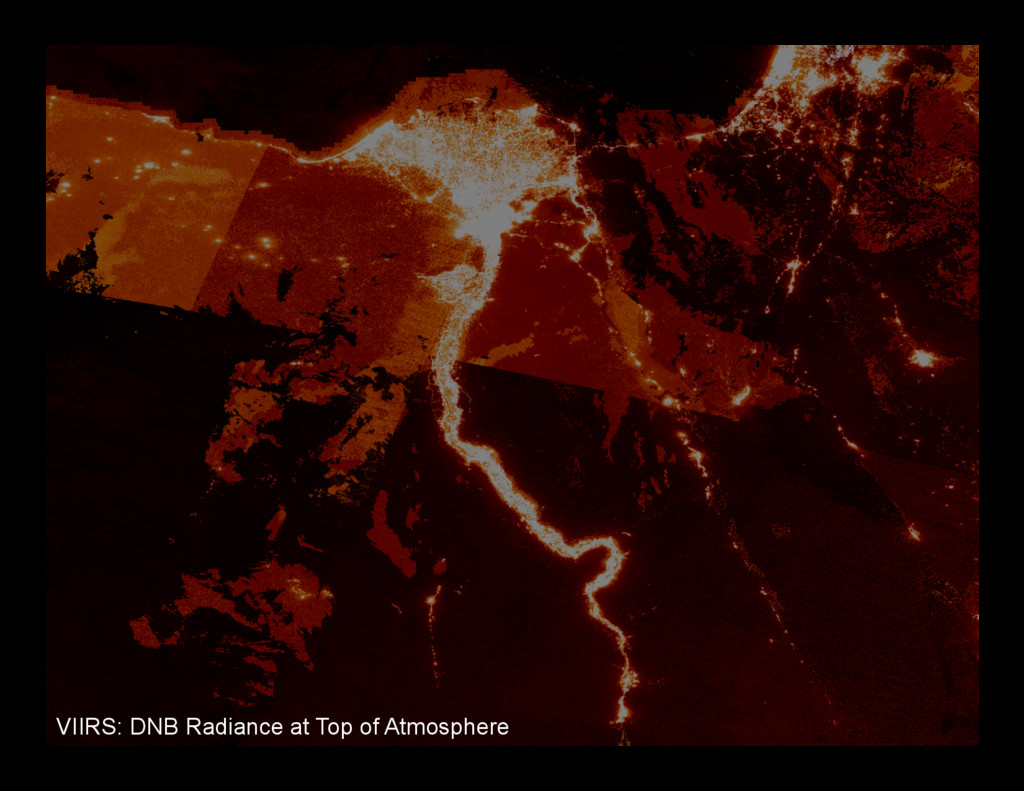
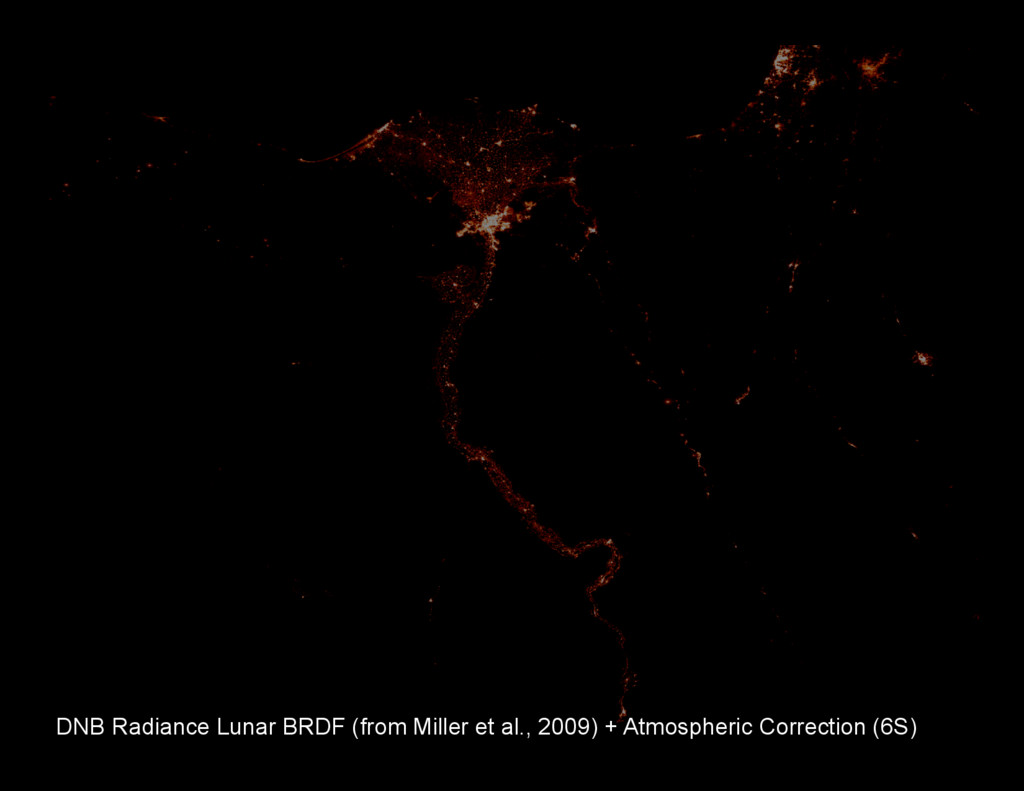
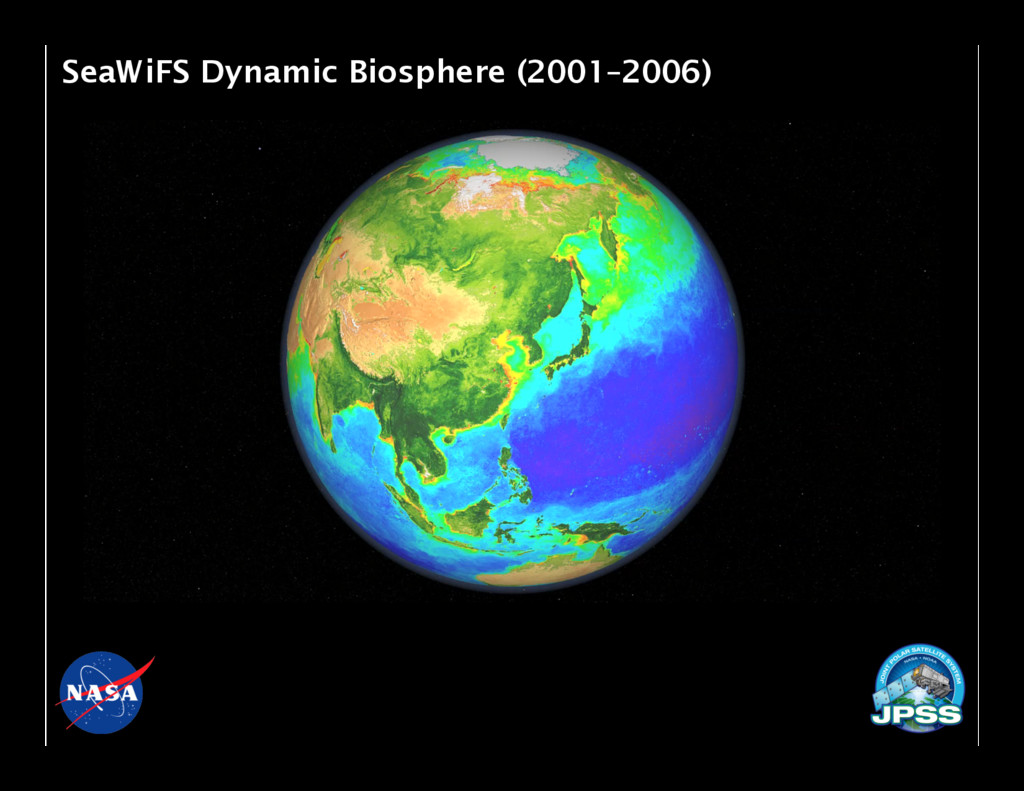
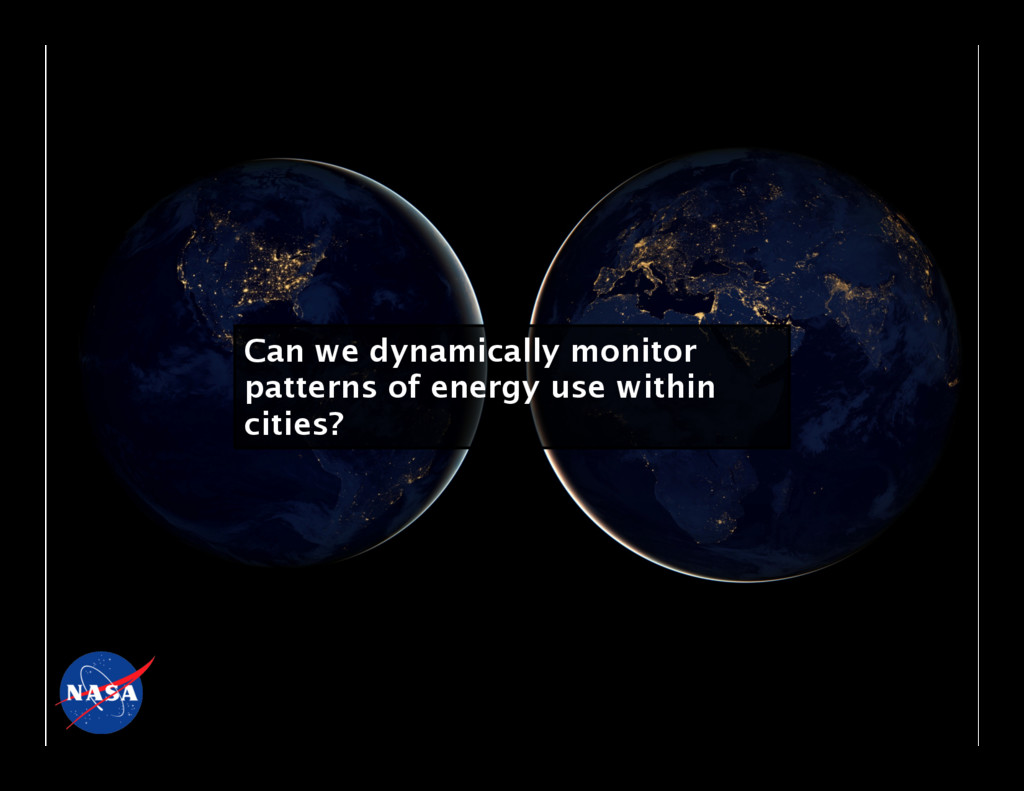
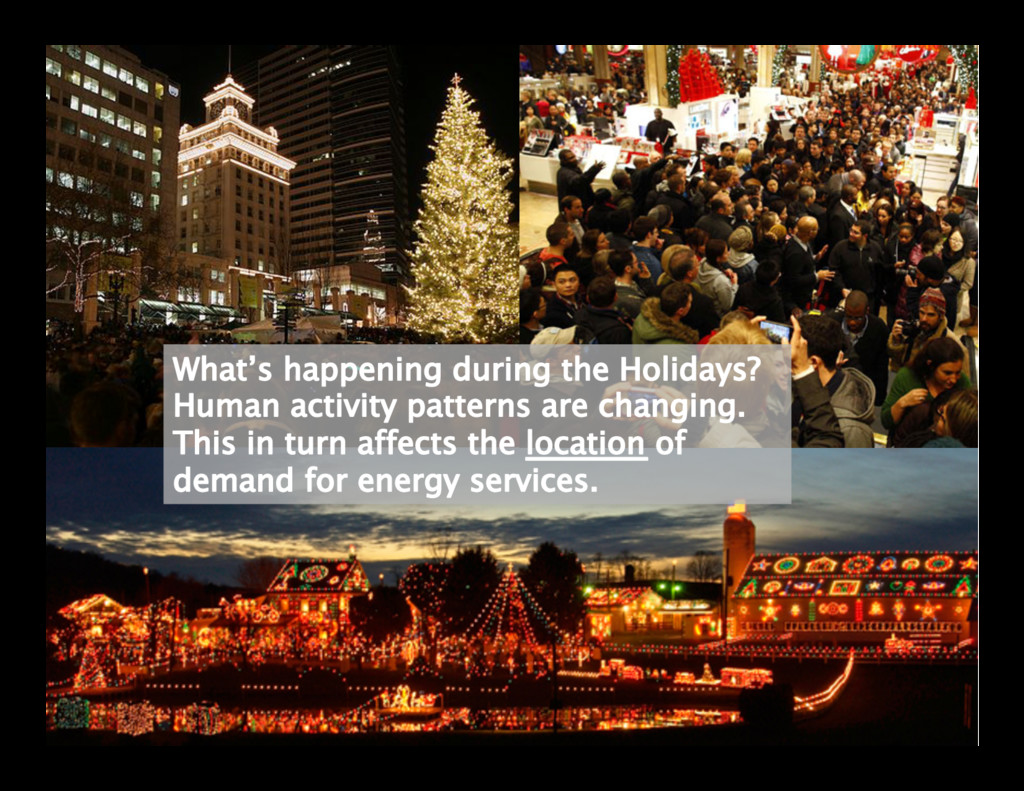
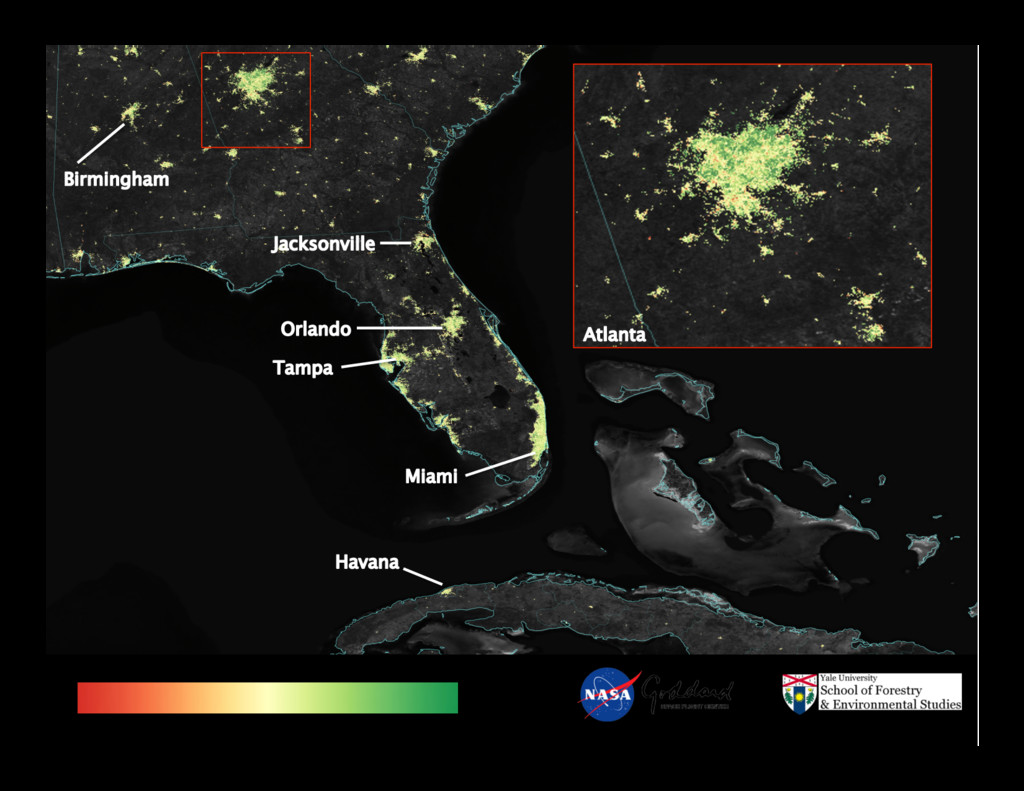
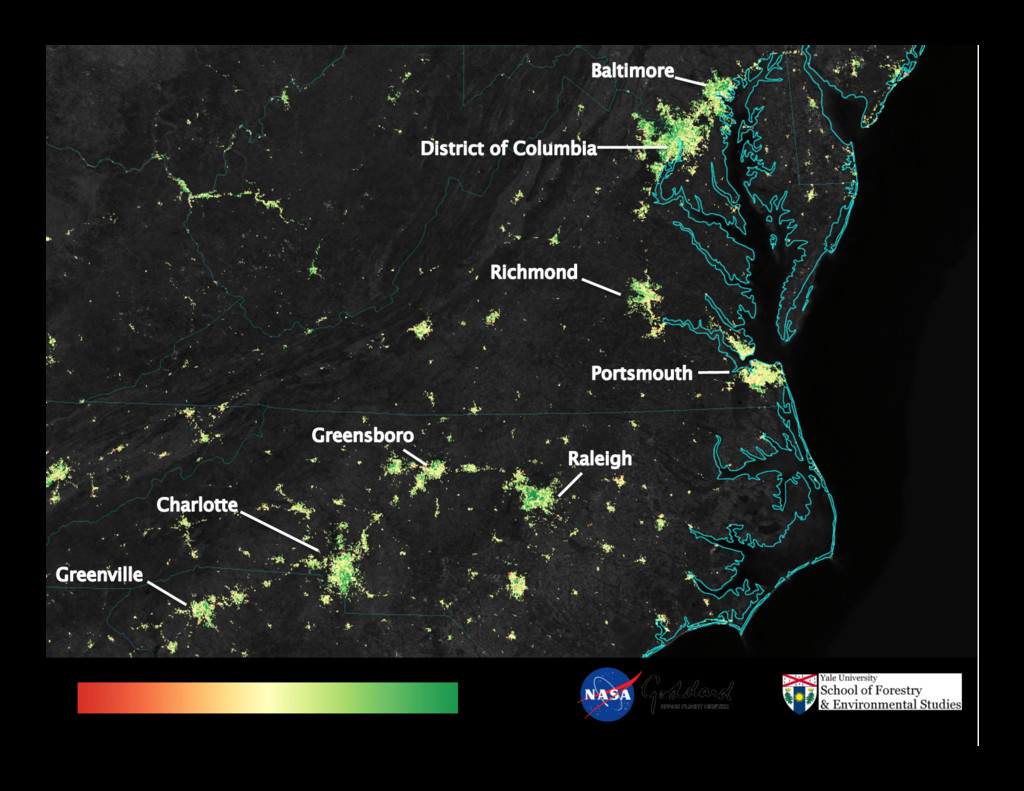
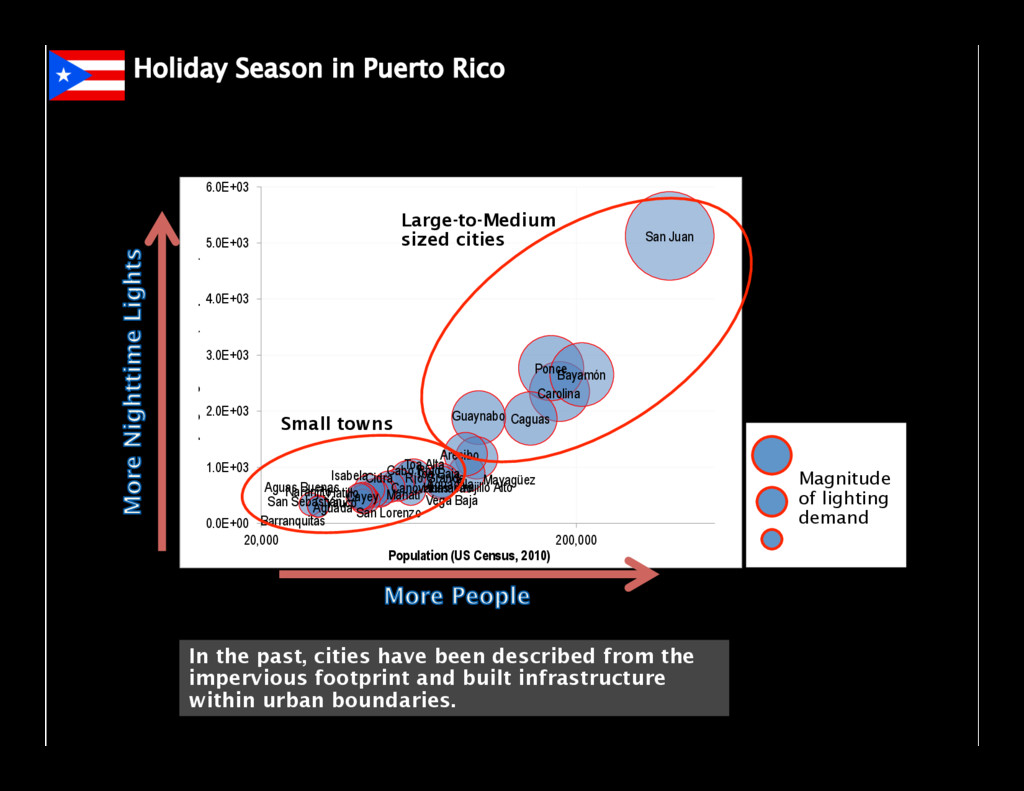
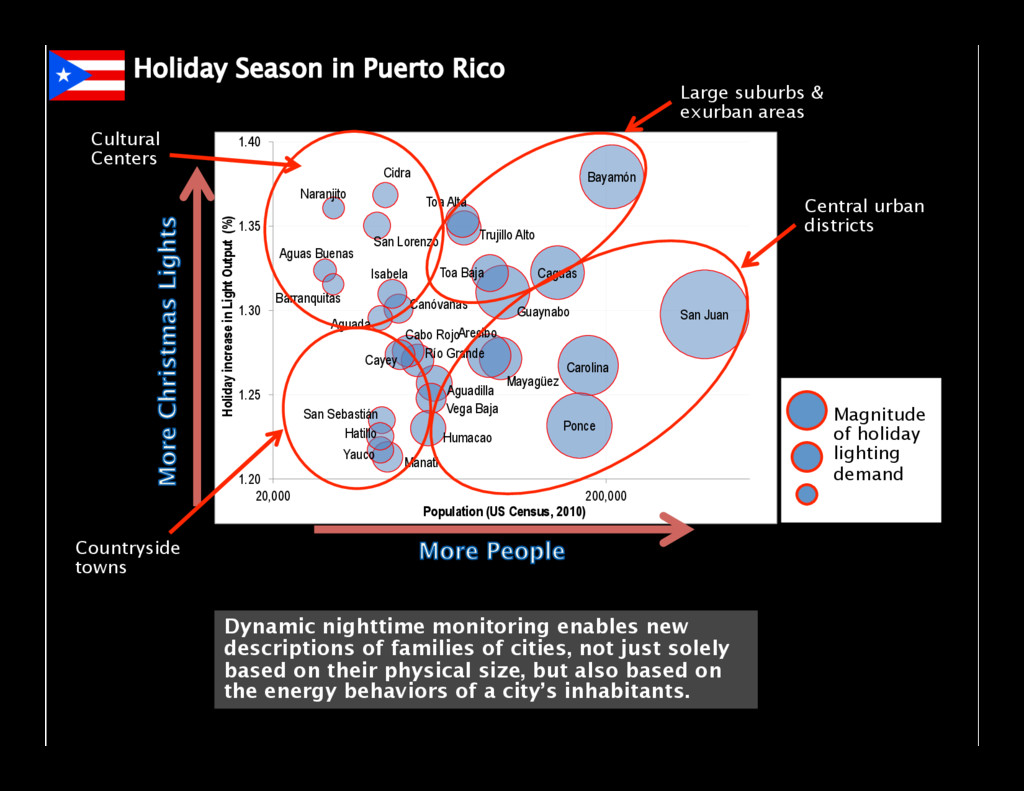
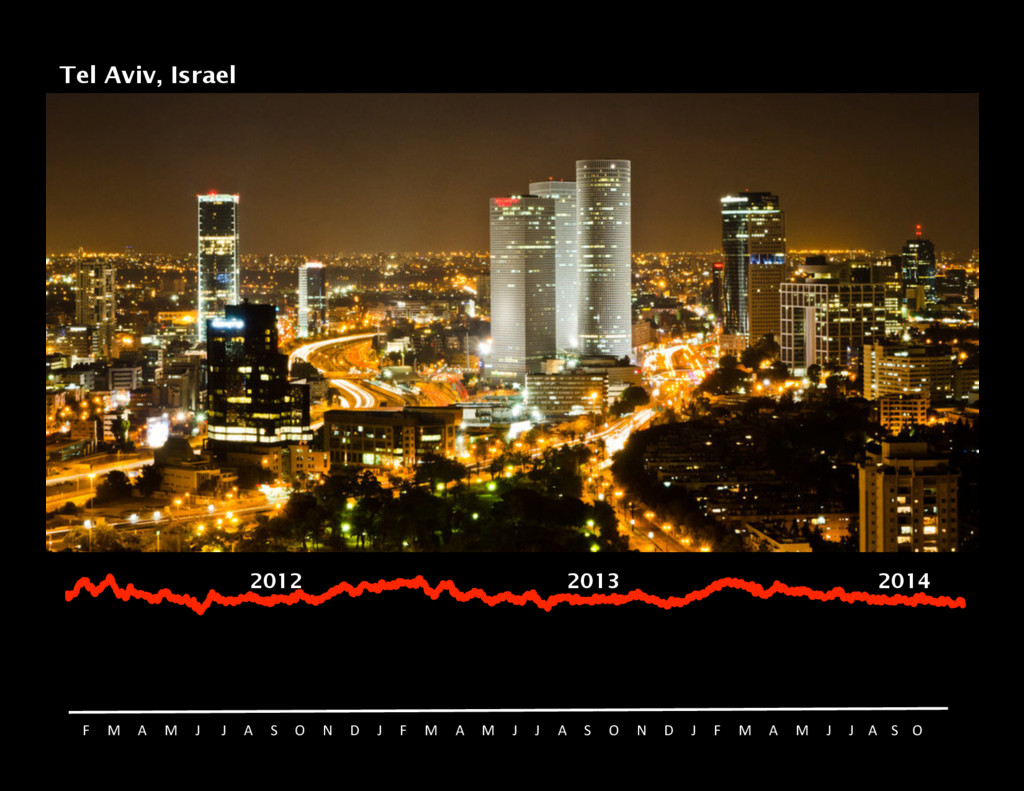
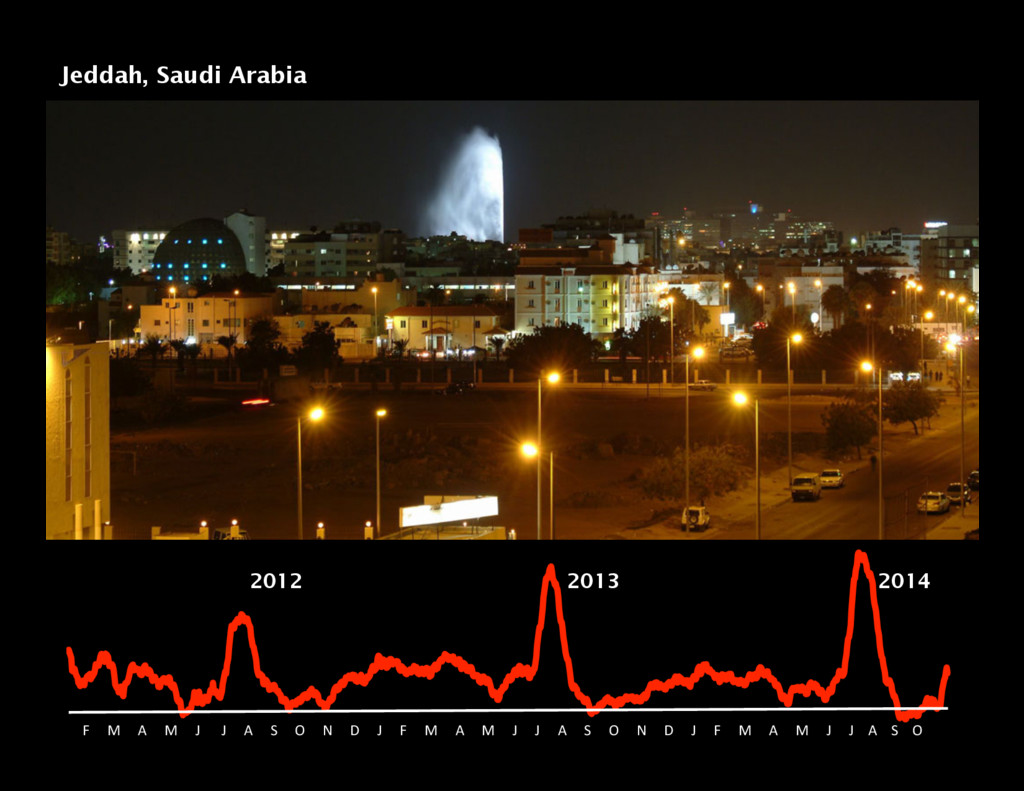
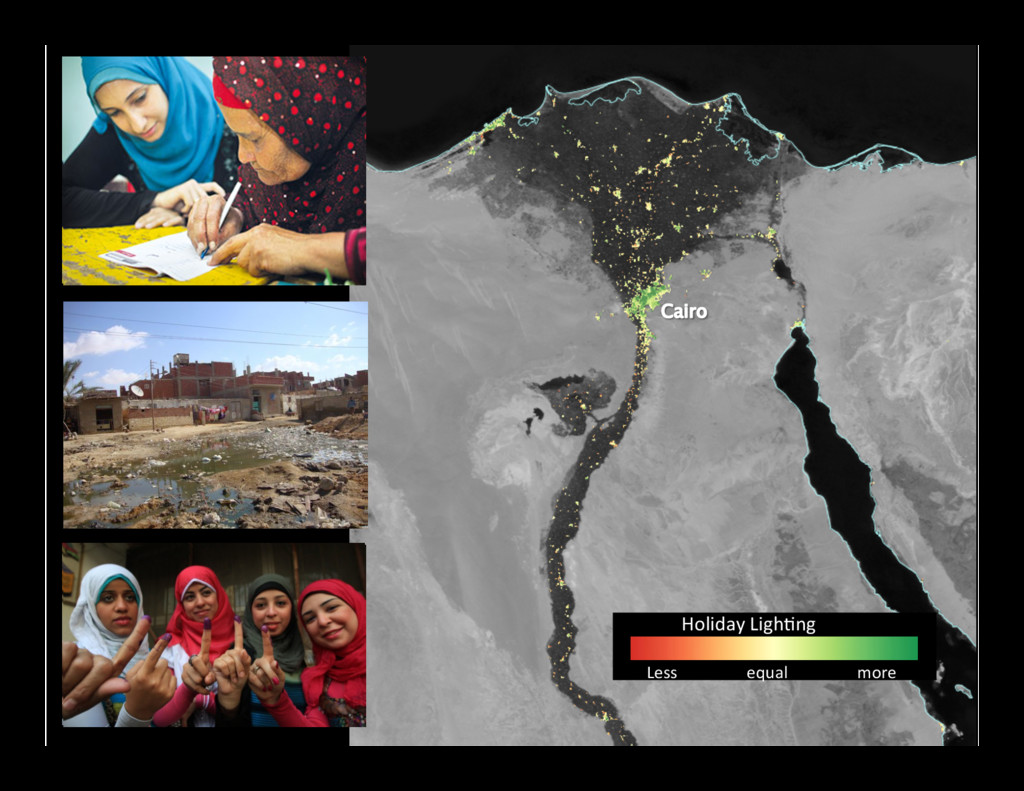
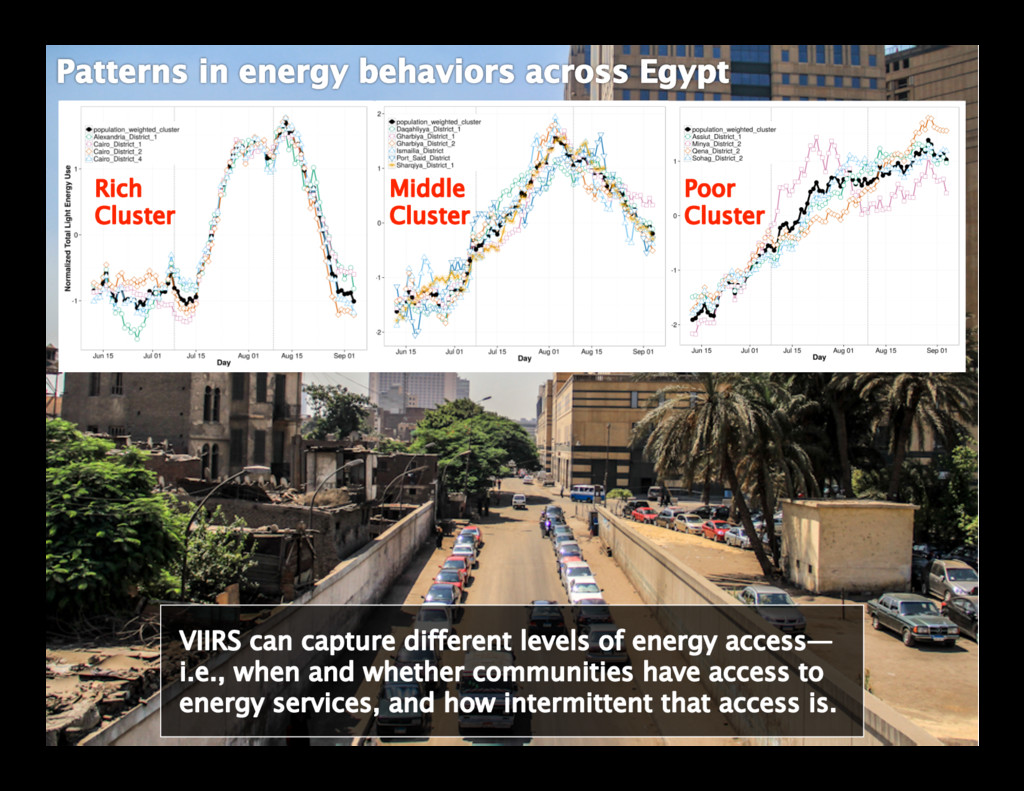
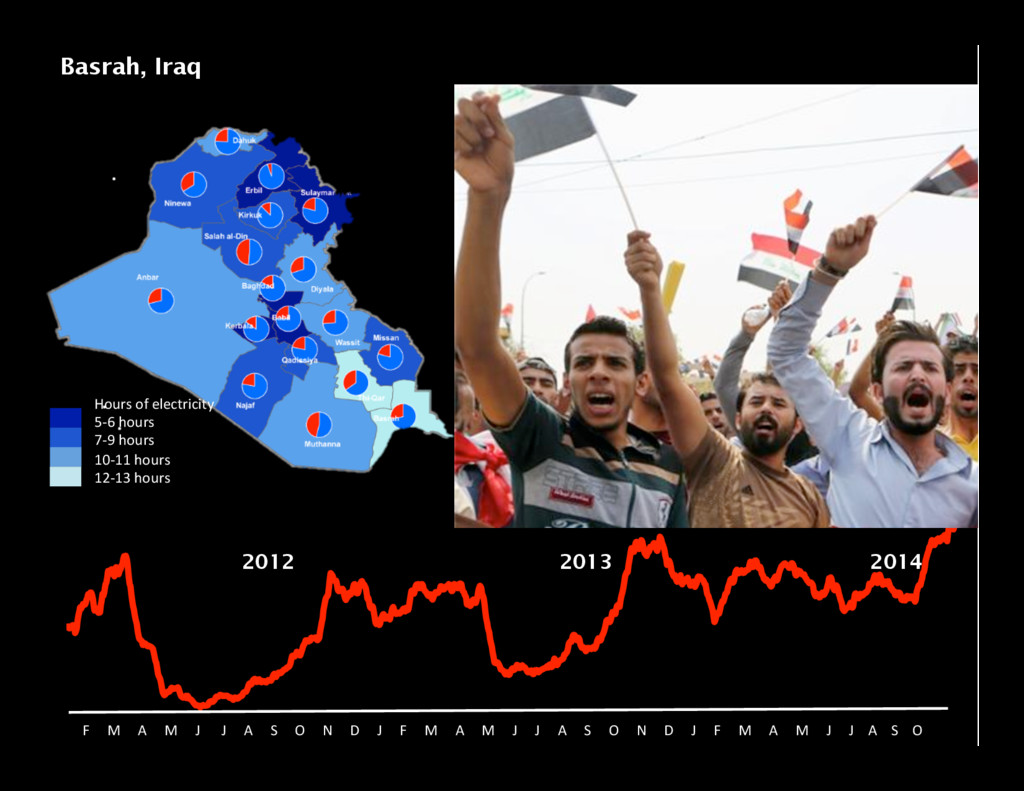
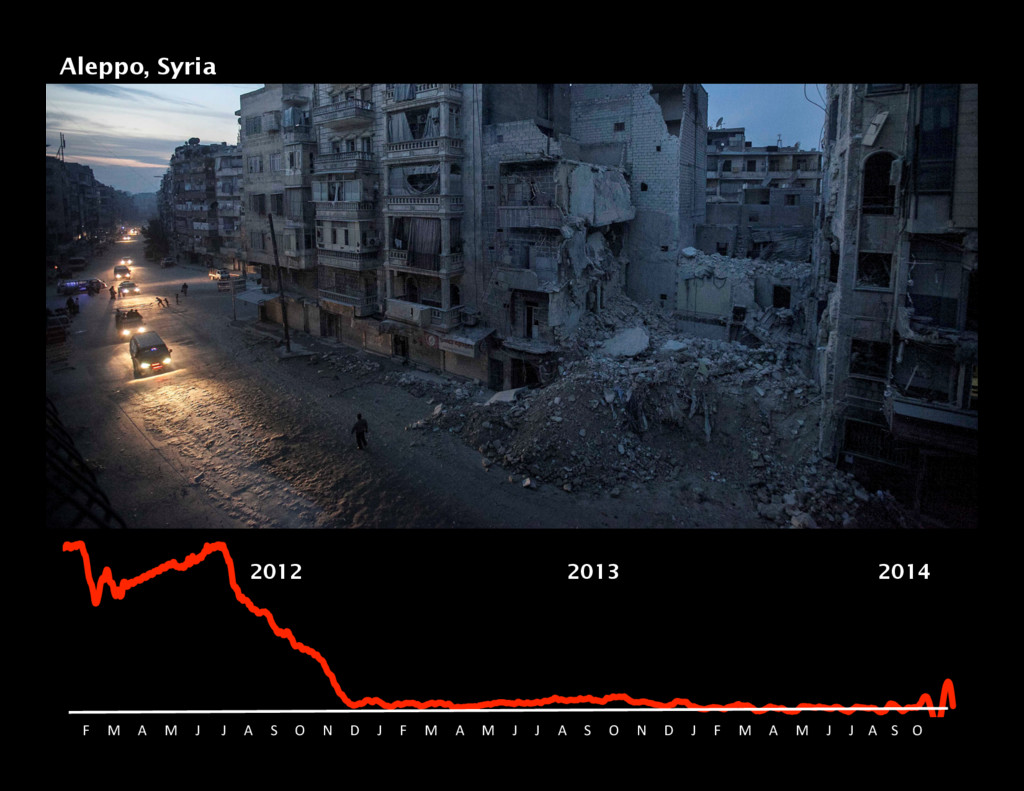
In this talk, we discuss the potential of new spatio-temporal remote-sensing data to describe the dynamics of the built environments, energy infrastructure, and activities within urban areas. Applying novel satellite sensors and techniques such as SeaWinds, DMSP-OLS, and Suomi-NPP VIIRS, we present two recent analyses that characterize long-term and short-term patterns of urban change in developing countries. We discuss how these analyses add to our knowledge of the social, political, and cultural activities that shape energy consumption and vulnerability.

SecondaryCities

June 15, 2016
Tweet

More Decks by SecondaryCities

Other Decks in Technology

Transcript

  1. Secondary Ci-es Symposium: June 15, 2016 New Dimensions in Monitoring

    PaAerns of Urban Change Eleanor C. Stokes PhD Candidate School of Forestry & Environmental Studies Yale University
  2. — 2 4 6 8 10 12 1700 1750 1800

    1850 1900 1950 2000 2050 2100 Popula2on (billions) Urban Rural 3% 88% (UN. 2011. World Urbaniza-on Prospects) World Urban Popula2on
  3. What drives urban land use & urban land use change?

    What are the environmental effects of urban land use & urban land use change?
  4. Urban land cover/use classes Aerial photography, IKONOS, LANDSAT, SPOT, SAR

    (Benediktsson et al, 2005; Plamason et al., 2005; van der Linden et al., 2007; Herold et al., 2004; Heiden et al., 2007; Roessner et al., 2001; Barr and Barnsley, 1997; Mesev, 2010; Hasse and Lathrop, 2003) MAPS (Weng, 2012)
  5. Urban Extent IKONOS, LANDSAT, SPOT, SAR, DMSP-OLS (Bowden and Brooner,

    1970; Schneider et al., 2009; Potere et al., 2009; Burchfield et al., 2006; Mallick and Rahman, 2012; Grey and Luckman, 2003; Imhoff et al., 1997; Gober and Burns, 2002; SuAon et al., 2006; Elvidge et al., 2004; Li et al., 2013)
  6. Novel ways we use remote sensing to monitor urban change?

    1.  NOAA SeaWinds 2.  Mul--date VIIRS NTL data
  7. How do scaAerometers work? •  Designed to measure winds over

    ocean •  Can also be used for land and ice studies •  Ac-ve remote sensing: transmits pulses of microwave energy and measures the returned echo. •  Energy in returned echo depends on electrical proper-es and roughness of the surface. •  Over land: return echo is func-on of land cover.
  8. b. London e. Beijing PR h. Dhaka c. Hong Kong

    f. Shanghai k. Kinshasa a. Tokyo 0 20 40 60 0 20 40 60 0.4 0.2 0.0 d. New York 0.4 0.2 0.0 0.4 0.2 0.0 i. São Paulo g. Delhi j. Mexico City l. Cairo ΔPR ΔNL 1999 2009 NL 0 20 40 60 0 20 40 60 urban cover 0 – 19.9% 20 – 29.9% 30 – 39.9% 40 – 49.9% 50 – 59.9% 70 – 79.9% 60 – 69.6% 90 – 99.9% 80 – 89.9% 100% n
  9. 0 20 40 60 NL PR 0 0.1 0.2 0.3

    urban cover 0 – 19.9% 20 – 29.9% 30 – 39.9% 40 – 49.9% 50 – 59.9% 70 – 79.9% 60 – 69.6% 90 – 99.9% 80 – 89.9% 100% 0-9.9% 10-19.9% East & Southeast Asia South Asia Africa & Near East Canada, USA, Europe, Australia & Japan South America & Mexico Tokyo Shanghai NYC Khartoum Kabul Seoul NL 10 20 30 40 50 60 0.4 0.3 0.2 0.1 PR m n
  10. Novel ways we use remote sensing to monitor urban change?

    1.  NOAA SeaWinds 2.  Mul--date VIIRS NTL data
  11. DMSP-OLS •  Data since 1972, digital data since 1992 VIIRS

    (top) and DMSP-OLS (boAom) NTL images of Delhi VIIRS •  Data since Jan. 19, 2012 •  Higher spa-al resolu-on •  Higher radiometric resolu-on
  12. Miller et al., (2013) Remote Sens. 2013, 5(12), 6717-6766; doi:10.3390/rs5126717

    VIIRS nighttime detection capabilities (a) with and (b) without lunar illumination
  13. Carolina Ponce Caguas Guaynabo Arecibo Toa Baja Mayagüez Trujillo Alto

    Toa Alta Aguadilla Vega Baja Humacao Río Grande Cabo Rojo Naranjito Cayey Canóvanas Isabela Aguas Buenas San Juan Bayamón Manatí Cidra San Sebastián Yauco Aguada Hatillo San Lorenzo Barranquitas 0.0E+00 1.0E+03 2.0E+03 3.0E+03 4.0E+03 5.0E+03 6.0E+03 20,000 200,000 Holiday Lighting Demand (MW per hour) Population (US Census, 2010) Magnitude of lighting demand Large-to-Medium sized cities Small towns In the past, cities have been described from the impervious footprint and built infrastructure within urban boundaries.
  14. Carolina Ponce Caguas Guaynabo Arecibo Toa Baja Mayagüez Trujillo Alto

    Toa Alta Aguadilla Vega Baja Humacao Río Grande Cabo Rojo Naranjito Cayey Canóvanas Isabela Aguas Buenas San Juan Bayamón Manatí Cidra San Sebastián Yauco Aguada Hatillo San Lorenzo Barranquitas 1.20 1.25 1.30 1.35 1.40 20,000 200,000 Holiday increase in Light Output (%) Population (US Census, 2010) Large suburbs & exurban areas Central urban districts Cultural Centers Magnitude of holiday lighting demand Countryside towns Dynamic nighttime monitoring enables new descriptions of families of cities, not just solely based on their physical size, but also based on the energy behaviors of a city’s inhabitants.
  15. 2012 2013 2014 Tel Aviv, Israel F M A M

    J J A S O N D J F M A M J J A S O N D J F M A M J J A S O
  16. 2012 2013 2014 Jeddah, Saudi Arabia F M A M

    J J A S O N D J F M A M J J A S O N D J F M A M J J A S O
  17. Basrah, Iraq 2012 2013 2014 F M A M J

    J A S O N D J F M A M J J A S O N D J F M A M J J A S O Hours of electricity 5-6 hours 7-9 hours 10-11 hours 12-13 hours
  18. 2012 2013 2014 Aleppo, Syria F M A M J

    J A S O N D J F M A M J J A S O N D J F M A M J J A S O
  19. Recommenda-ons for future dynamic mapping projects: 1.  Observa-on across ci-es

    2.  Fully u-lizing the -me dimension 3.  Fusing new data sets 4.  Bringing together place and process 5.  Science + policy