Upgrade to Pro
— share decks privately, control downloads, hide ads and more …
Speaker Deck
Features
Speaker Deck
PRO
Sign in
Sign up for free
Search
Search
Profiling PHP @ PHPCon Poland 2016
Search
Sebastian Grodzicki
October 01, 2016
Technology
730
1
Share
Embed
Copy iframe code
Copy JS code
Copy link
Start on current slide
Profiling PHP @ PHPCon Poland 2016
PHPCon Poland 2016
http://www.phpcon.pl/2016/pl/
Sebastian Grodzicki
October 01, 2016
More Decks by Sebastian Grodzicki
See All by Sebastian Grodzicki
Fault-tolerant workflow orchestration in PHP @ PHPCon Poland 2024
sgrodzicki
0
170
PHP w Google Cloud @ PHPCon Poland 2022
sgrodzicki
0
50
Elasticsearch + Symfony @ SymfonyLive Online Polish Edition 2021
sgrodzicki
0
190
Elasticsearch + Symfony @ WDI 2021
sgrodzicki
0
66
Combining Logs, Metrics, and Traces for Unified Observability @ Infoshare 2020
sgrodzicki
0
560
Building Distributed Systems in Distributed Teams @ Infoshare 2020
sgrodzicki
0
94
Building Distributed Systems in Distributed Teams @ 4Developers 2020
sgrodzicki
0
92
Building Distributed Systems in Distributed Teams @ DevOpsDay Warsaw 2019
sgrodzicki
0
71
Infrastructure as Code @ DevOpsDay Warsaw 2019
sgrodzicki
0
99
Other Decks in Technology
See All in Technology
データと地図で読む 大井町の「かわるもの、かわらないもの」
yoshiyama_hana
0
450
AI時代におけるエンジニアの新たな役割──FDEとクオリアの探求/登壇資料(戸井田 裕貴)
hacobu
PRO
0
550
歴史から理解するクラウドインフラのしくみ
kizawa2020
0
180
iOS/Androidの二刀流エンジニアがFlutter & TypeScriptへ越境後の現在地 - Flutterがメインになって見えた景色と現在の醍醐味 / Dual-Platform Mobile Engineer Shifts to Flutter & TypeScript - The View and Real Thrill of Going Flutter-First
bitkey
PRO
0
110
論語・武士道・産業革命から見る かわるもの、かわらないもの
ichimichi
8
1.3k
WEBフロントエンド研修【MIXI 26新卒技術研修】
mixi_engineers
PRO
1
470
Webの技術とガジェットで子どもも大人も楽しめるワクワク体験を提供する / Qiita Tech Festa Day 2026
you
PRO
1
300
AIとハーネスで育てるトランスコンパイラ / 20260722 Yasushi Katayama
shift_evolve
PRO
4
1k
BigQuery を検索ソースとした AI Agent の作り方って 〇〇 通りあんねん
satohjohn
0
120
コンテナ・K8s研修【MIXI 26新卒技術研修】
mixi_engineers
PRO
1
390
人とエージェントが高め合う協業設計
kintotechdev
0
1k
Jitera Company Deck
jitera
0
610
Featured
See All Featured
Skip the Path - Find Your Career Trail
mkilby
1
170
Tell your own story through comics
letsgokoyo
1
1k
[SF Ruby Conf 2025] Rails X
palkan
2
1.2k
Improving Core Web Vitals using Speculation Rules API
sergeychernyshev
21
1.6k
Conquering PDFs: document understanding beyond plain text
inesmontani
PRO
4
2.9k
[Rails World 2023 - Day 1 Closing Keynote] - The Magic of Rails
eileencodes
38
2.9k
Practical Tips for Bootstrapping Information Extraction Pipelines
honnibal
25
2k
XXLCSS - How to scale CSS and keep your sanity
sugarenia
249
1.3M
Hiding What from Whom? A Critical Review of the History of Programming languages for Music
tomoyanonymous
3
1k
How to train your dragon (web standard)
notwaldorf
97
6.7k
Responsive Adventures: Dirty Tricks From The Dark Corners of Front-End
smashingmag
254
22k
Why Our Code Smells
bkeepers
PRO
340
58k
Transcript
PROFILING PHP SEBASTIAN GRODZICKI
WHO USES PHP?
WHO USES PHP 7?
WHO USES PHPUNIT?
WHO USES XDEBUG?
WHO USES BLACKFIRE?
SEBASTIAN GRODZICKI CTO @ SHOWROOM
I’M NOT HIRED BY BLACKFIRE. Sebastian Grodzicki DISCLAIMER
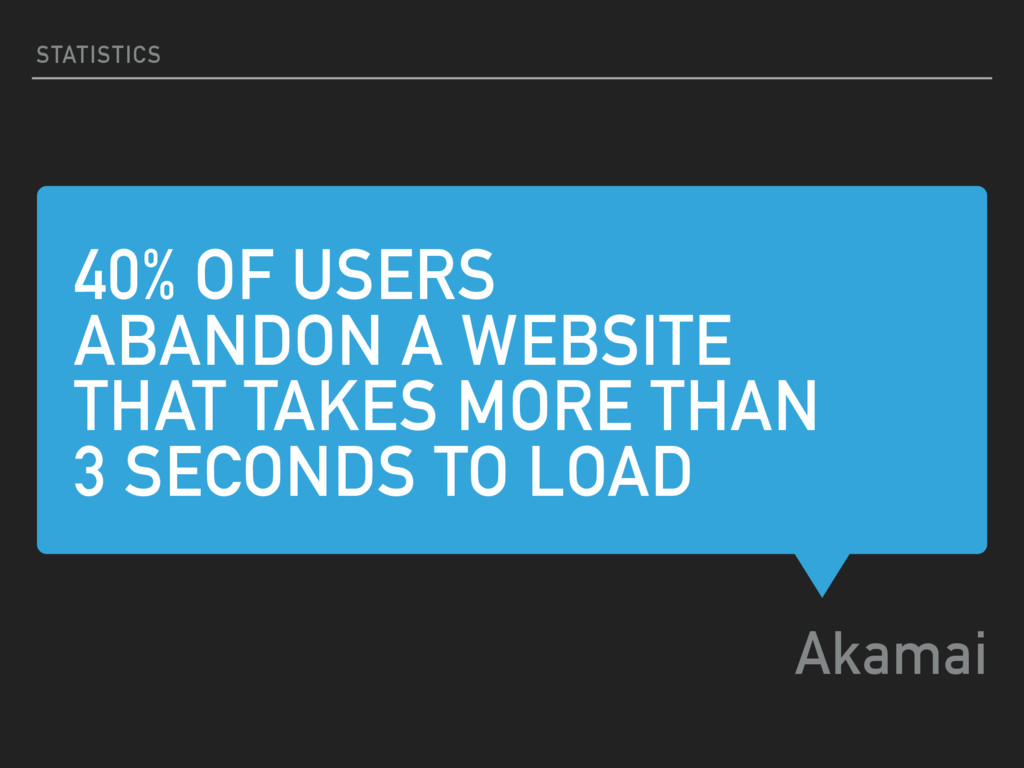
40% OF USERS ABANDON A WEBSITE THAT TAKES MORE THAN
3 SECONDS TO LOAD Akamai STATISTICS
PROFILING IS A WAY TO MEASURE WHERE A PROGRAM SPENDS
TIME MathWorks DEFINITION
MICROTIME
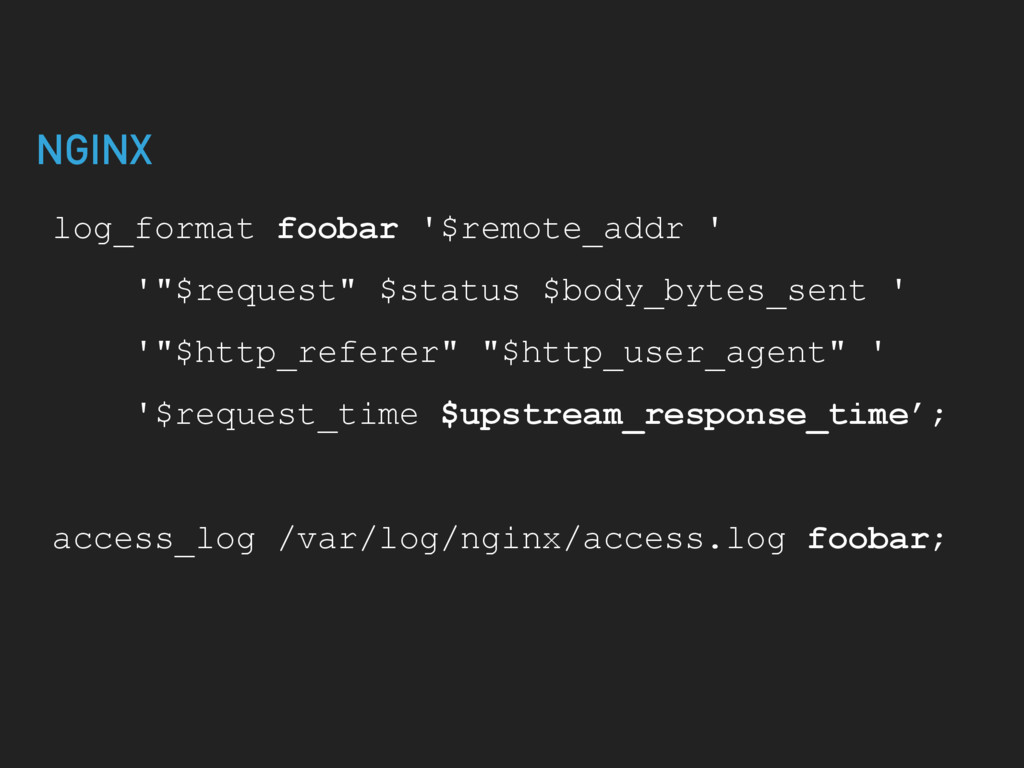
log_format foobar '$remote_addr ' '"$request" $status $body_bytes_sent ' '"$http_referer" "$http_user_agent"
' '$request_time $upstream_response_time’; access_log /var/log/nginx/access.log foobar; NGINX
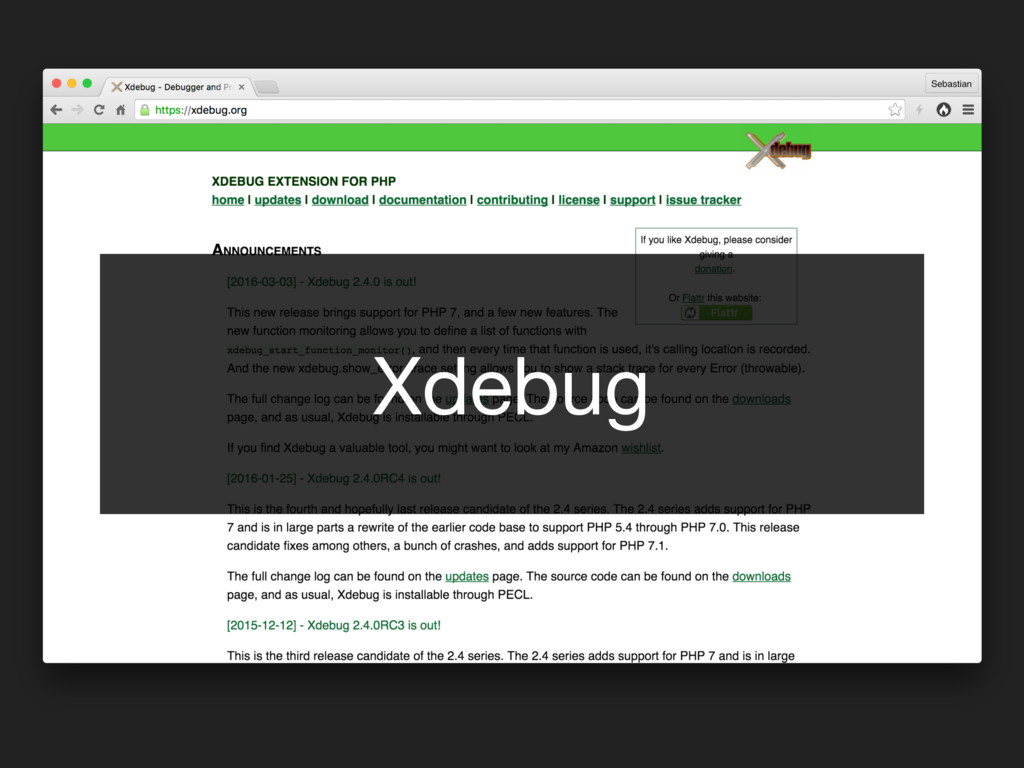
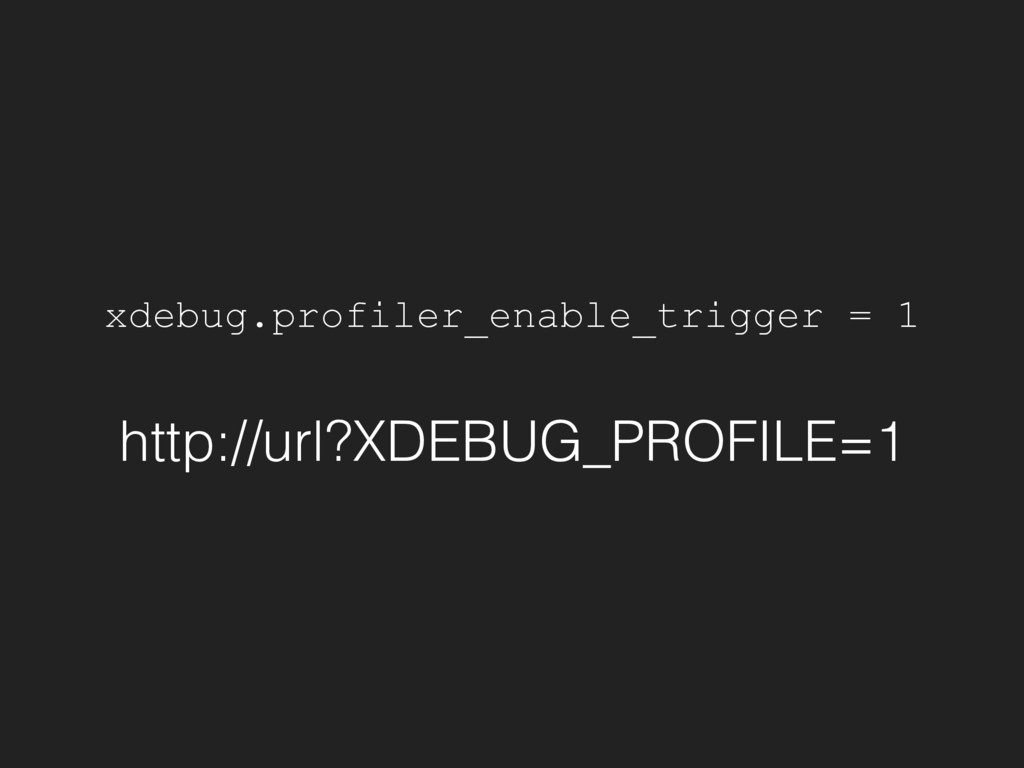
Xdebug
xdebug.profiler_enable_trigger = 1 http://url?XDEBUG_PROFILE=1
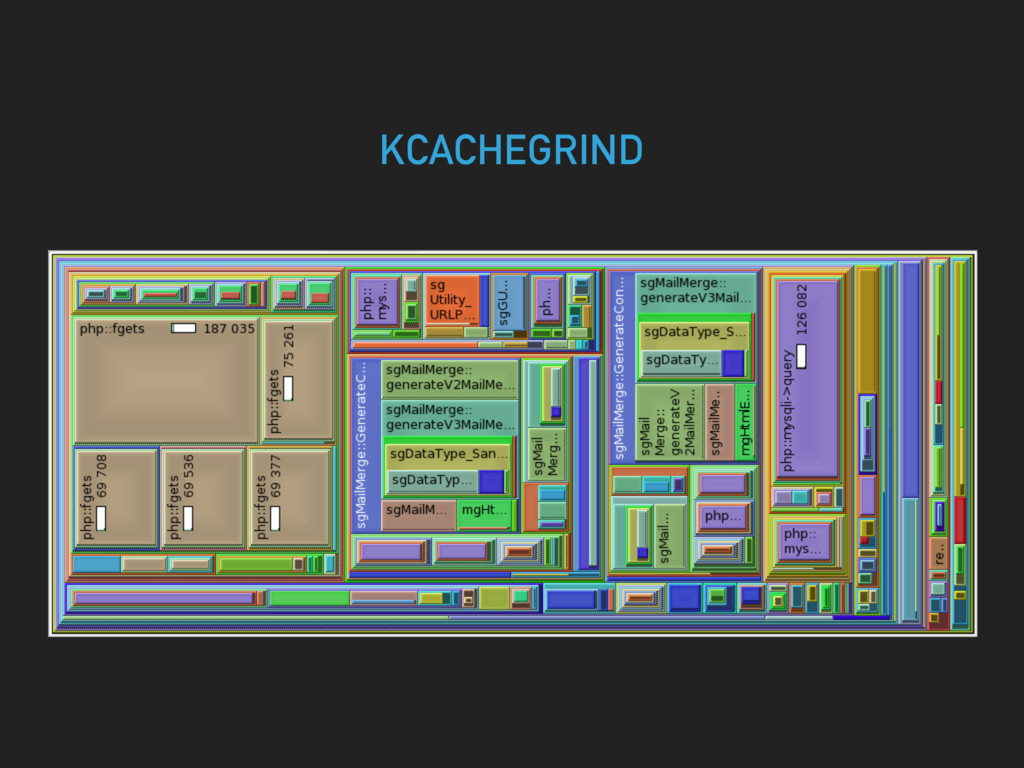
KCACHEGRIND
PROFILING PHP WEBGRIND
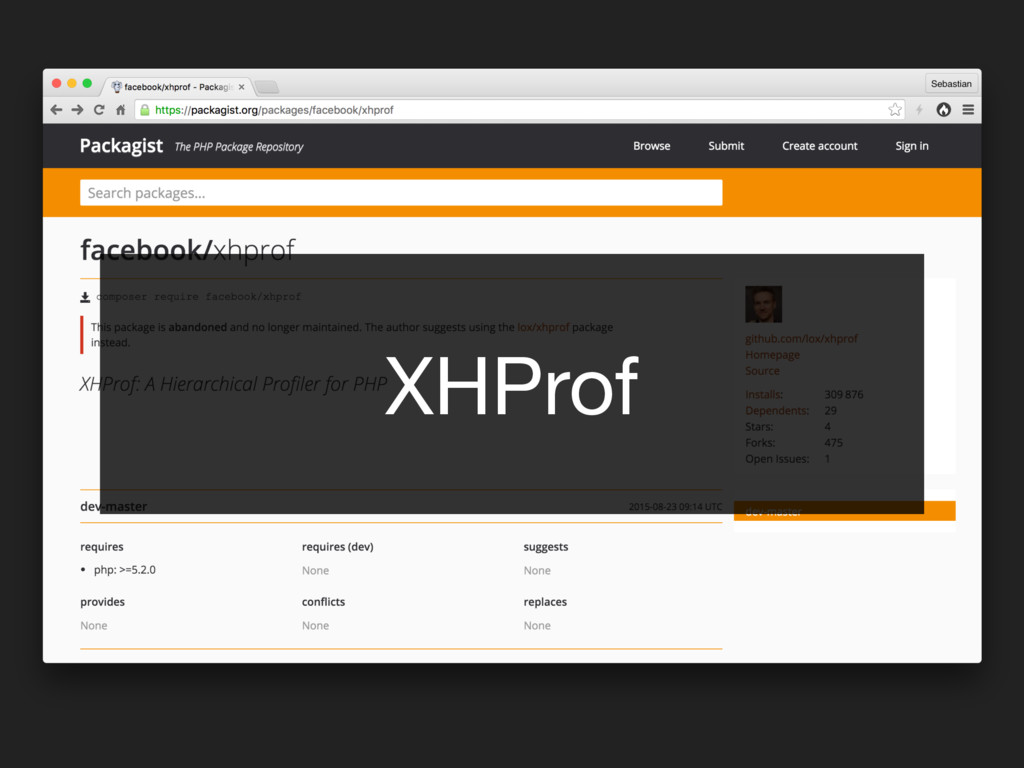
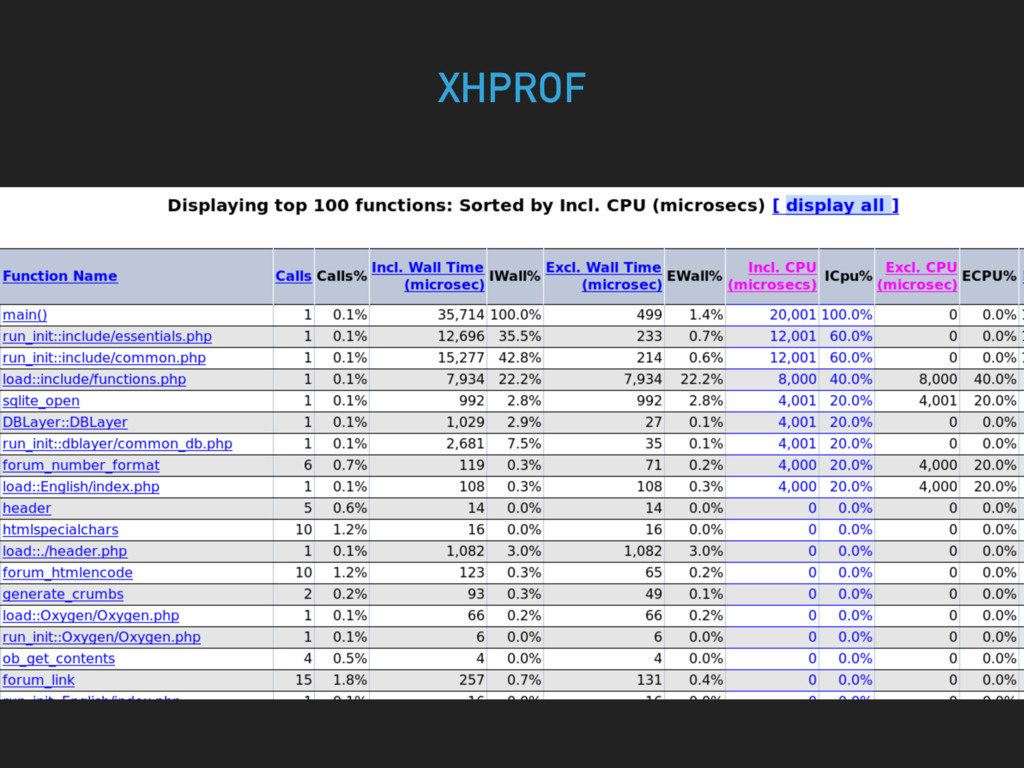
XHProf
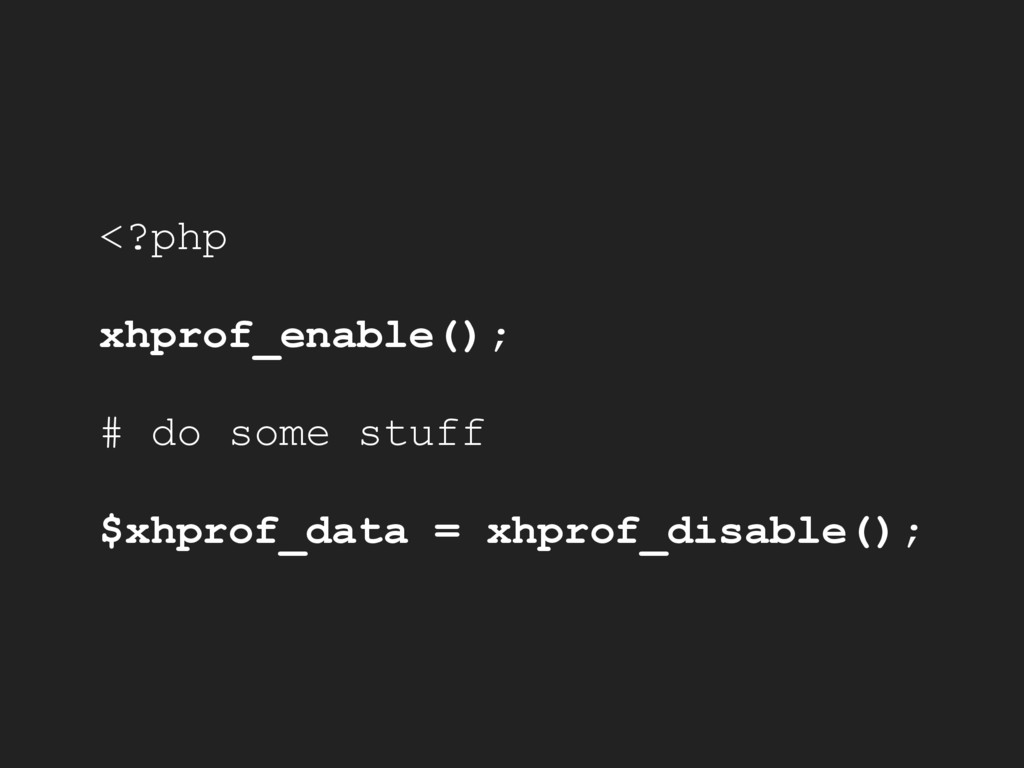
<?php xhprof_enable(); # do some stuff $xhprof_data = xhprof_disable();
XHPROF
None
None
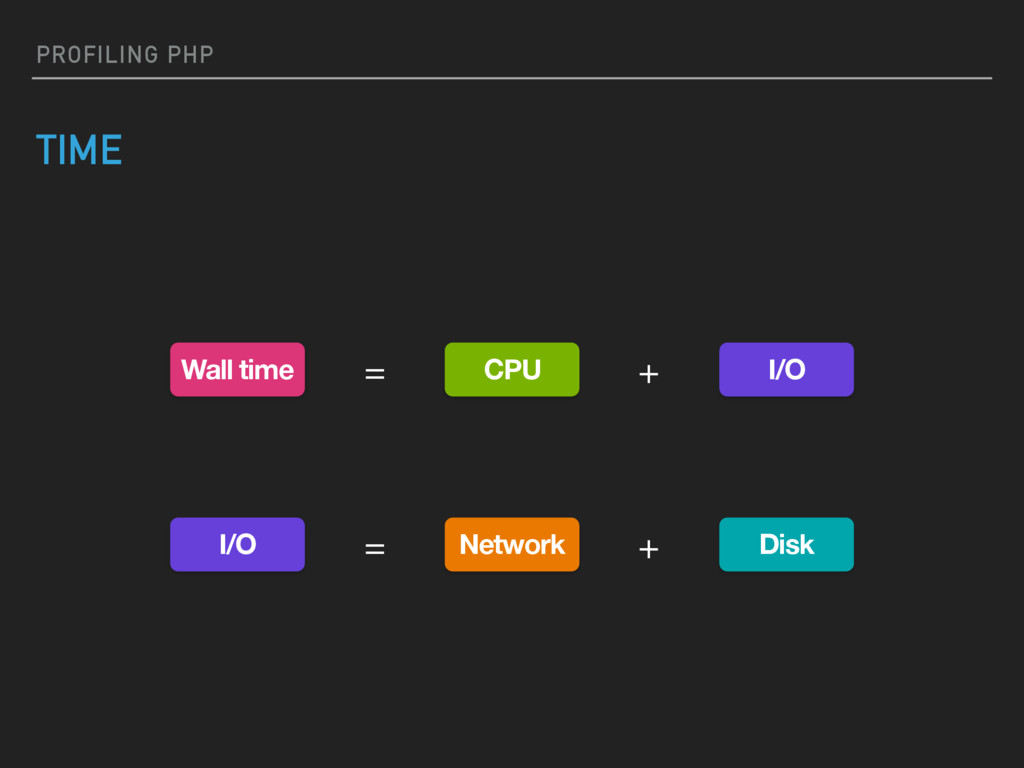
PROFILING PHP TIME Wall time I/O CPU Disk I/O Network
= = + +
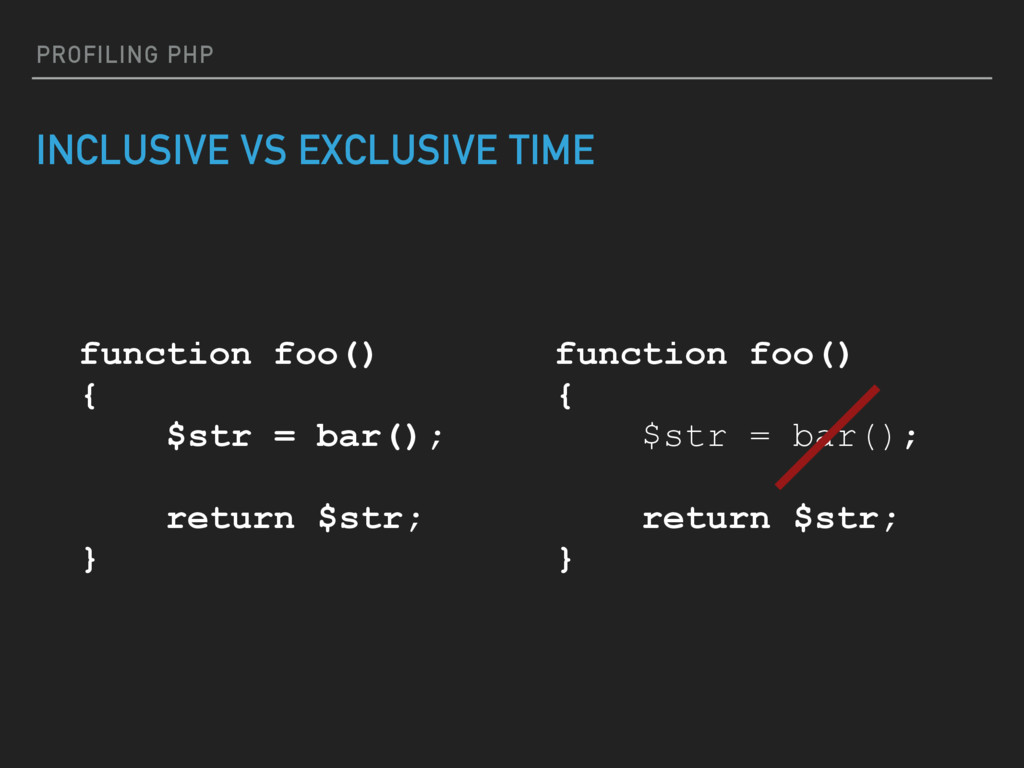
PROFILING PHP INCLUSIVE VS EXCLUSIVE TIME function foo() { $str
= bar(); return $str; } function foo() { $str = bar(); return $str; }
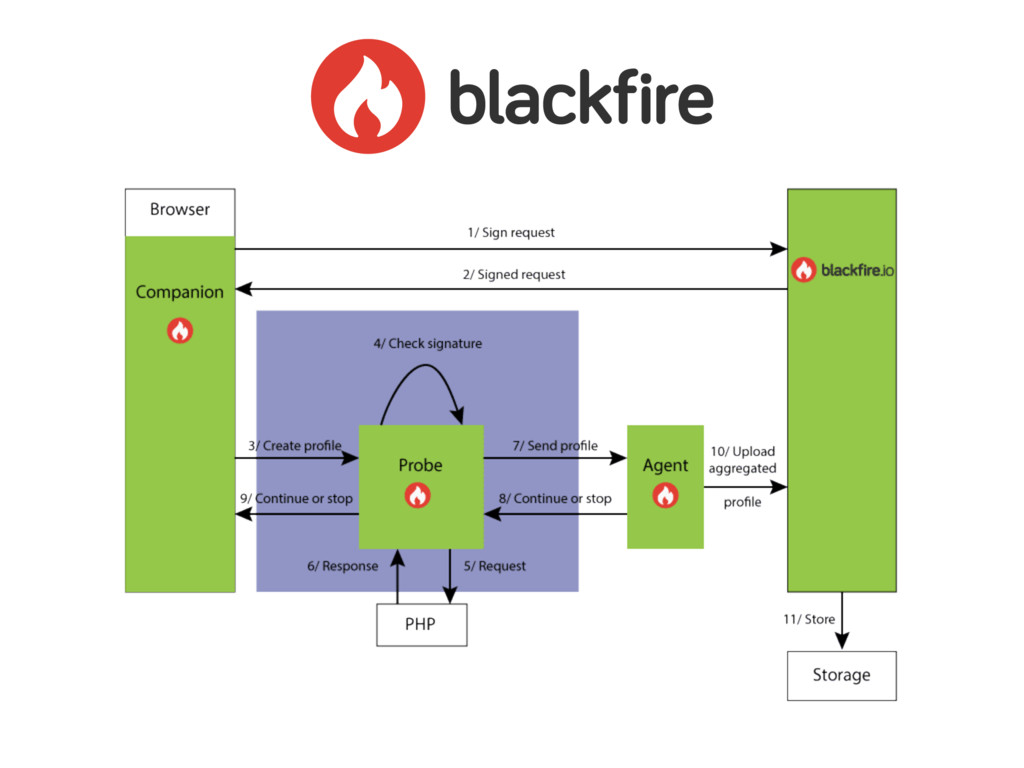
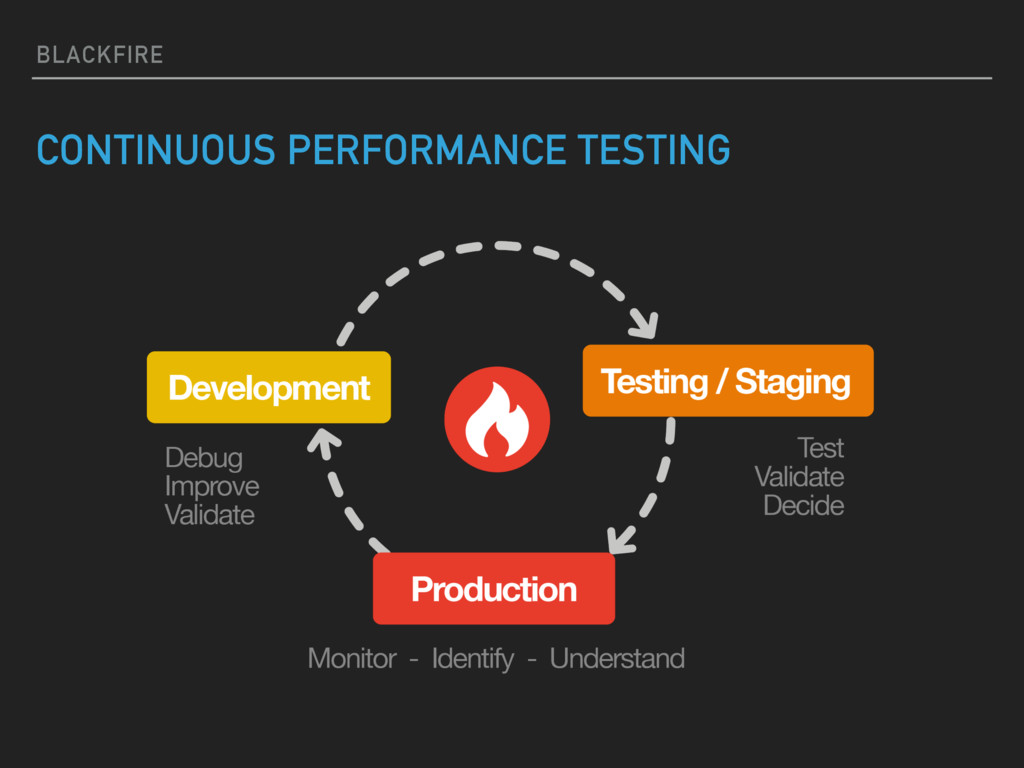
BLACKFIRE CONTINUOUS PERFORMANCE TESTING
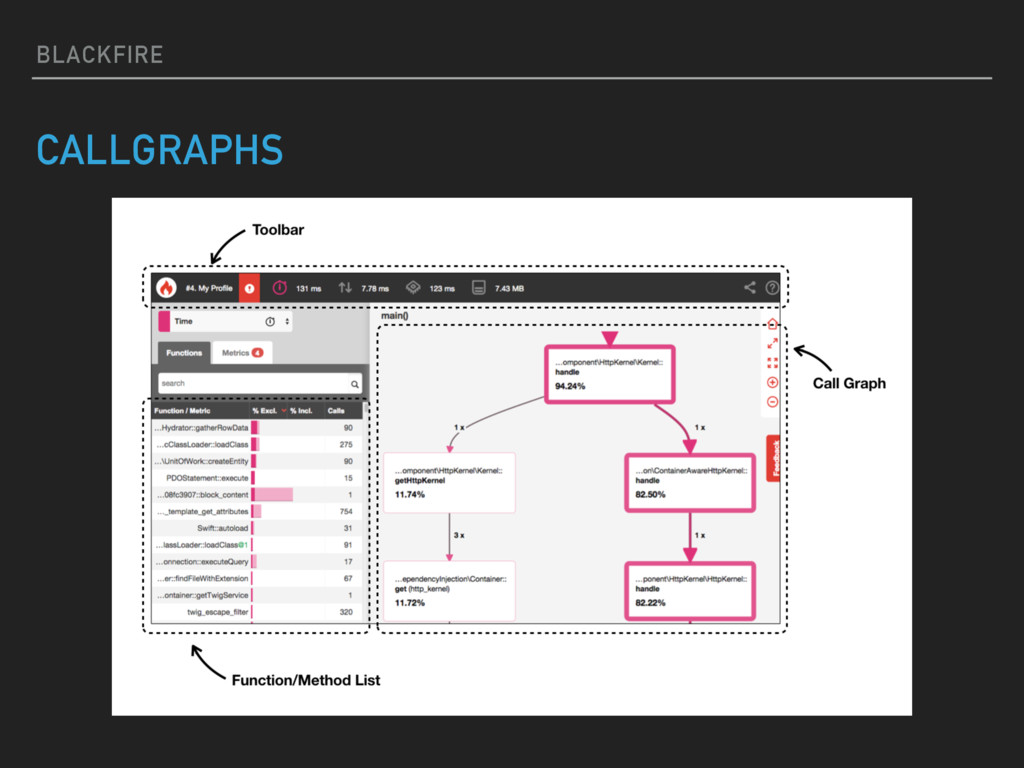
BLACKFIRE CALLGRAPHS
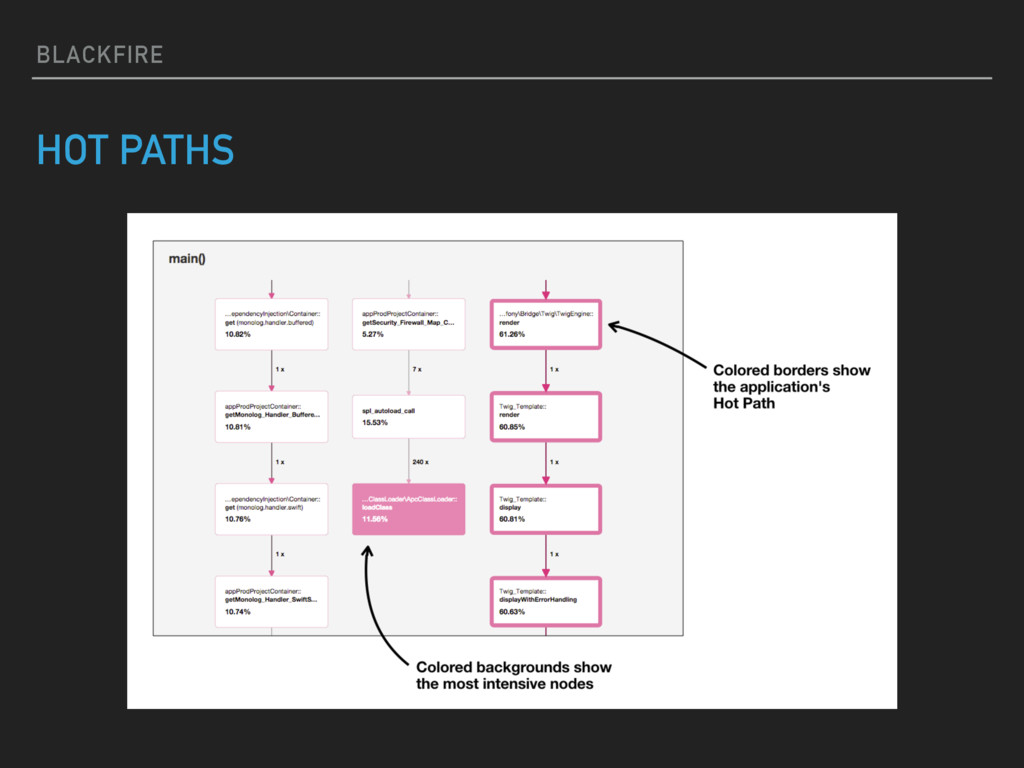
BLACKFIRE HOT PATHS
DEMO CHROME COMPANION
None
None
DEMO BLACKFIRE CURL
None
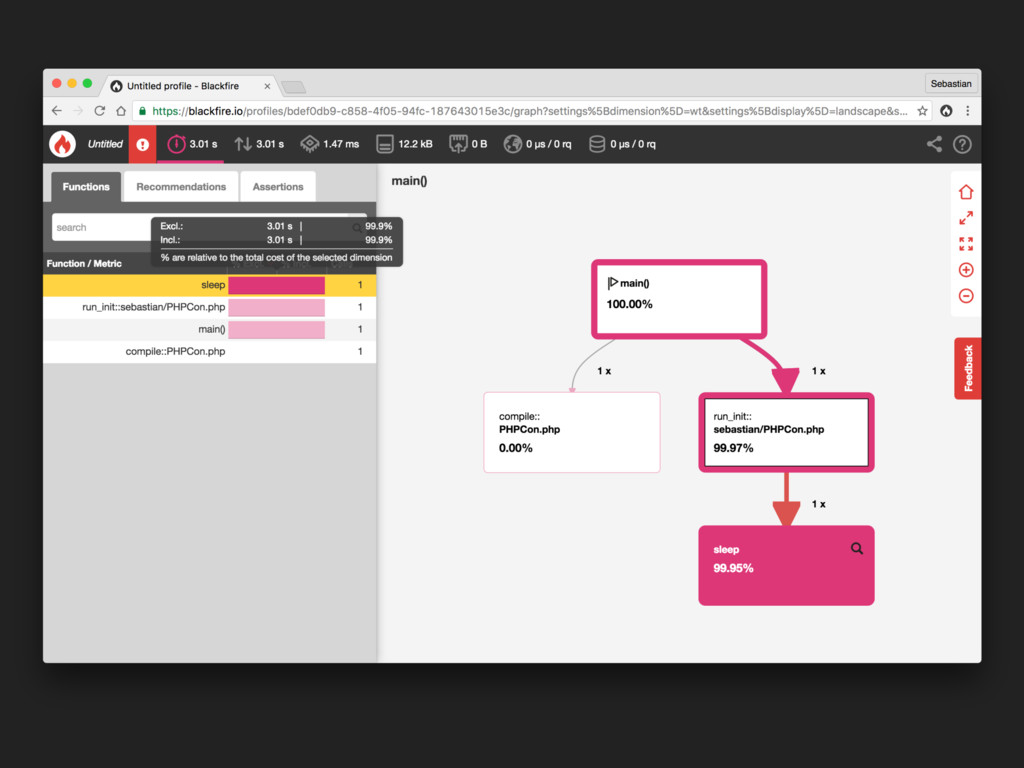
DEMO BLACKFIRE RUN
None
None
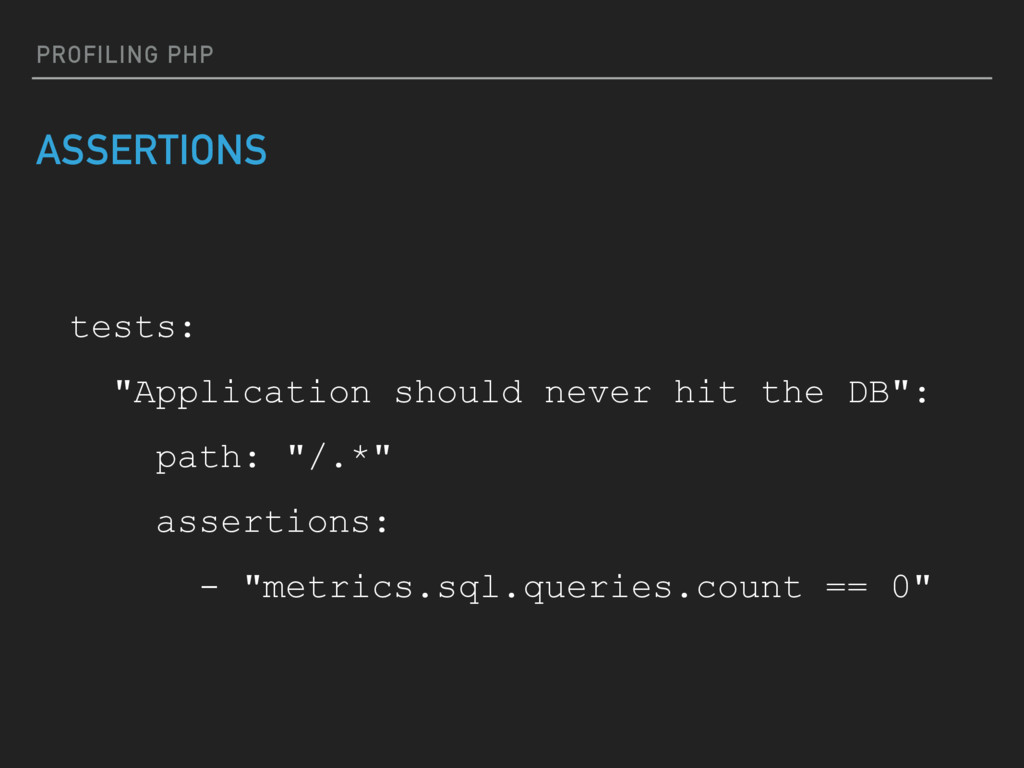
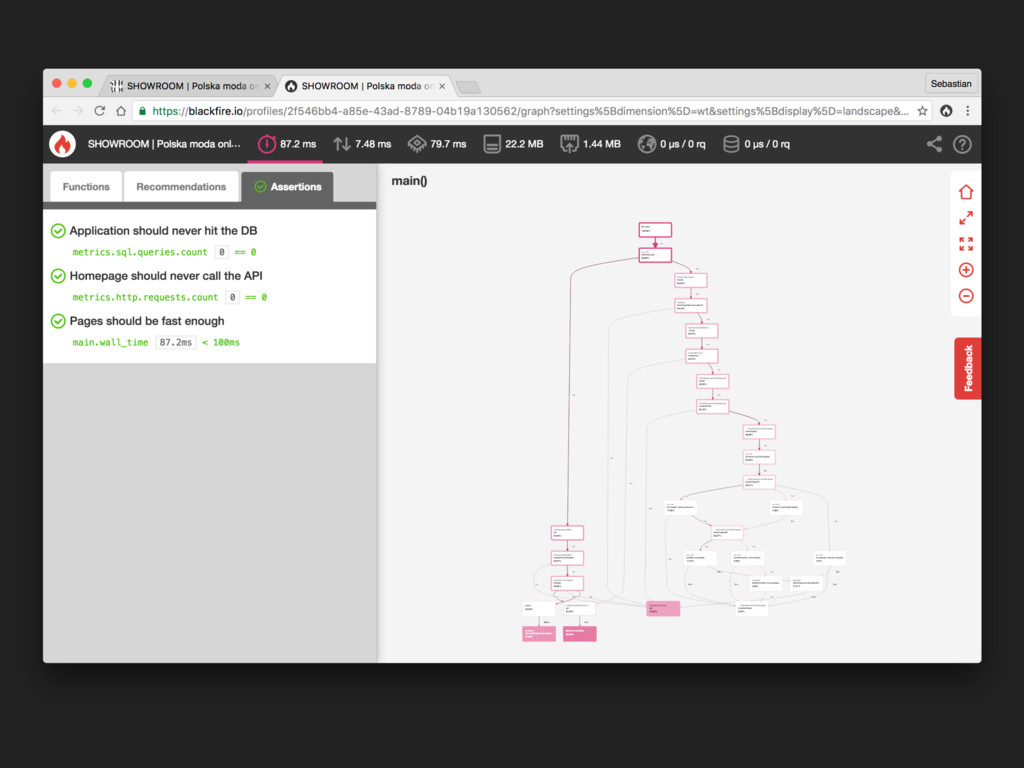
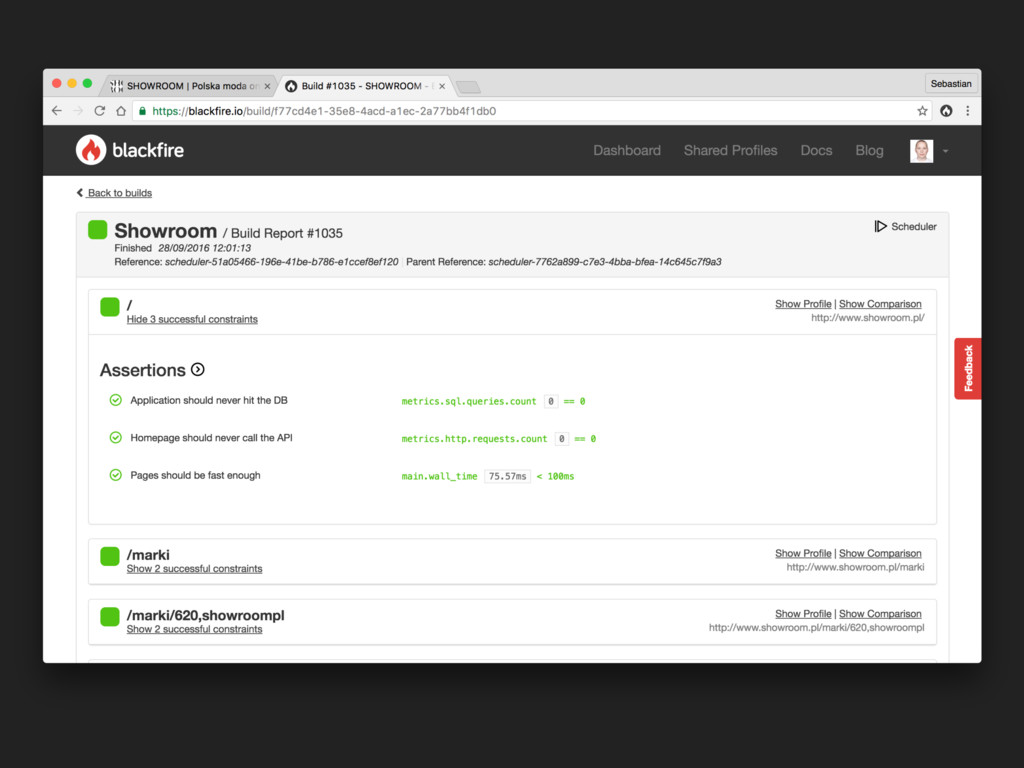
ASSERTIONS
PROFILING PHP ASSERTIONS tests: "Application should never hit the DB":
path: "/.*" assertions: - "metrics.sql.queries.count == 0"
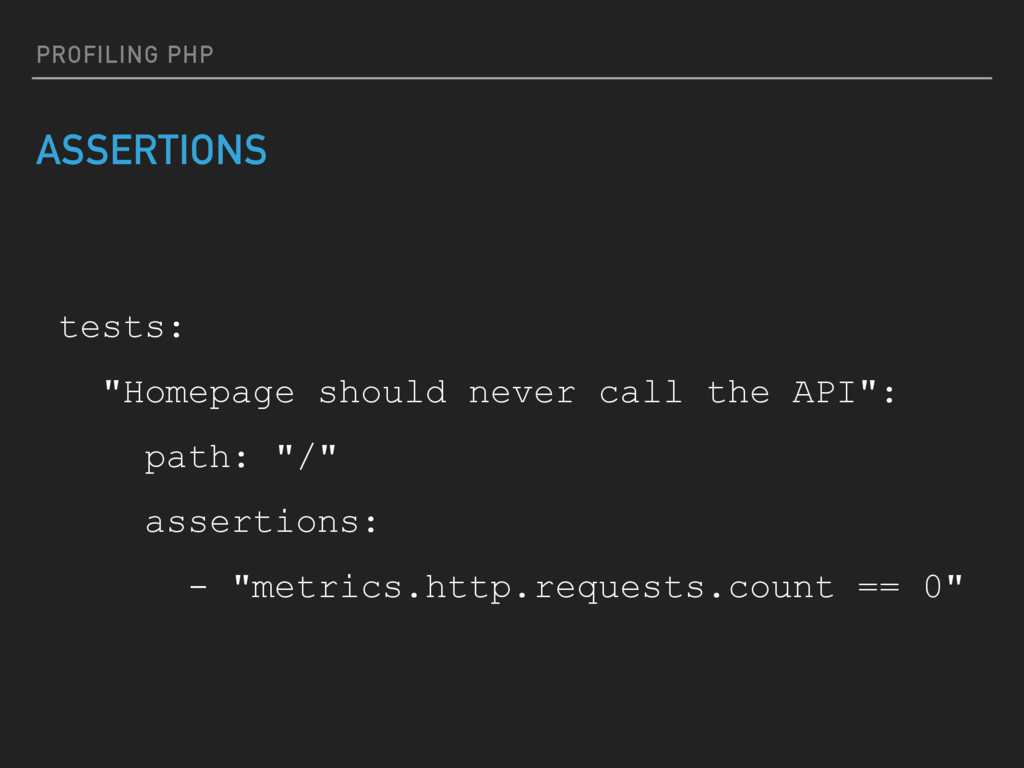
PROFILING PHP ASSERTIONS tests: "Homepage should never call the API":
path: "/" assertions: - "metrics.http.requests.count == 0"
PROFILING PHP ASSERTIONS tests: "Pages should be fast enough": path:
"/.*" assertions: - "main.wall_time < 100ms"
None
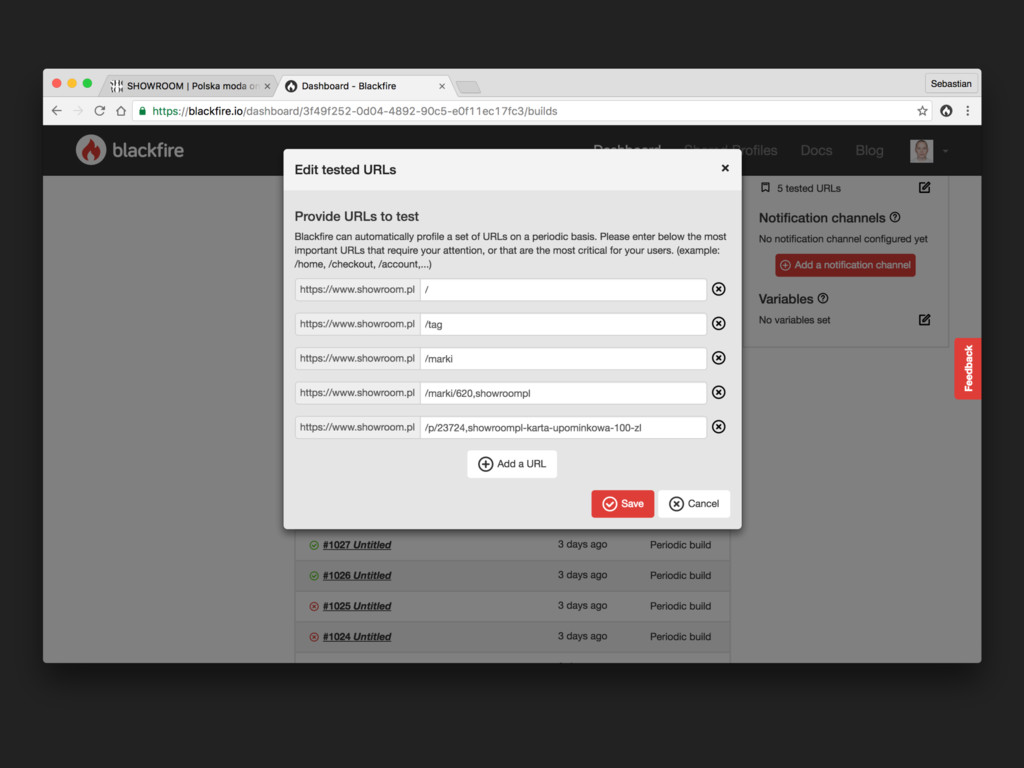
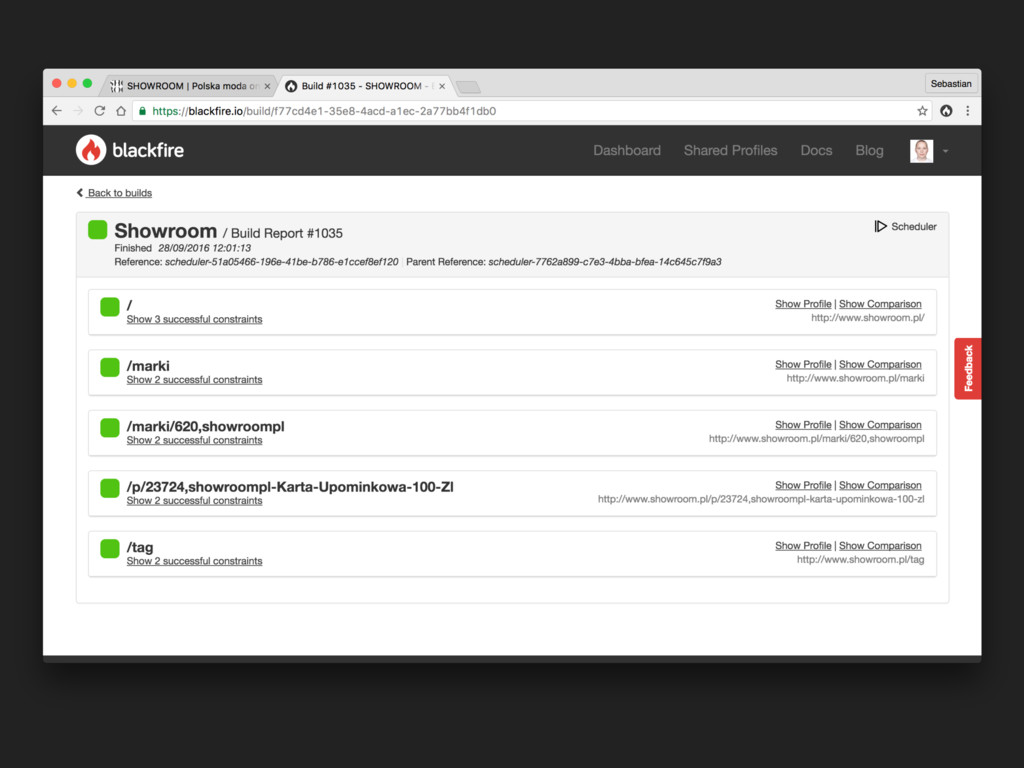
BUILDS
None
None
None
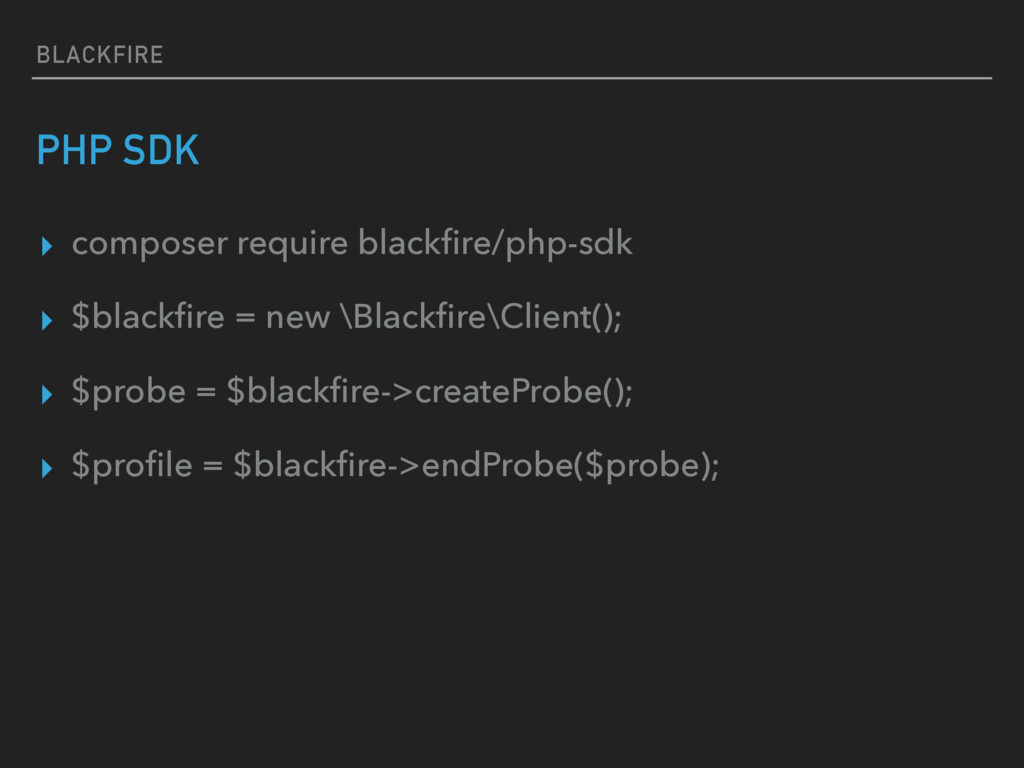
PHP SDK
BLACKFIRE PHP SDK ▸ composer require blackfire/php-sdk ▸ $blackfire =
new \Blackfire\Client(); ▸ $probe = $blackfire->createProbe(); ▸ $profile = $blackfire->endProbe($probe);
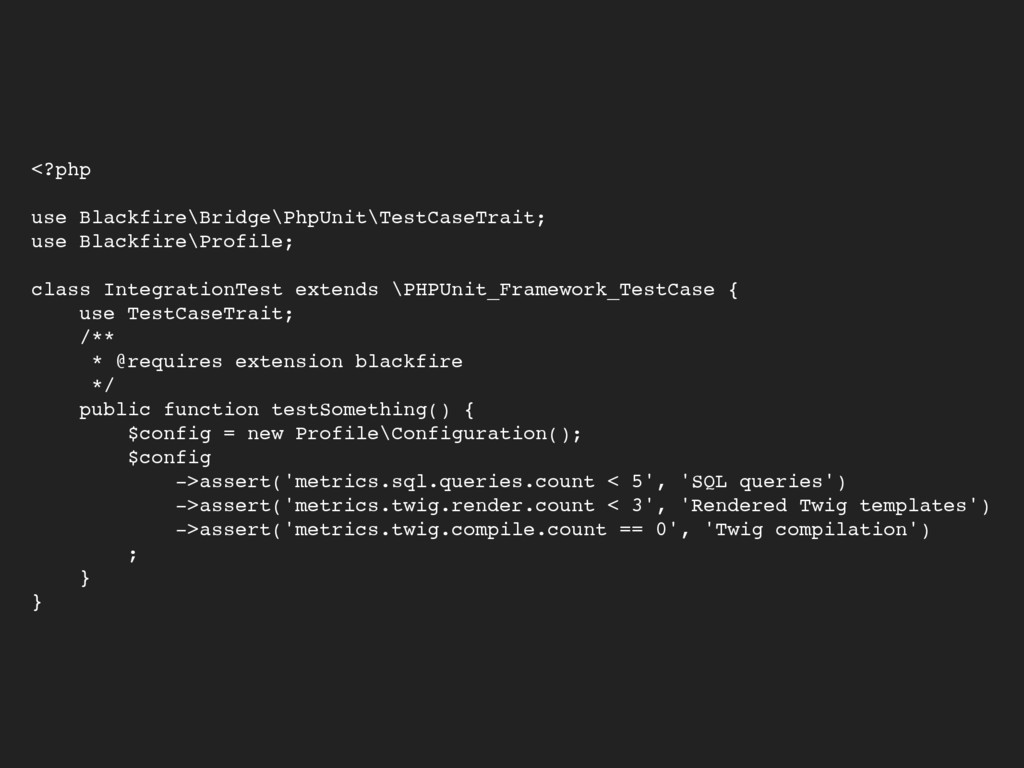
PHPUNIT
<?php use Blackfire\Bridge\PhpUnit\TestCaseTrait; use Blackfire\Profile; class IntegrationTest extends
\PHPUnit_Framework_TestCase { use TestCaseTrait; /** * @requires extension blackfire */ public function testSomething() { $config = new Profile\Configuration(); $config ->assert('metrics.sql.queries.count < 5', 'SQL queries') ->assert('metrics.twig.render.count < 3', 'Rendered Twig templates') ->assert('metrics.twig.compile.count == 0', 'Twig compilation') ; } }
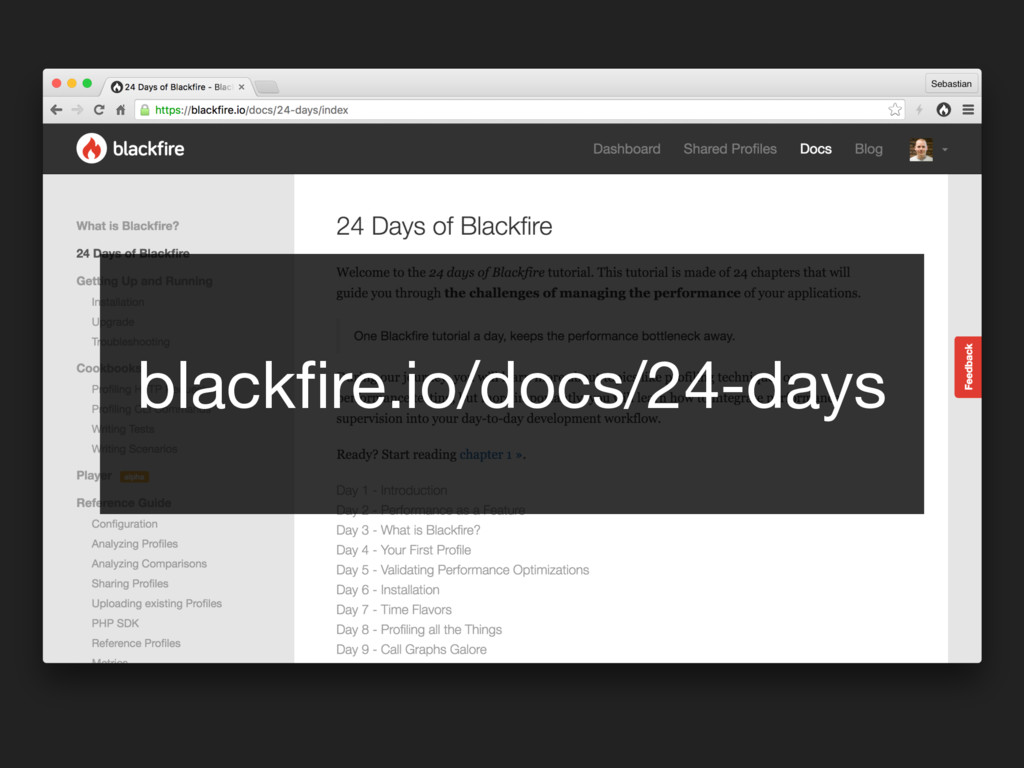
blackfire.io/docs/24-days
QUESTIONS?
THANK YOU!