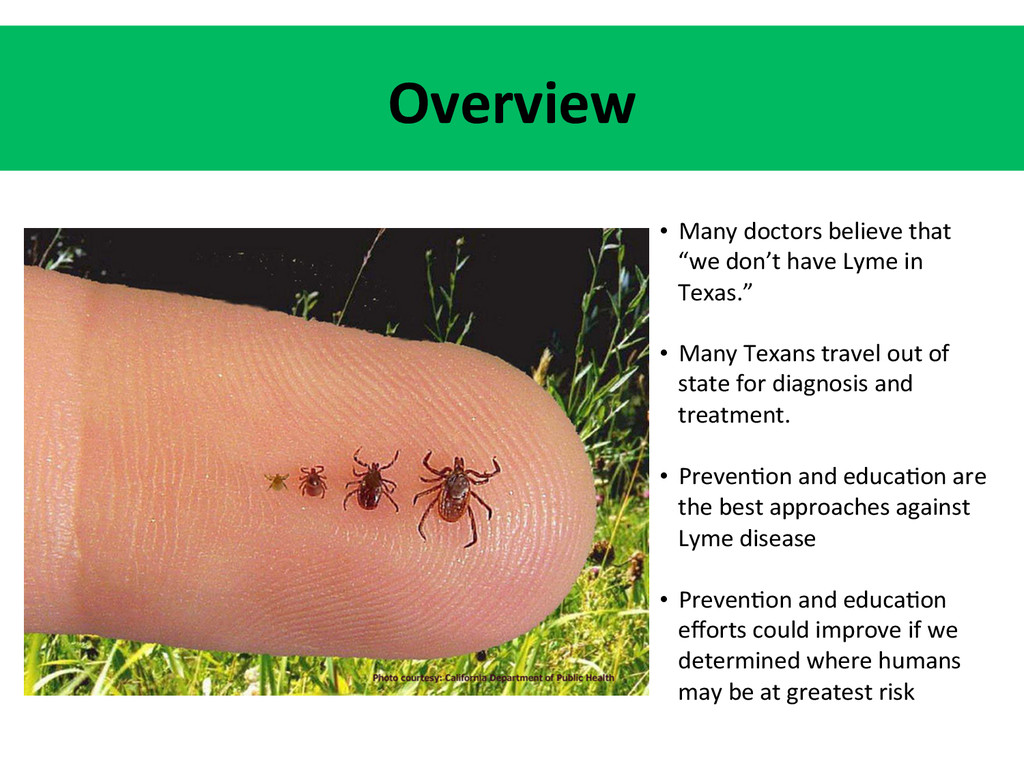
don’t have Lyme in Texas.” • Many Texans travel out of state for diagnosis and treatment. • Preven?on and educa?on are the best approaches against Lyme disease • Preven?on and educa?on efforts could improve if we determined where humans may be at greatest risk
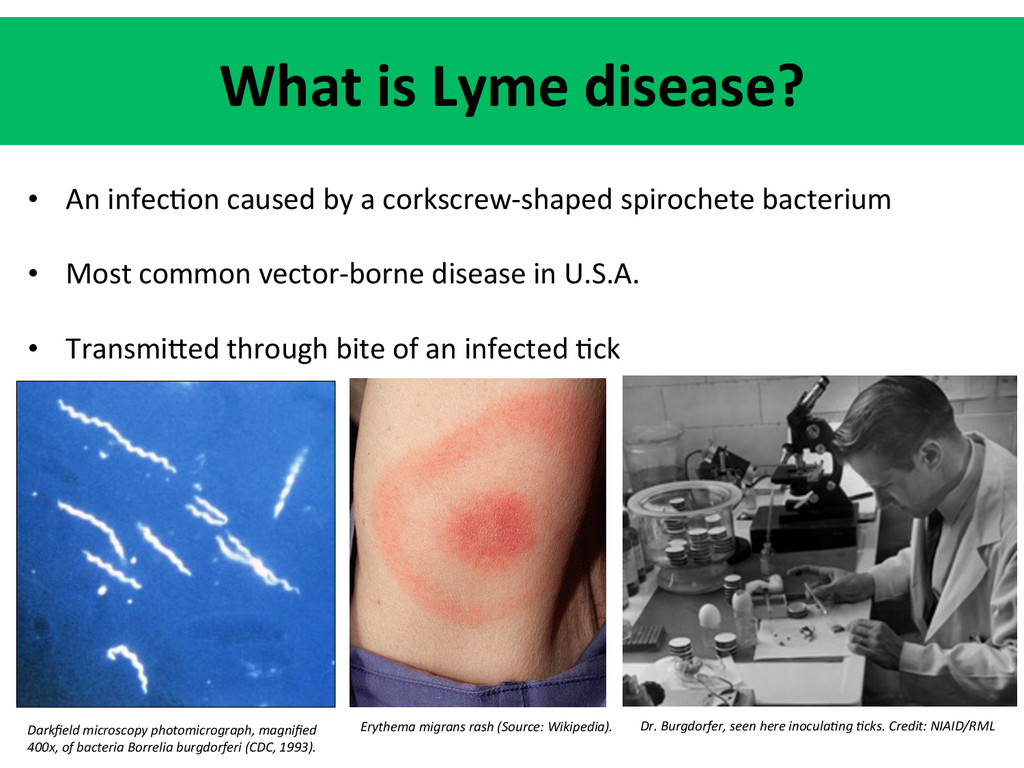
a corkscrew-‐shaped spirochete bacterium • Most common vector-‐borne disease in U.S.A. • TransmiGed through bite of an infected ?ck Darkfield microscopy photomicrograph, magnified 400x, of bacteria Borrelia burgdorferi (CDC, 1993). Dr. Burgdorfer, seen here inoculaDng Dcks. Credit: NIAID/RML Erythema migrans rash (Source: Wikipedia).
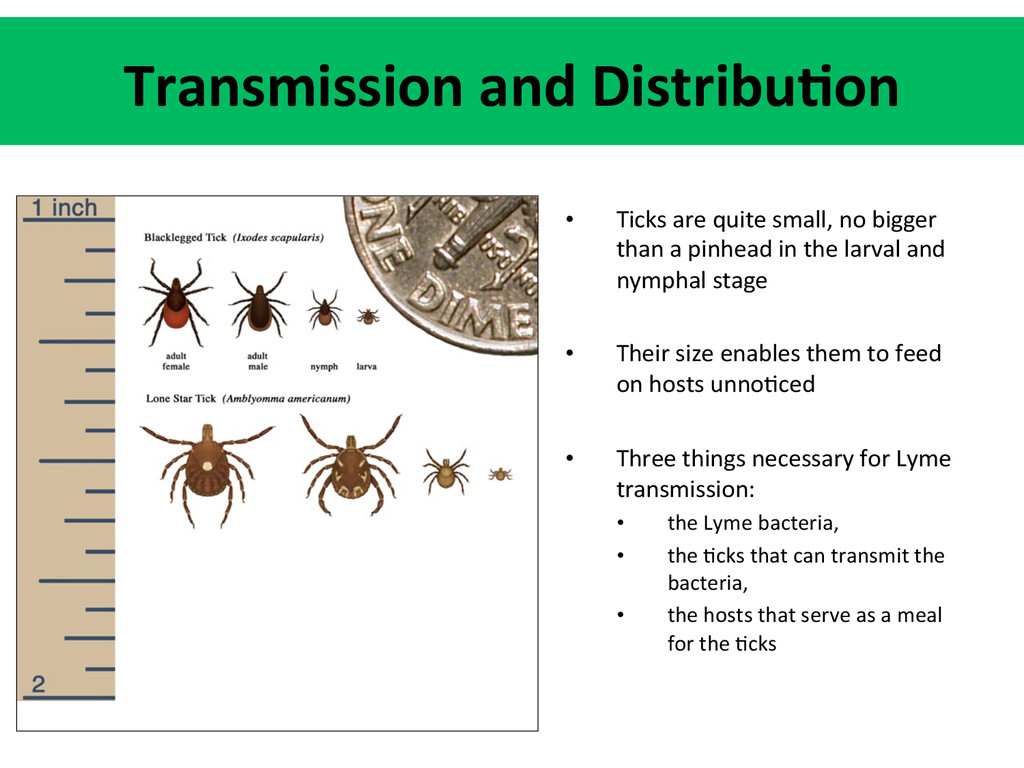
pinhead in the larval and nymphal stage • Their size enables them to feed on hosts unno?ced • Three things necessary for Lyme transmission: • the Lyme bacteria, • the ?cks that can transmit the bacteria, • the hosts that serve as a meal for the ?cks Transmission and Distribu5on
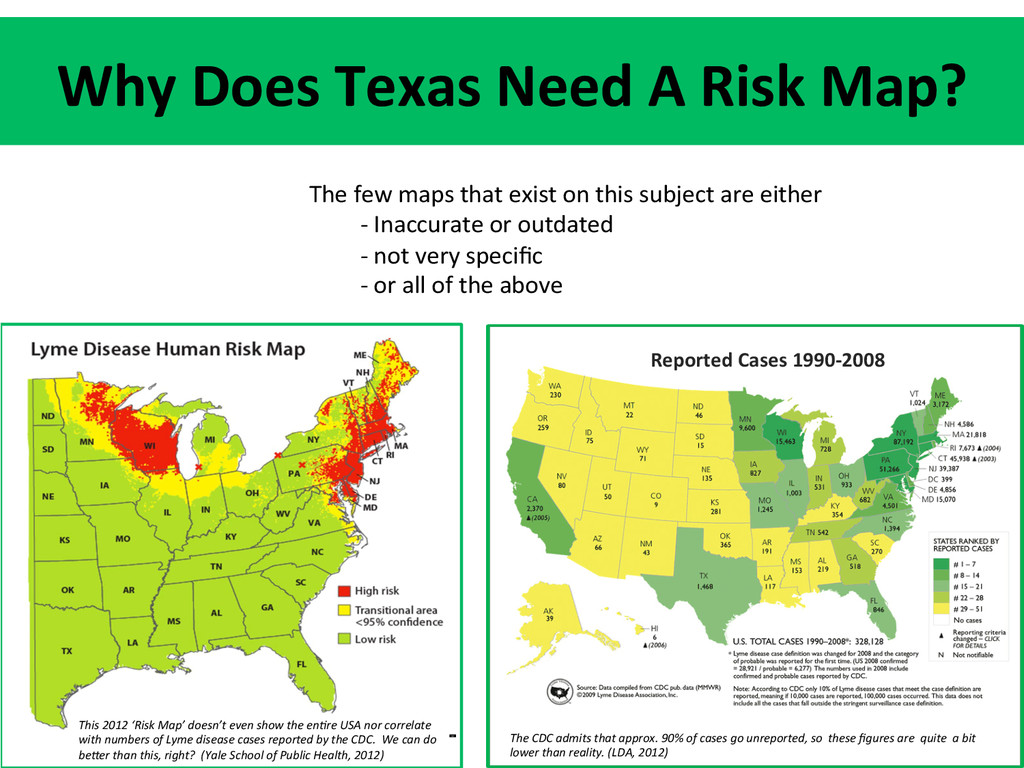
‘Risk Map’ doesn’t even show the enDre USA nor correlate with numbers of Lyme disease cases reported by the CDC. We can do beZer than this, right? (Yale School of Public Health, 2012) The few maps that exist on this subject are either -‐ Inaccurate or outdated -‐ not very specific -‐ or all of the above The CDC admits that approx. 90% of cases go unreported, so these figures are quite a bit lower than reality. (LDA, 2012) Reported Cases 1990-‐2008
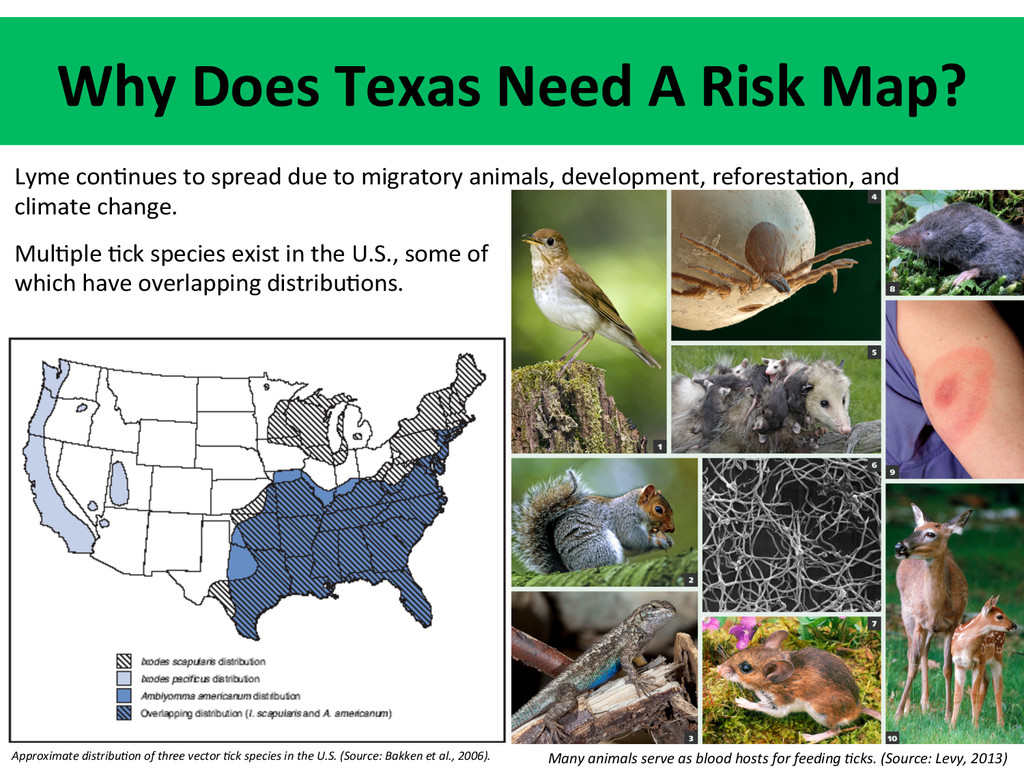
of three vector Dck species in the U.S. (Source: Bakken et al., 2006). Lyme con?nues to spread due to migratory animals, development, reforesta?on, and climate change. Mul?ple ?ck species exist in the U.S., some of which have overlapping distribu?ons. Many animals serve as blood hosts for feeding Dcks. (Source: Levy, 2013)
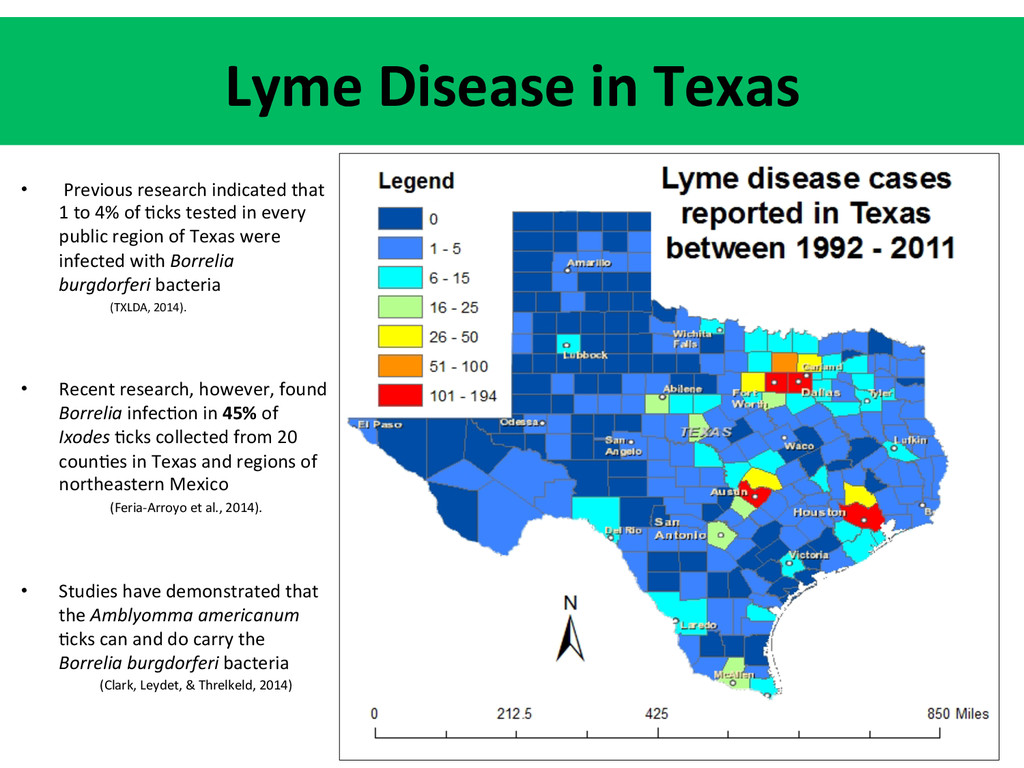
1 to 4% of ?cks tested in every public region of Texas were infected with Borrelia burgdorferi bacteria (TXLDA, 2014). • Recent research, however, found Borrelia infec?on in 45% of Ixodes ?cks collected from 20 coun?es in Texas and regions of northeastern Mexico (Feria-‐Arroyo et al., 2014). • Studies have demonstrated that the Amblyomma americanum ?cks can and do carry the Borrelia burgdorferi bacteria (Clark, Leydet, & Threlkeld, 2014)
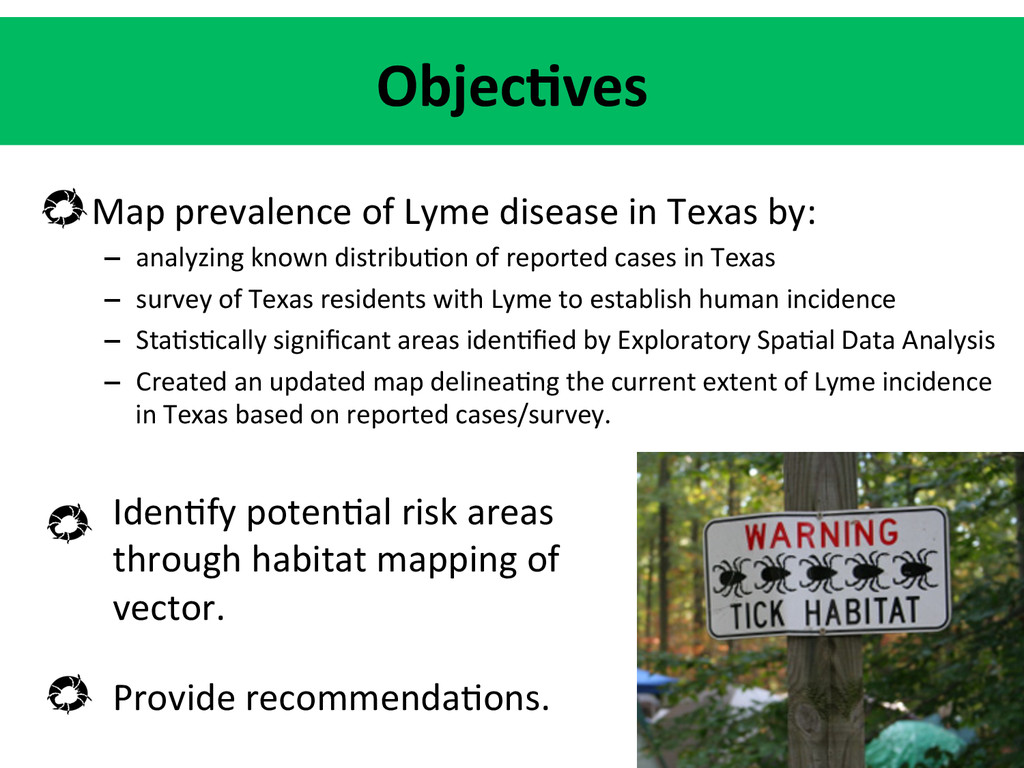
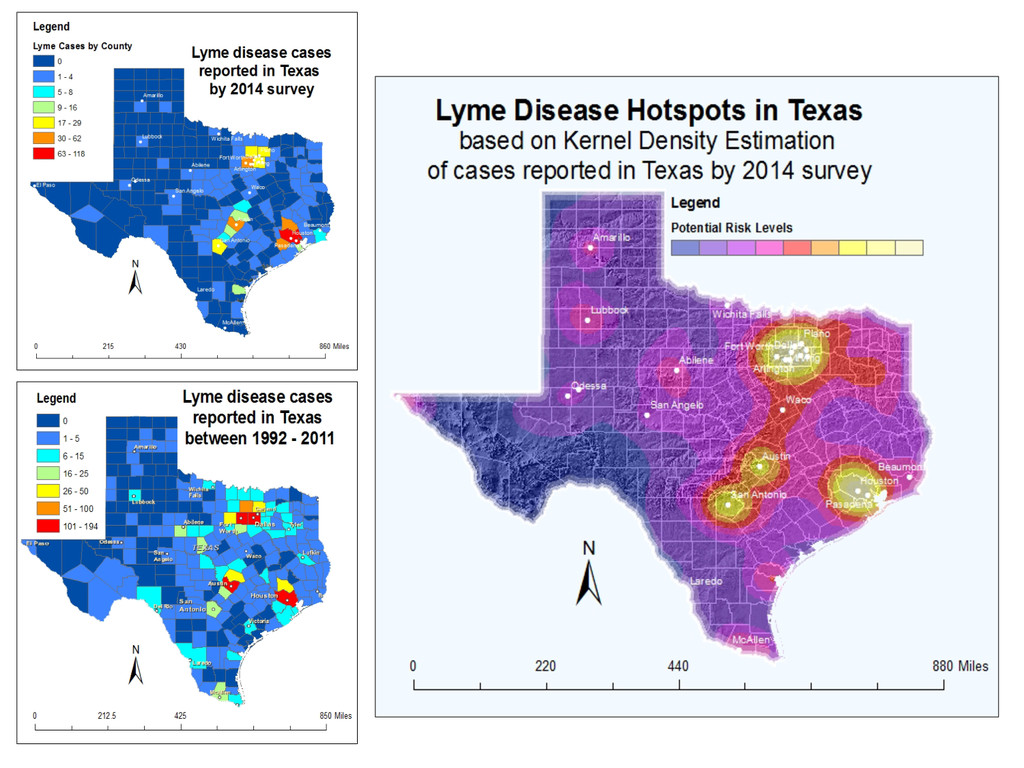
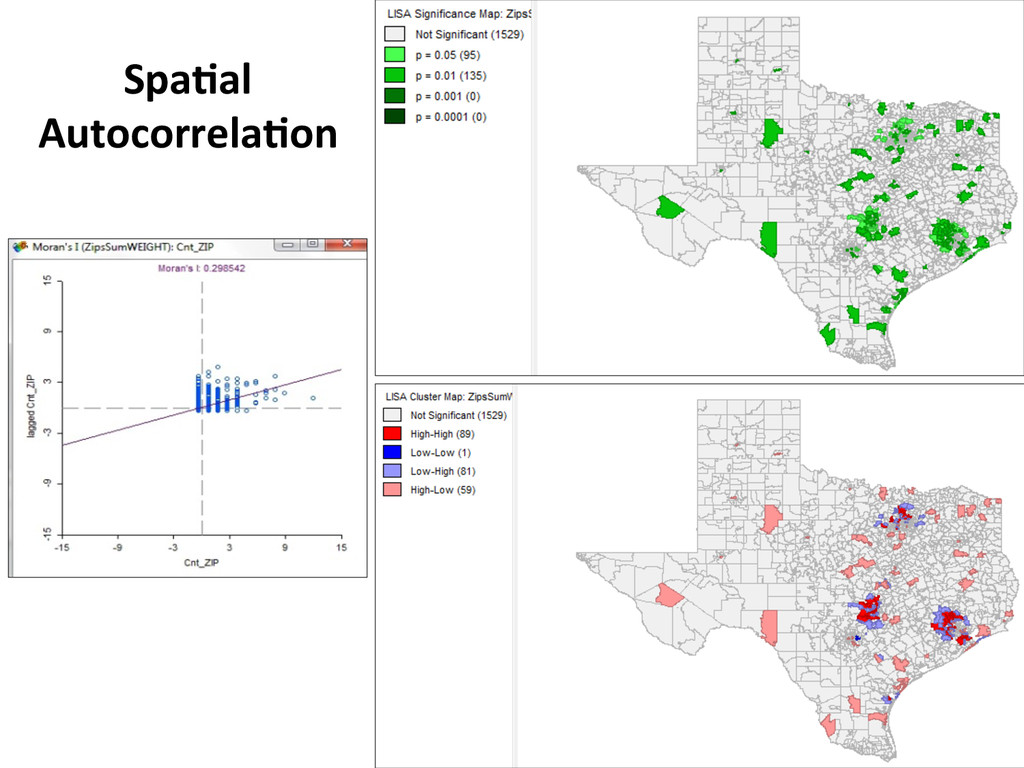
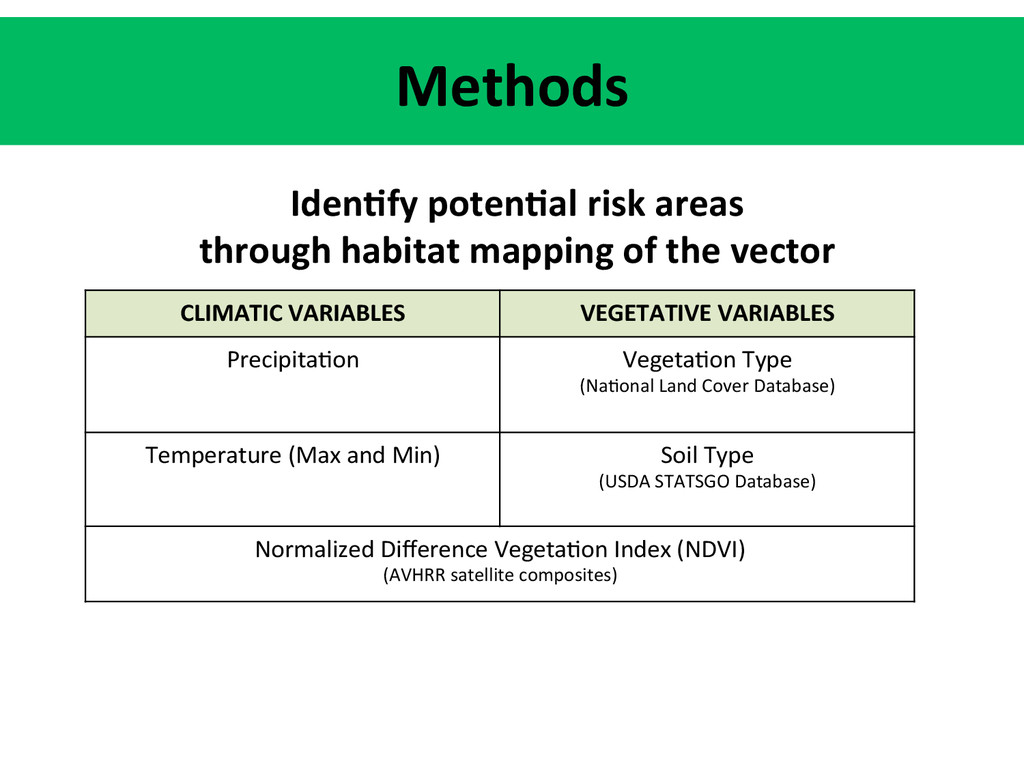
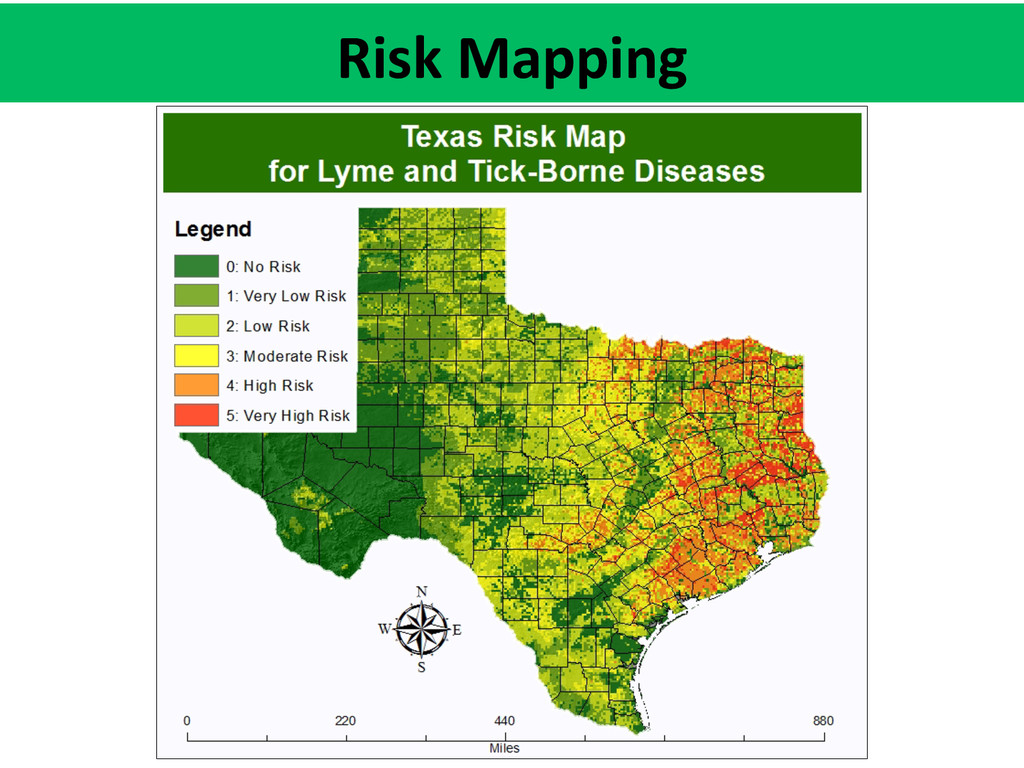
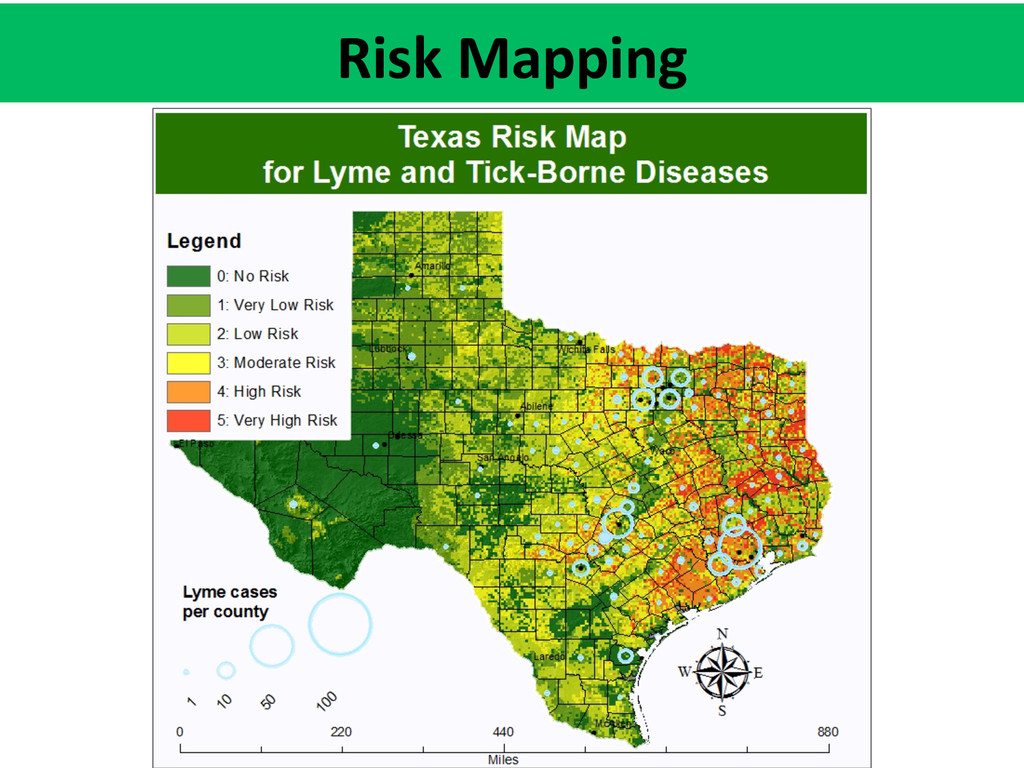
– analyzing known distribu?on of reported cases in Texas – survey of Texas residents with Lyme to establish human incidence – Sta?s?cally significant areas iden?fied by Exploratory Spa?al Data Analysis – Created an updated map delinea?ng the current extent of Lyme incidence in Texas based on reported cases/survey. Objec5ves Iden?fy poten?al risk areas through habitat mapping of vector. Provide recommenda?ons.
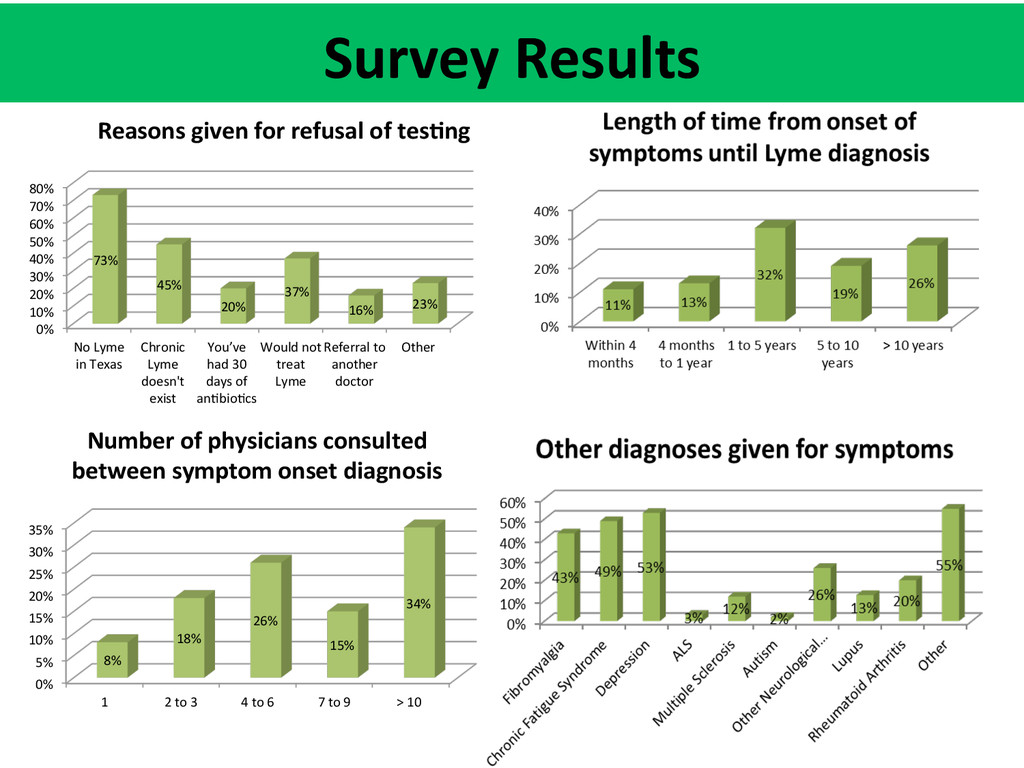
20% 30% 40% 50% 60% 70% 80% No Lyme in Texas Chronic Lyme doesn't exist You’ve had 30 days of an?bio?cs Would not treat Lyme Referral to another doctor Other 73% 45% 20% 37% 16% 23% Reasons given for refusal of tes5ng 0% 5% 10% 15% 20% 25% 30% 35% 1 2 to 3 4 to 6 7 to 9 > 10 8% 18% 26% 15% 34% Number of physicians consulted between symptom onset diagnosis
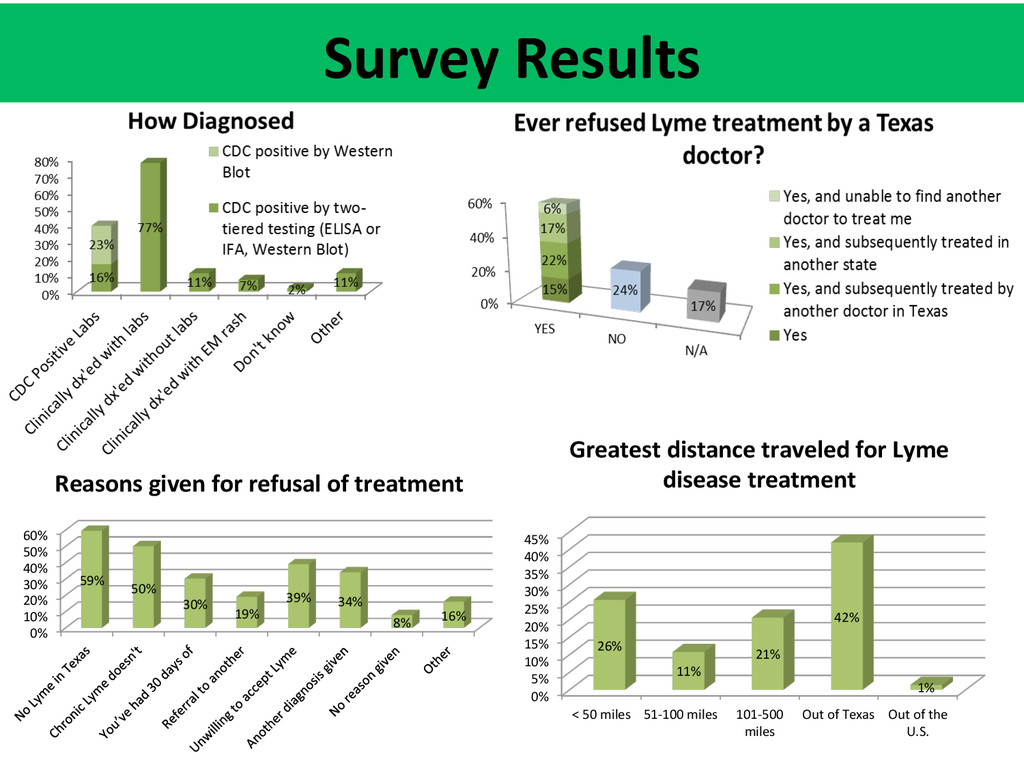
20% 30% 40% 50% 60% 59% 50% 30% 19% 39% 34% 8% 16% Reasons given for refusal of treatment 0% 5% 10% 15% 20% 25% 30% 35% 40% 45% < 50 miles 51-‐100 miles 101-‐500 miles Out of Texas Out of the U.S. 26% 11% 21% 42% 1% Greatest distance traveled for Lyme disease treatment
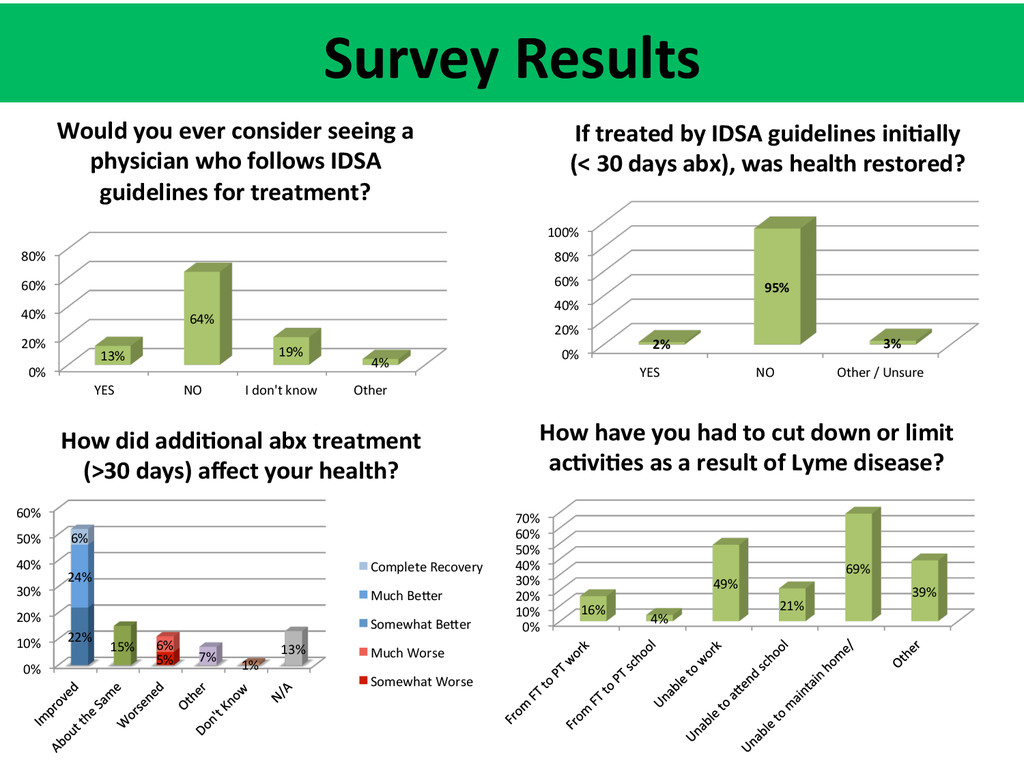
20% 30% 40% 50% 60% 70% 16% 4% 49% 21% 69% 39% How have you had to cut down or limit ac5vi5es as a result of Lyme disease? 0% 10% 20% 30% 40% 50% 60% 5% 6% 22% 15% 7% 1% 13% 24% 6% How did addi5onal abx treatment (>30 days) affect your health? Complete Recovery Much BeGer Somewhat BeGer Much Worse Somewhat Worse 0% 20% 40% 60% 80% YES NO I don't know Other 13% 64% 19% 4% Would you ever consider seeing a physician who follows IDSA guidelines for treatment? 0% 20% 40% 60% 80% 100% YES NO Other / Unsure 2% 95% 3% If treated by IDSA guidelines ini5ally (< 30 days abx), was health restored?
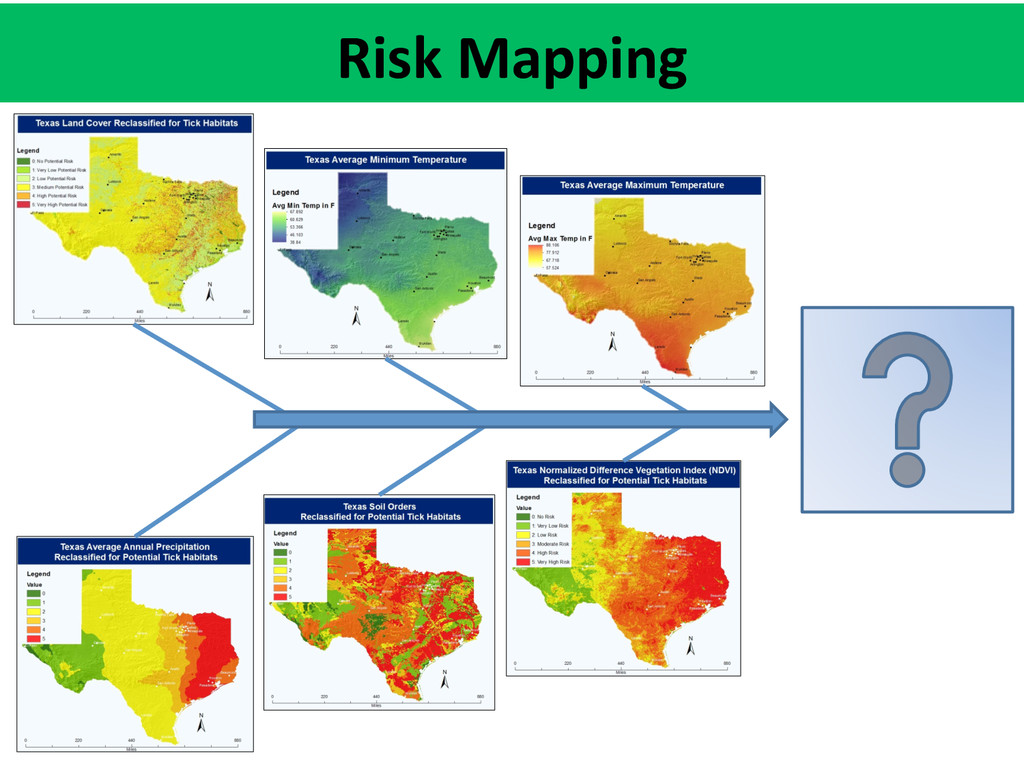
mapping of the vector CLIMATIC VARIABLES VEGETATIVE VARIABLES Precipita?on Vegeta?on Type (Na?onal Land Cover Database) Temperature (Max and Min) Soil Type (USDA STATSGO Database) Normalized Difference Vegeta?on Index (NDVI) (AVHRR satellite composites)
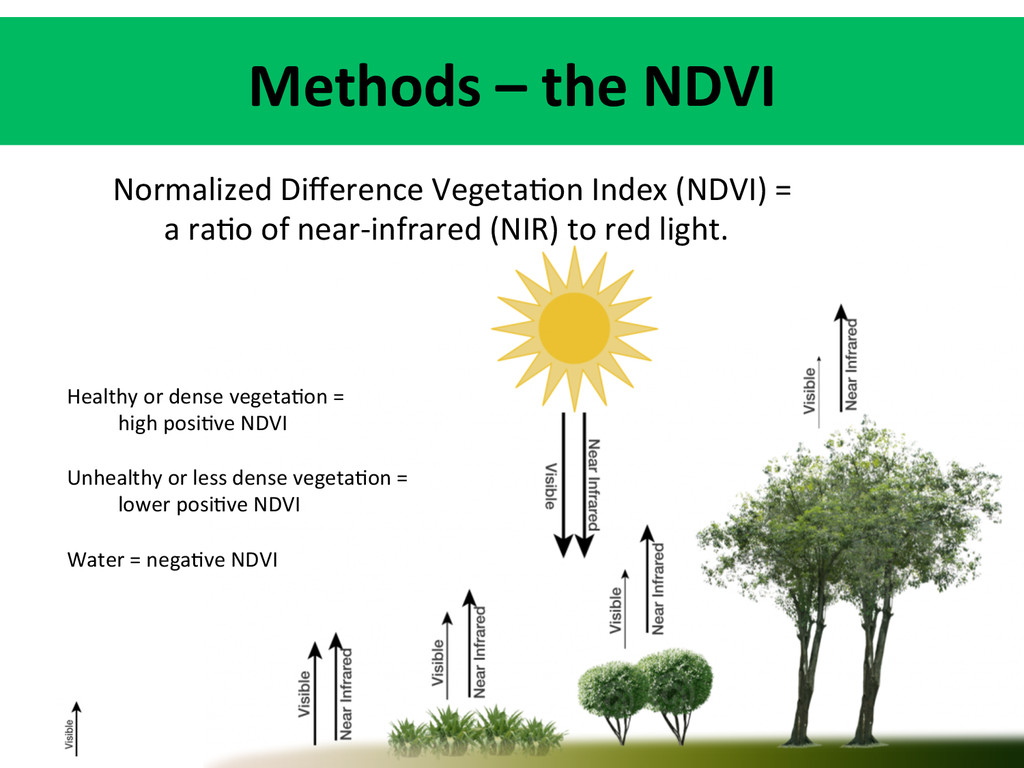
= a ra?o of near-‐infrared (NIR) to red light. Healthy or dense vegeta?on = high posi?ve NDVI Unhealthy or less dense vegeta?on = lower posi?ve NDVI Water = nega?ve NDVI
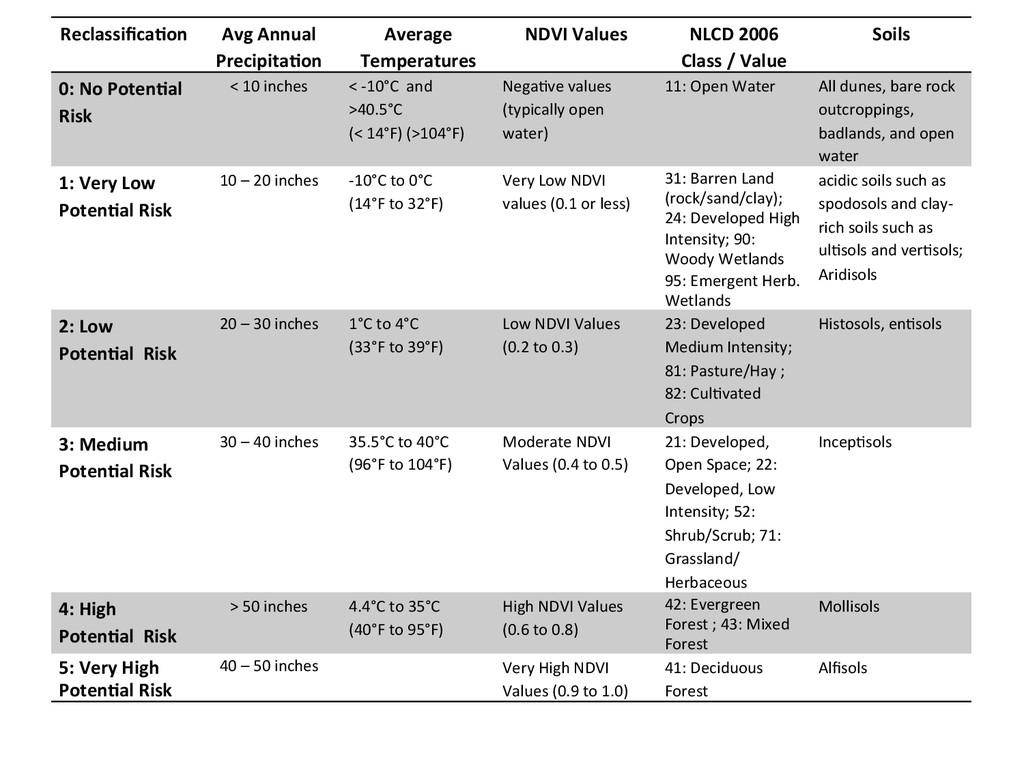
NDVI Values NLCD 2006 Class / Value Soils 0: No Poten5al Risk < 10 inches < -‐10°C and >40.5°C (< 14°F) (>104°F) Nega?ve values (typically open water) 11: Open Water All dunes, bare rock outcroppings, badlands, and open water 1: Very Low Poten5al Risk 10 – 20 inches -‐10°C to 0°C (14°F to 32°F) Very Low NDVI values (0.1 or less) 31: Barren Land (rock/sand/clay); 24: Developed High Intensity; 90: Woody Wetlands 95: Emergent Herb. Wetlands acidic soils such as spodosols and clay-‐ rich soils such as ul?sols and ver?sols; Aridisols 2: Low Poten5al Risk 20 – 30 inches 1°C to 4°C (33°F to 39°F) Low NDVI Values (0.2 to 0.3) 23: Developed Medium Intensity; 81: Pasture/Hay ; 82: Cul?vated Crops Histosols, en?sols 3: Medium Poten5al Risk 30 – 40 inches 35.5°C to 40°C (96°F to 104°F) Moderate NDVI Values (0.4 to 0.5) 21: Developed, Open Space; 22: Developed, Low Intensity; 52: Shrub/Scrub; 71: Grassland/ Herbaceous Incep?sols 4: High Poten5al Risk > 50 inches 4.4°C to 35°C (40°F to 95°F) High NDVI Values (0.6 to 0.8) 42: Evergreen Forest ; 43: Mixed Forest Mollisols 5: Very High Poten5al Risk 40 – 50 inches Very High NDVI Values (0.9 to 1.0) 41: Deciduous Forest Alfisols
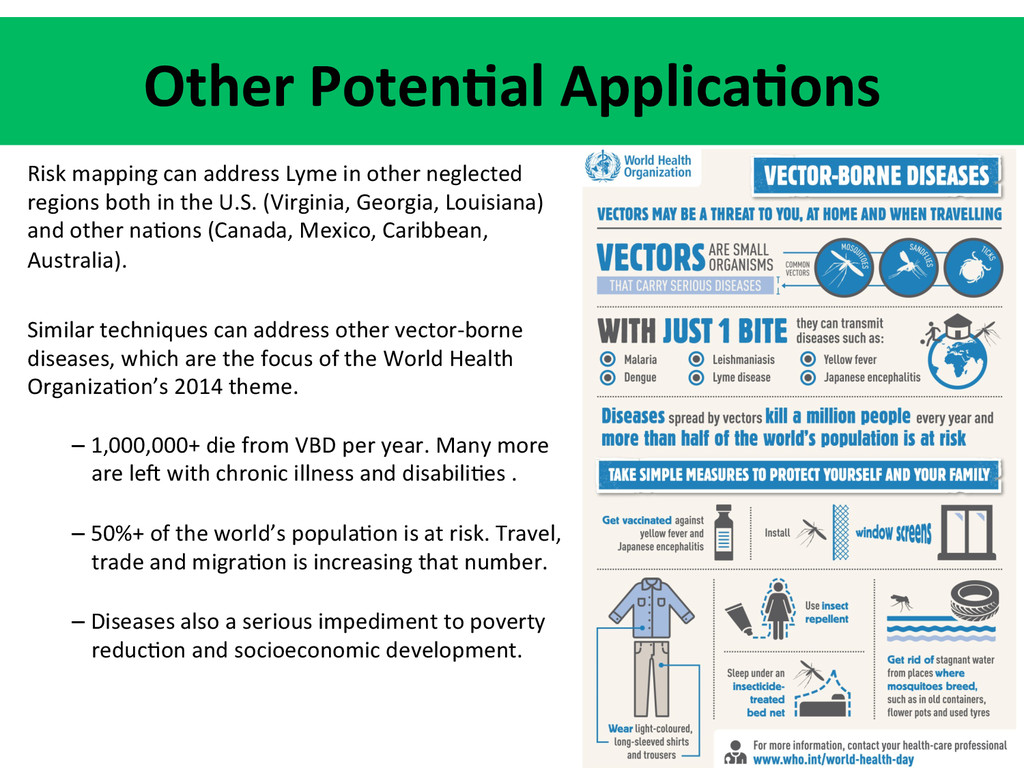
both in the U.S. (Virginia, Georgia, Louisiana) and other na?ons (Canada, Mexico, Caribbean, Australia). Similar techniques can address other vector-‐borne diseases, which are the focus of the World Health Organiza?on’s 2014 theme. – 1,000,000+ die from VBD per year. Many more are let with chronic illness and disabili?es . – 50%+ of the world’s popula?on is at risk. Travel, trade and migra?on is increasing that number. – Diseases also a serious impediment to poverty reduc?on and socioeconomic development. Other Poten5al Applica5ons
Dr. Jus?ne Blanford Anna E. Berman Phyllis Shaw Patricia Ricks The Texas Lyme Disease Associa?on (TXLDA) Texas Natural Resources Informa?on System (TNRIS ) Thank you for your attention today!