Upgrade to Pro — share decks privately, control downloads, hide ads and more …

Monitoring Spatial-Temporal Patterns of PM 2.5 for Improved Understanding of Air Pollution...

Monitoring Spatial-Temporal Patterns of PM 2.5 for Improved Understanding of Air Pollution...

Lu Liang, University of North Texas

More Decks by Texas Natural Resources Information System

Other Decks in Technology

Transcript

  1. Monitoring Spatial-Temporal Patterns of PM2.5 For Improved Understanding of Air

    Pollution Dynamics Using Portable Sensing Technologies Lu Liang U of North Texas
  2. Street Canyon Effect - Influence of urban morphology in the

    vertical plane Prevailing wind direction Leeward Windward
  3. Research Questions 1. TO GET A SPATIAL AND TEMPORAL UNDERSTANDING

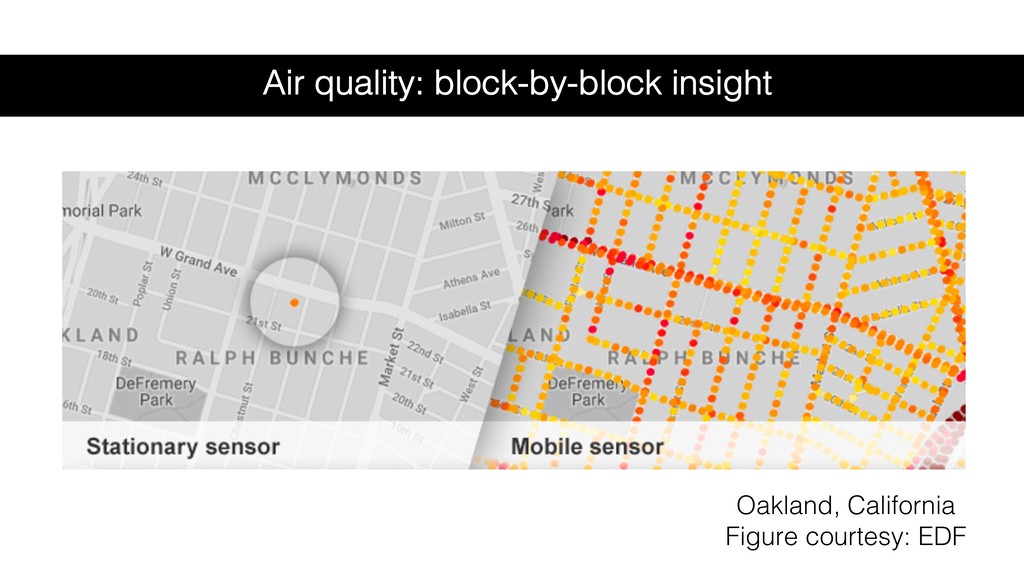
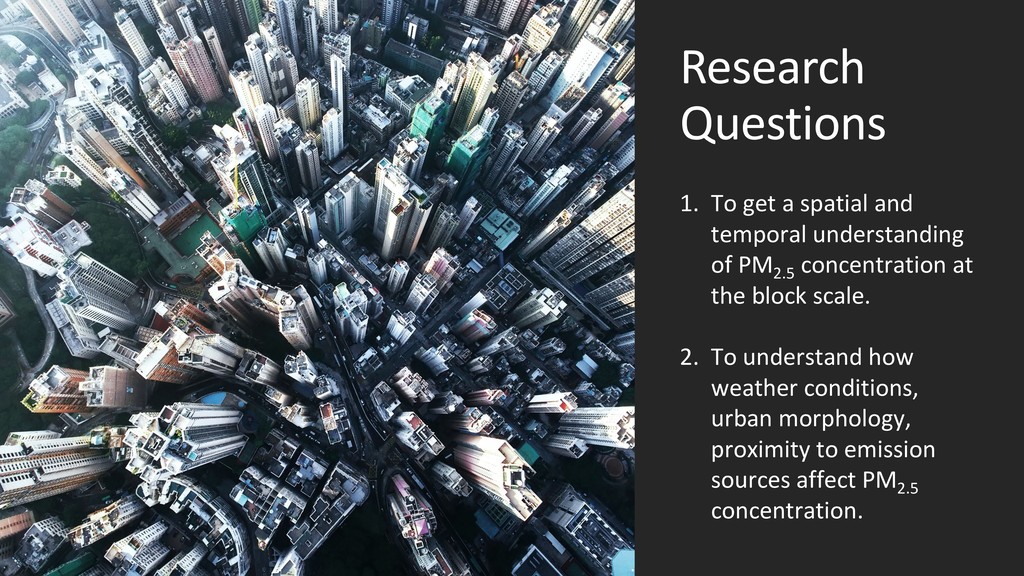
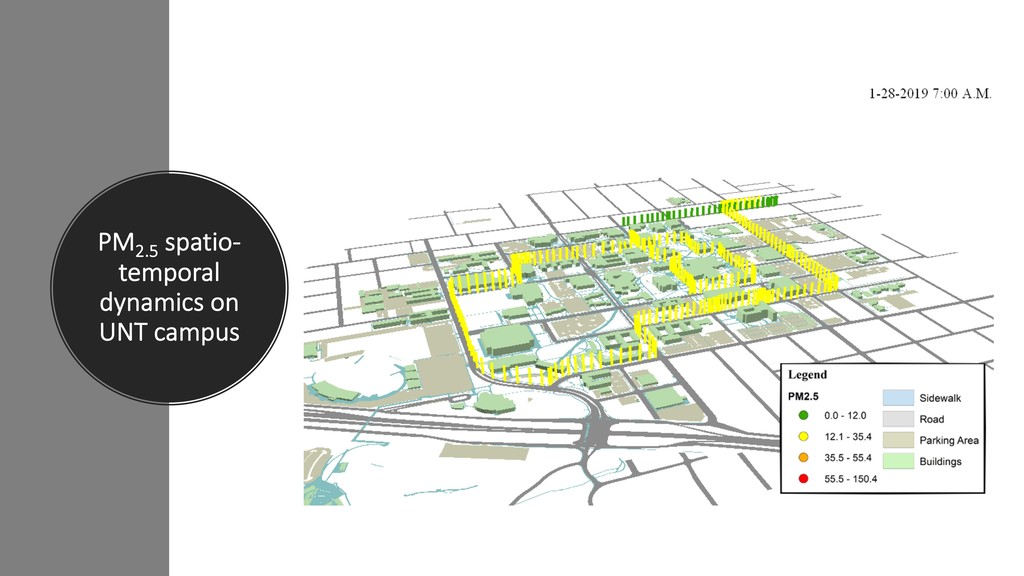
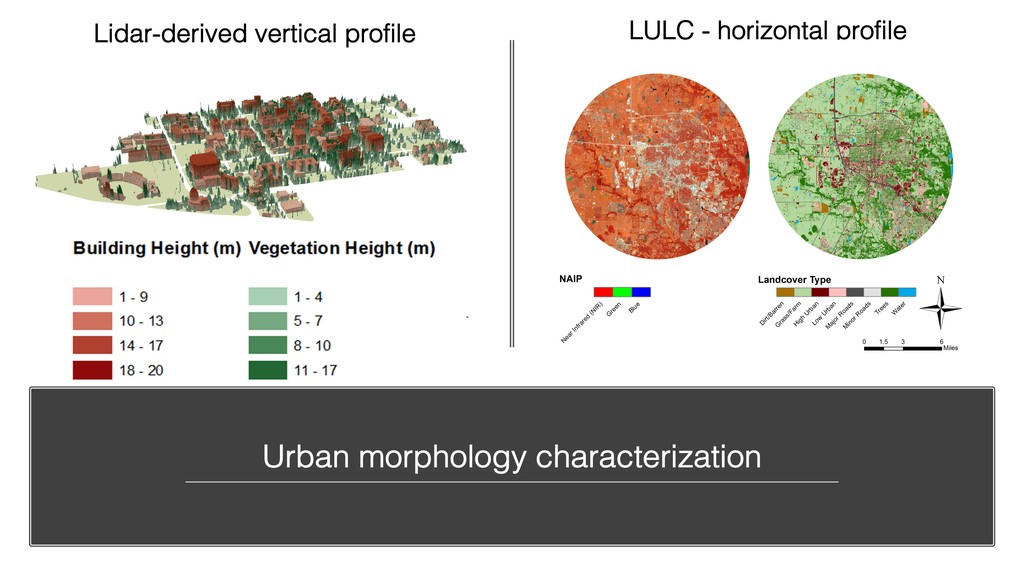
    OF PM2.5 CONCENTRATION AT THE BLOCK SCALE. 2. 2. TO UNDERSTAND HOW WEATHER CONDITIONS, URBAN MORPHOLOGY, PROXIMITY TO EMISSION SOURCES AFFECT PM2.5 CONCENTRATION. 1. To get a spatial and temporal understanding of PM2.5 concentration at the block scale. 2. To understand how weather conditions, urban morphology, proximity to emission sources affect PM2.5 concentration.
  4. Study area Texas commission on environmental quality (TCEQ) PM2.5 monitoring

    stations Hydraulic fracturing Idling trucks Cement plants Construction
  5. Experiment design • Total path is 1.6 miles. • Sampling

    at: 7AM, 12AM, 3PM, 7PM • 2019.1.28 – 2019.2.8 Dylos DC1700 BATTERY OPERATED AQM GlobalSat DG-500 Data Logger & Bluetooth GPS Receiver
  6. = Wind wedge A new way to quantify the effects

    of urban morphology on air pollution along the wind direction.
  7. Panel Data Analysis Cross-Sectional data Time-Series data Time 3: Time

    1: P 1 P 2 P 3 P 4 P 5 Time 2: P 1 P 2 P 3 P 4 P 5 P 1 P 2 P 3 P 4 P 5
  8. Panel Analysis Results Estimate Std Error T value P value

    WEATHER CONDITION wind direction 1.25 0.54 2.30 * wind speed 12.90 1.54 8.37 *** wind gust -17.47 0.96 -18.11 *** Temperature 4.79 0.68 7.07 *** Dew point 6.25 0.69 9.06 *** PROXIMITY TO EMISSION SOURCES distance to minor roads -0.17 0.29 -0.60 distance to major roads 3.08 0.34 9.03 *** distance to bus stops 0.03 0.29 0.10 URBAN MORPHOLOGY Wind wedge vegetation footprint -6.64 0.80 -8.30 *** building footprint 1.21 0.61 1.98 * vegetation height 6.29 0.52 12.15 *** building height -11.38 0.93 -12.20 *** Circular buffer vegetation footprint 90.58 6.27 14.44 * building footprint -94.87 6.21 -15.28 * vegetation height -1.86 0.79 -2.36 * building height -1.61 1.55 -1.04
  9. Urban landscape Air quality At the block-level The effect of

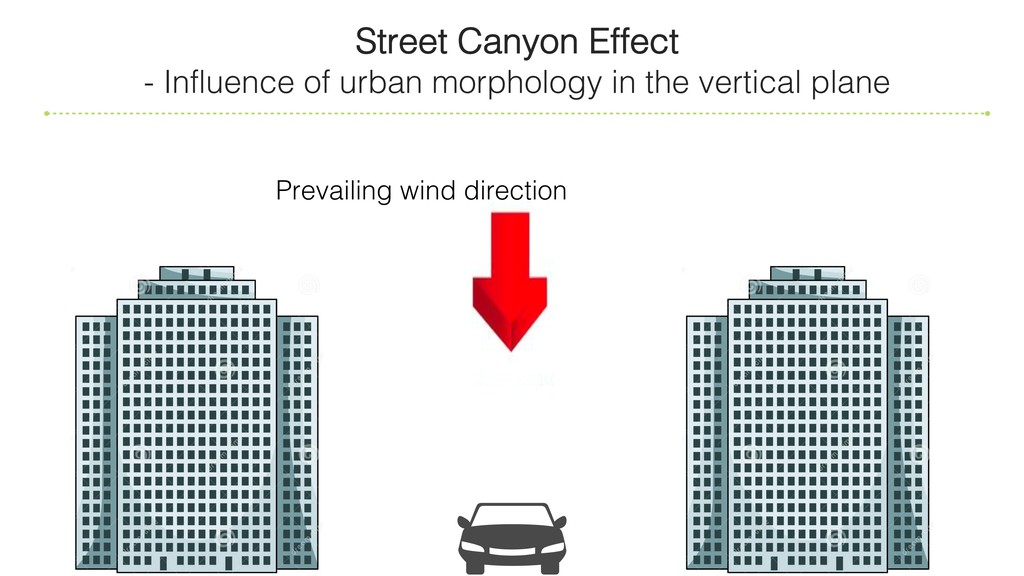
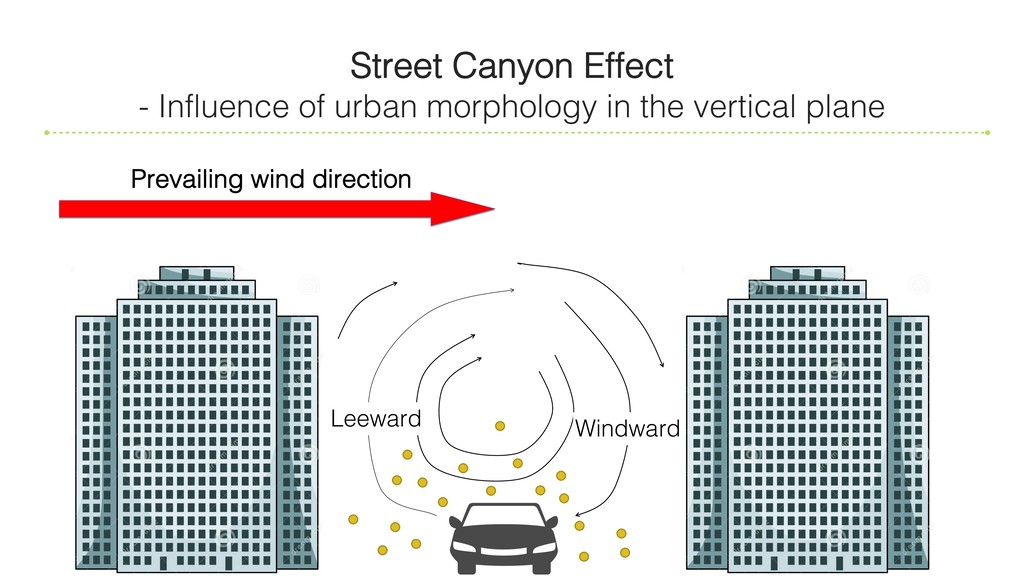
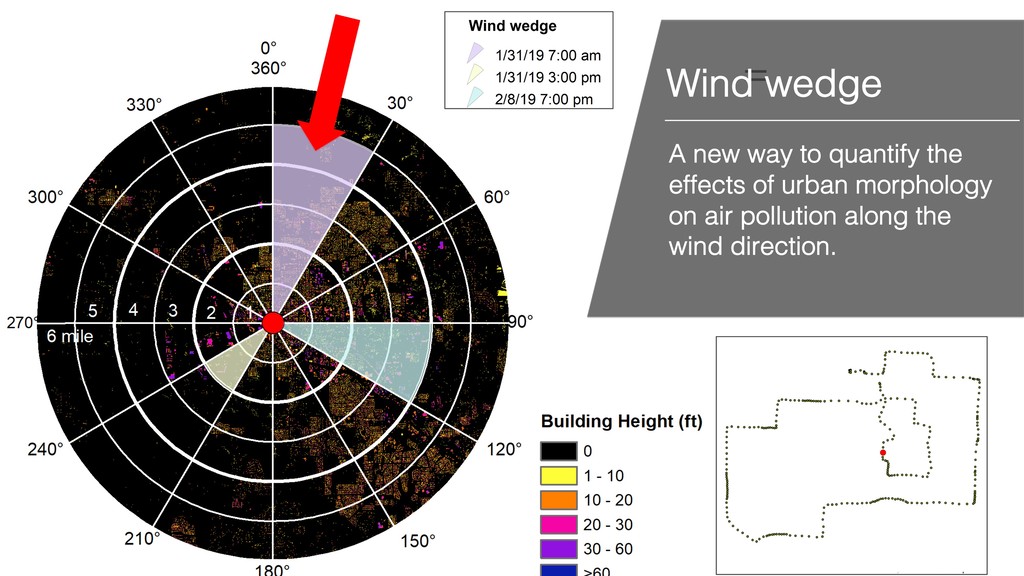
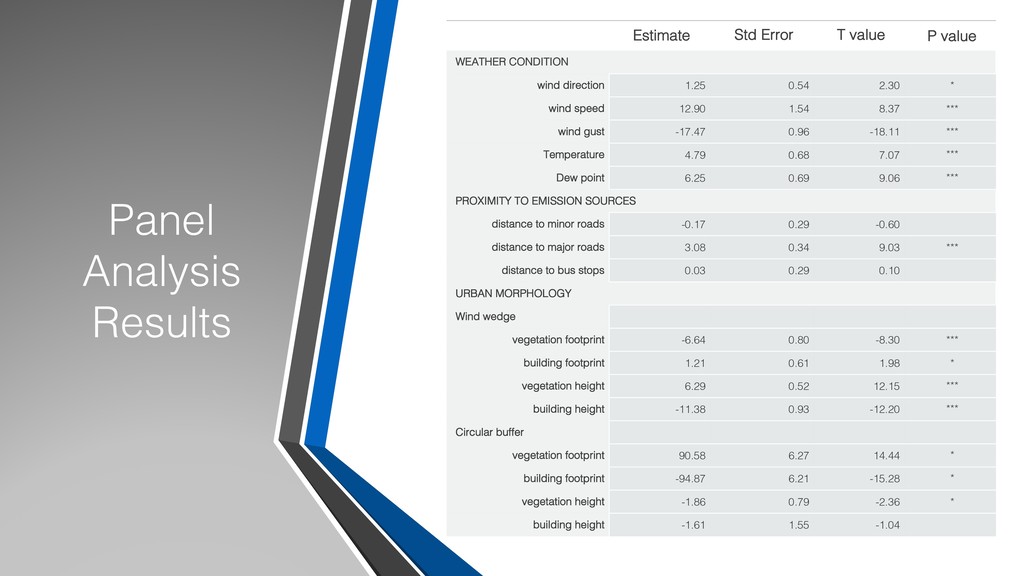
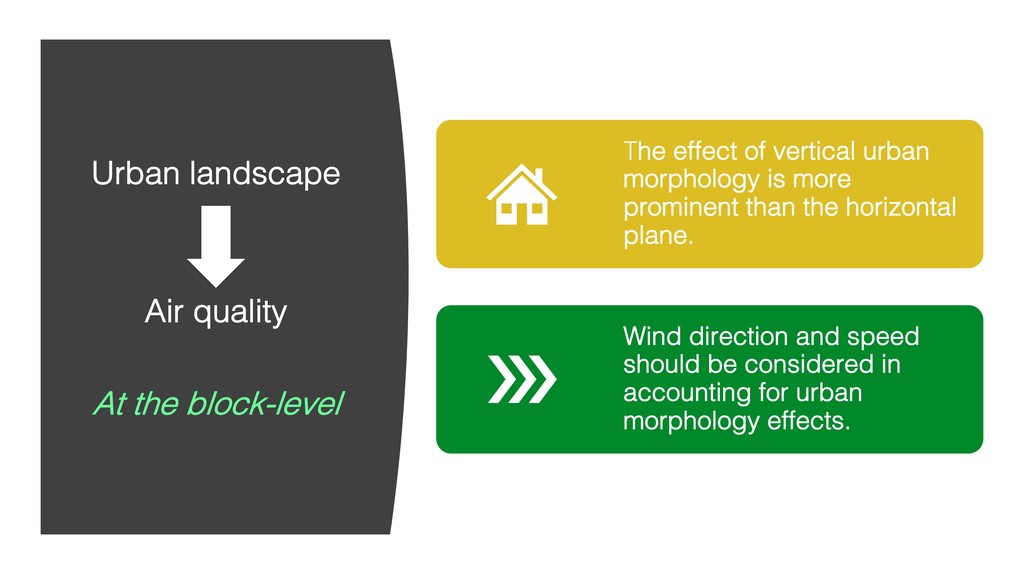
    vertical urban morphology is more prominent than the horizontal plane. Wind direction and speed should be considered in accounting for urban morphology effects.
  10. • With Urbanization Environmental pollution Health effects Socioeconomic features Urban&Air

    Urban&Health Health Inequity Environmental Justice We aim to achieve: Personal exposure assessment
  11. Environmental justice: (EPA definition): the fair treatment and meaningful involvement

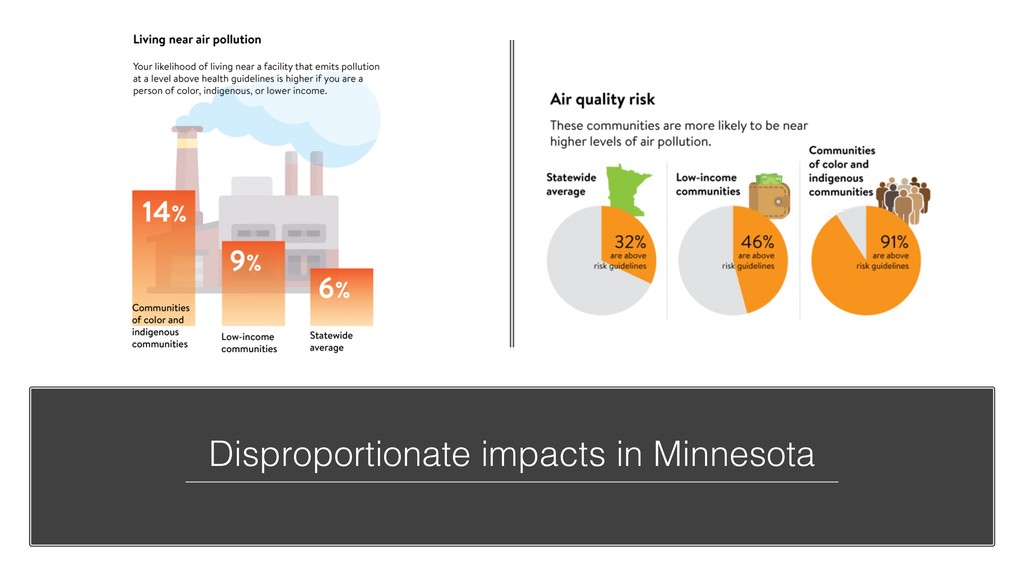
    of all people regardless of race, color, national origin, or income with respect to the development, implementation, and enforcement of environmental laws, regulations, and policies.
  12. 1) its performance has been tested by AQ-SPEC; 2) it

    has two exact same sensors that allow self-calibration; 3) all data are publicly available