Everyone has some belief that education affects the economy, both for the individual student and society. This presentation provides evidence of the linkage between education and the economy with a particular context for Iowa.
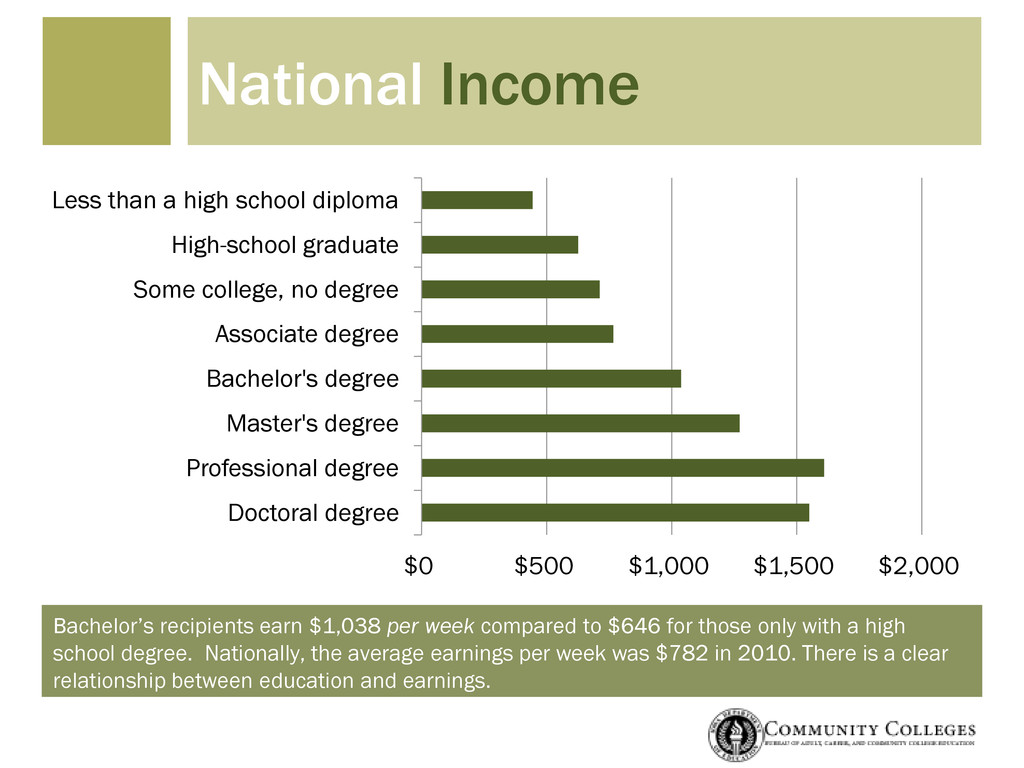
those only with a high school degree. Nationally, the average earnings per week was $782 in 2010. There is a clear relationship between education and earnings. National Income $0 $500 $1,000 $1,500 $2,000 Doctoral degree Professional degree Master's degree Bachelor's degree Associate degree Some college, no degree High-school graduate Less than a high school diploma
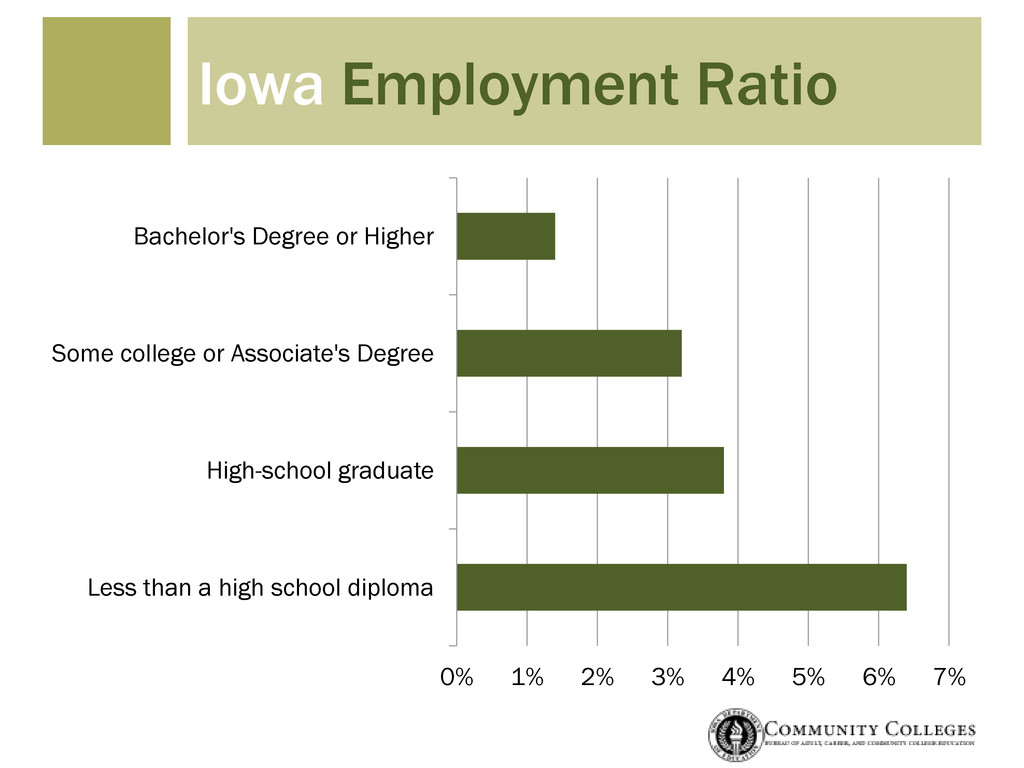
by stopping their job search. The “employment rate” accounts for this by calculating the percentage of people who are employed, regardless of their labor market status. Iowa Employment Ratio 0% 20% 40% 60% 80% 100% Less than a high school diploma High-school graduate Some college or Associate's Degree Bachelor's Degree or Higher
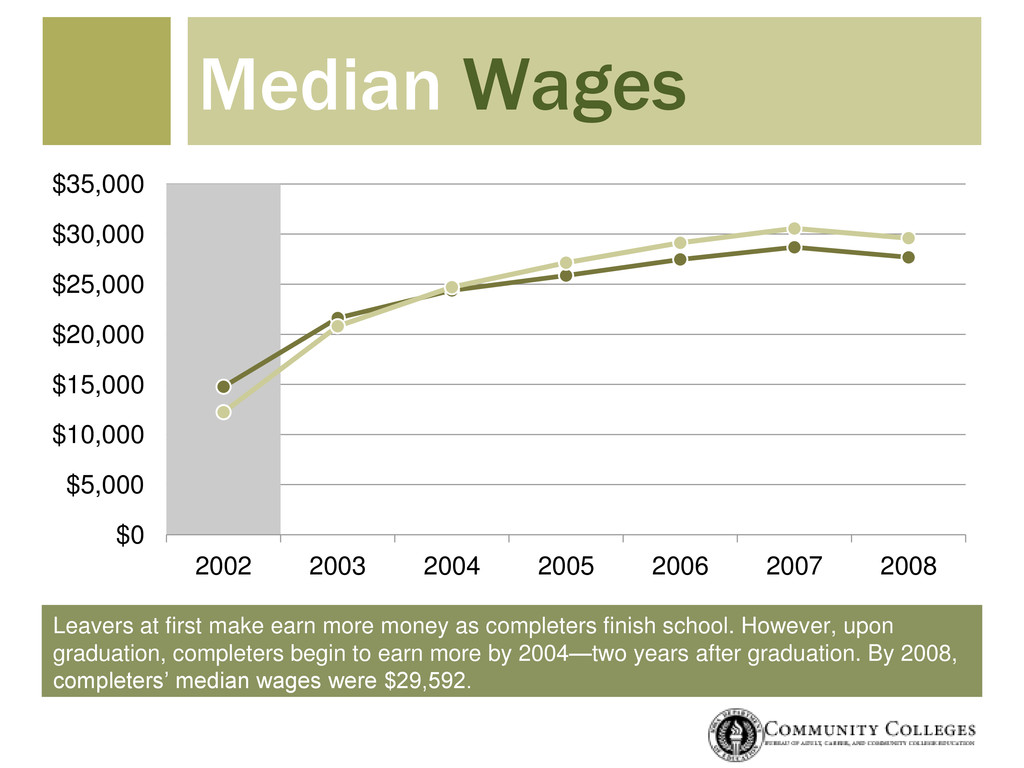
completers finish school. However, upon graduation, completers begin to earn more by 2004—two years after graduation. By 2008, completers’ median wages were $29,592. $0 $5,000 $10,000 $15,000 $20,000 $25,000 $30,000 $35,000 2002 2003 2004 2005 2006 2007 2008
any other group. By 2003, median earnings were $12,433. By 2008, earnings were $37,121—$9,446 higher than wages for leavers. It begins to reflect the career-oriented mission of career and technical education. $0 $5,000 $10,000 $15,000 $20,000 $25,000 $30,000 $35,000 $40,000 2002 2003 2004 2005 2006 2007 2008
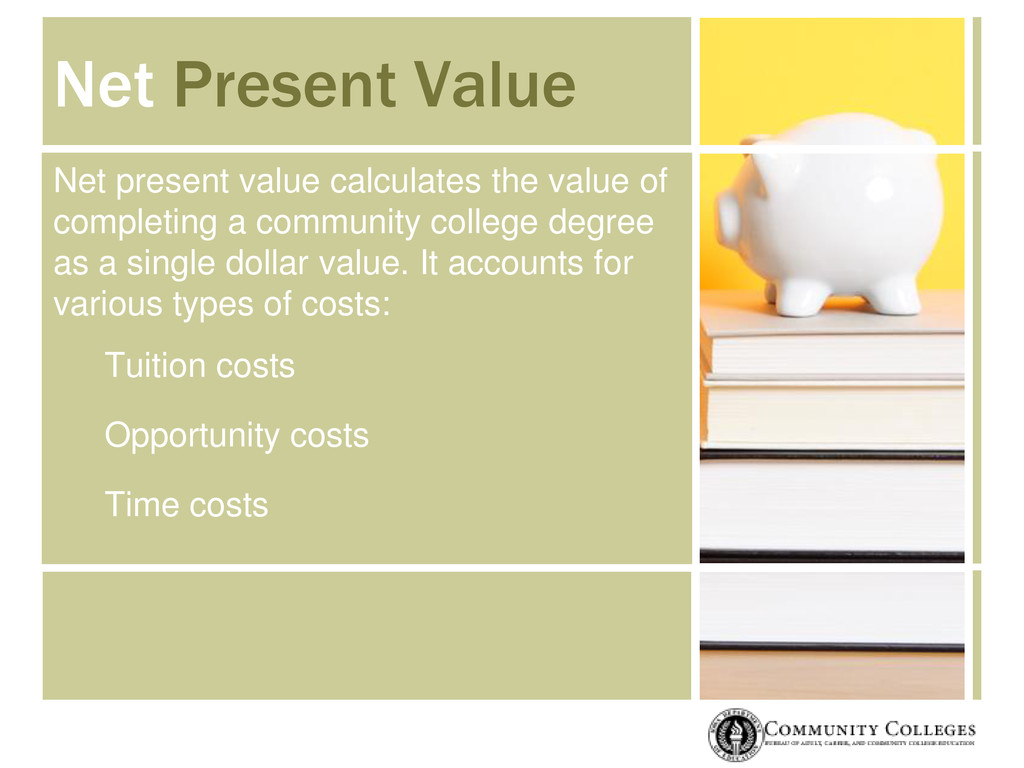
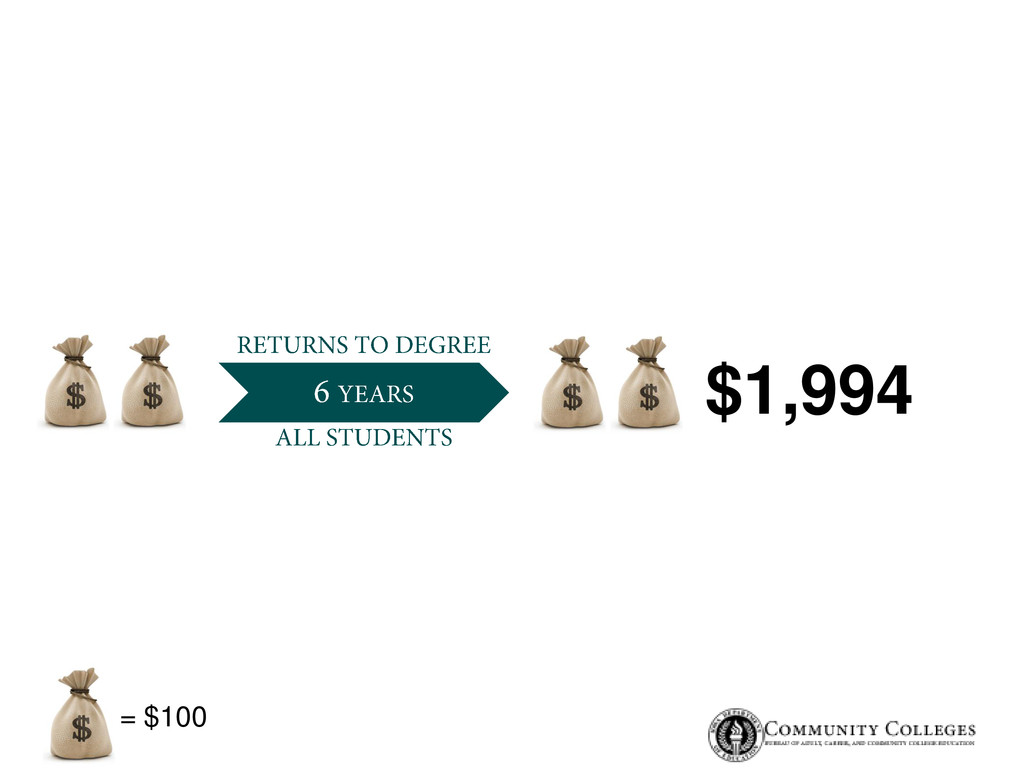
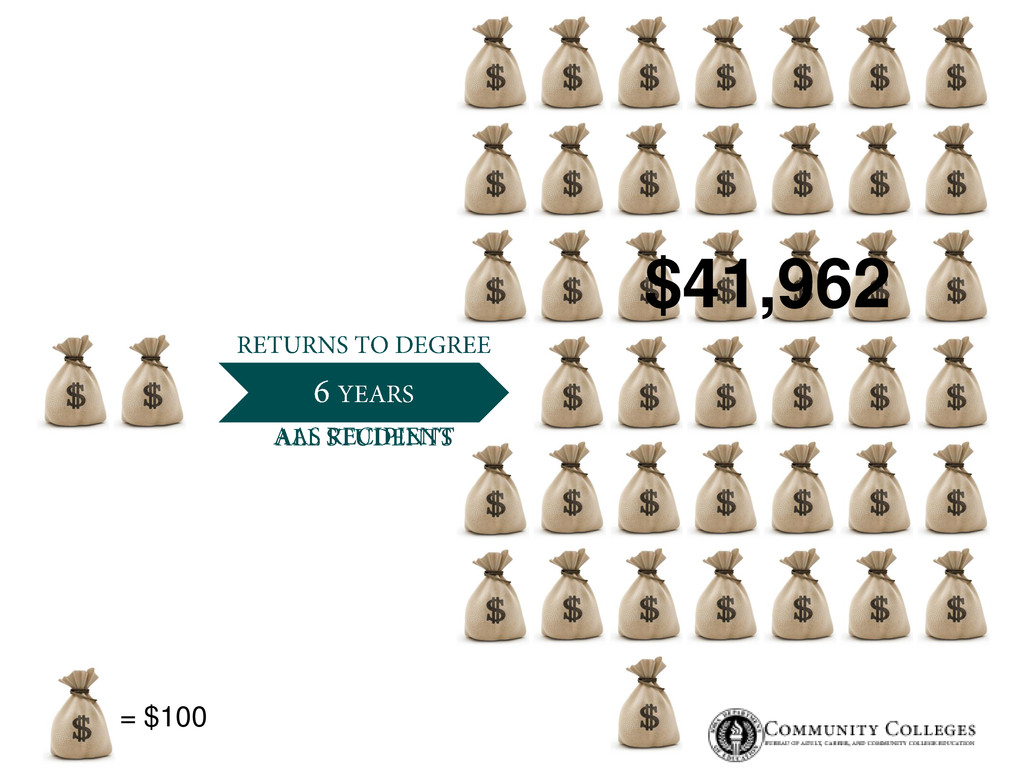
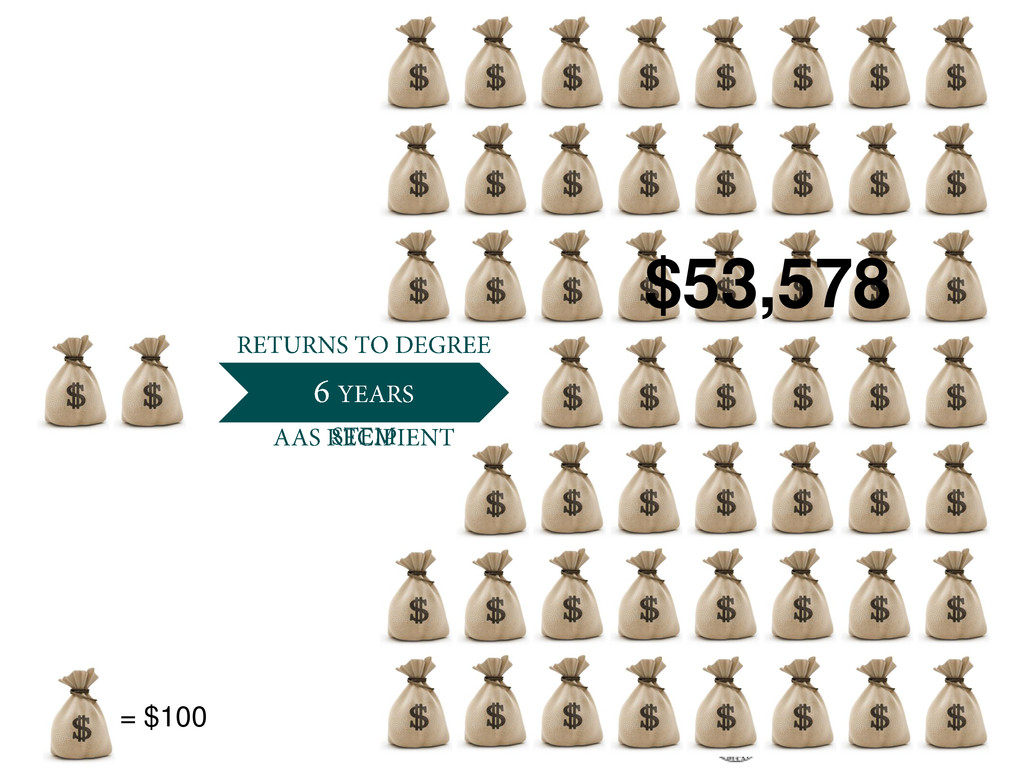
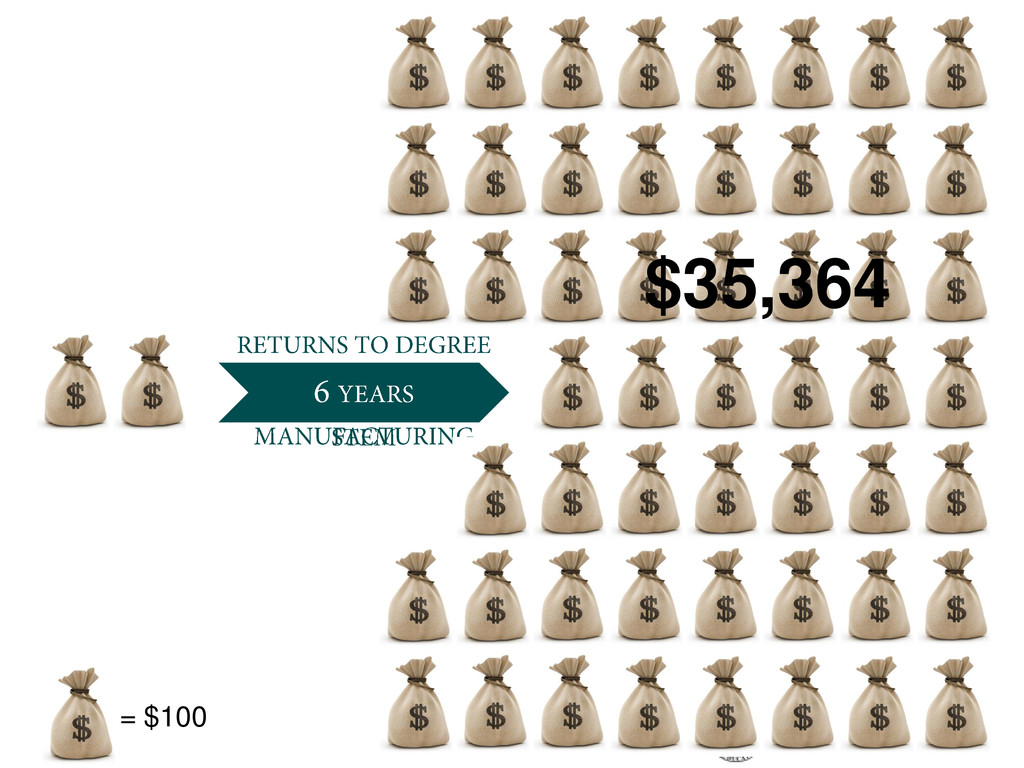
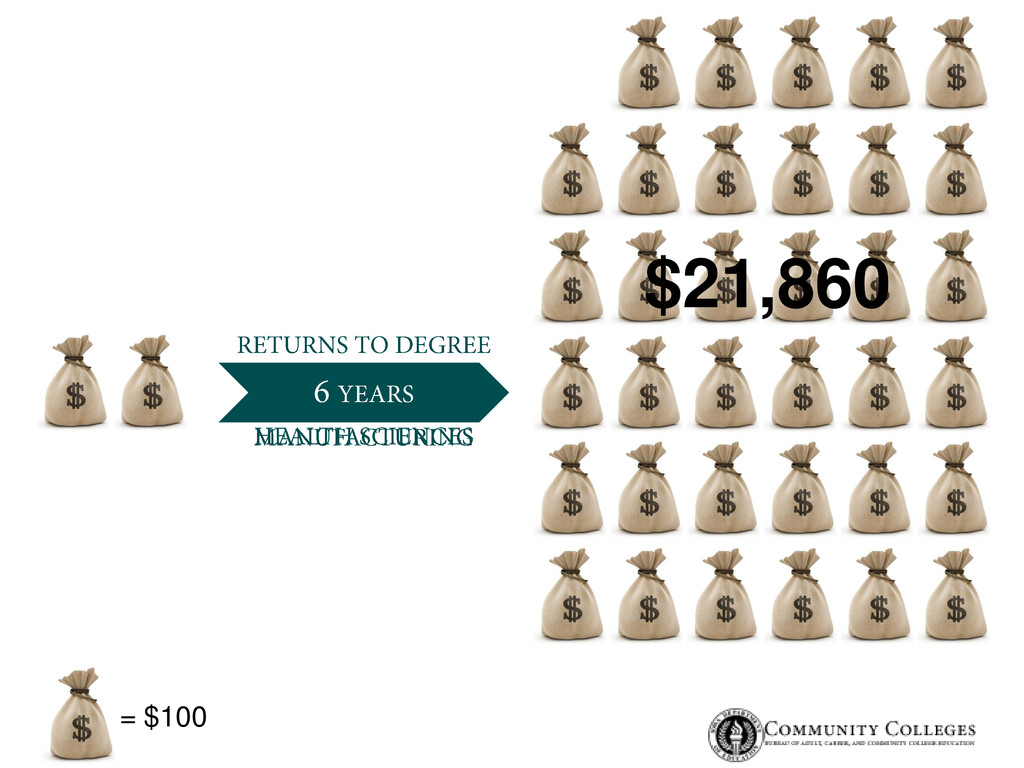
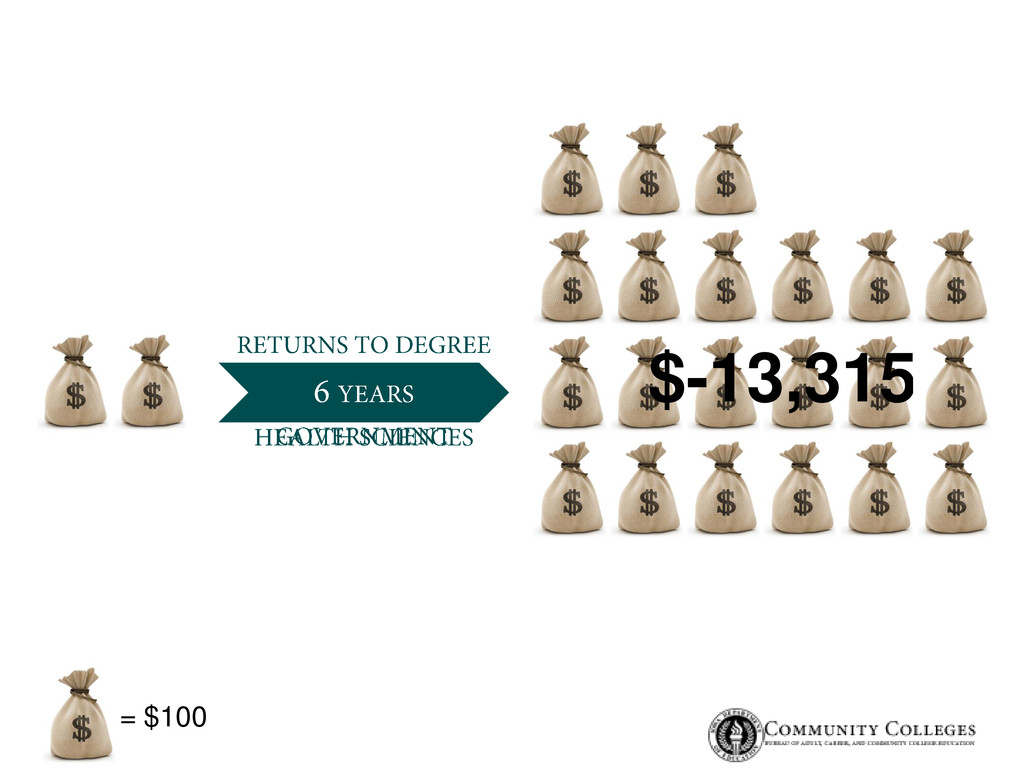
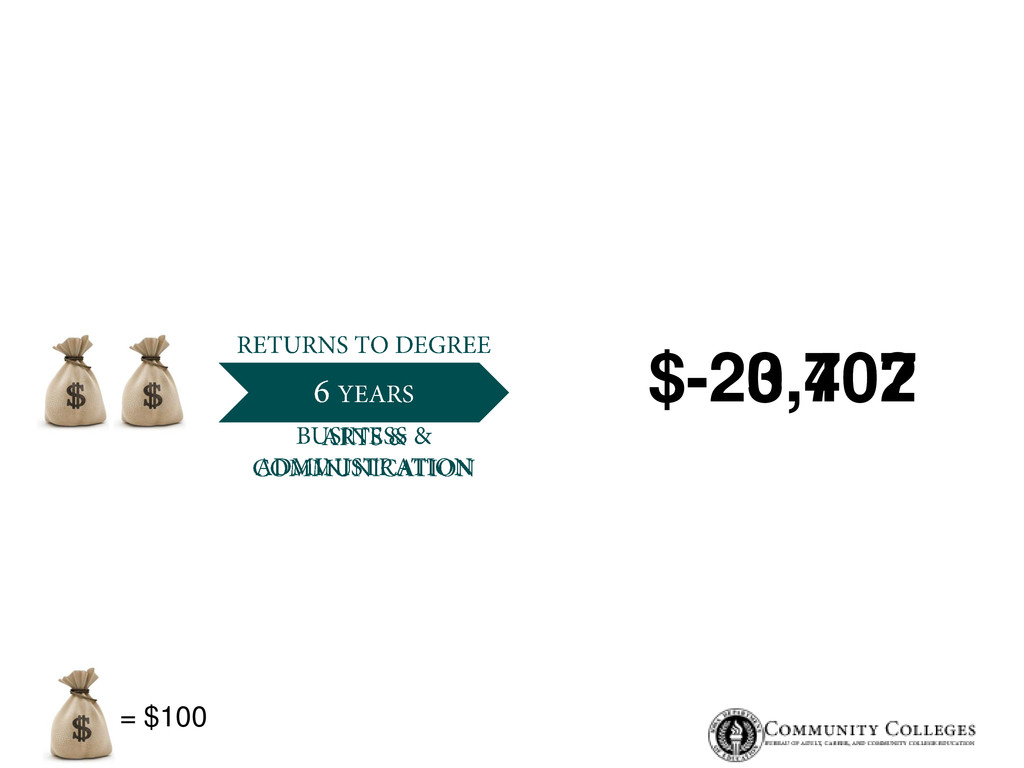
a community college degree as a single dollar value. It accounts for various types of costs: Tuition costs Opportunity costs Time costs Net Present Value
www.educateiowa.gov www.bls.gov/emp/ep_chart_001.htm www.economagic.com The Annual Condition of Iowa’s Community Colleges 2009, Iowa Department of Education Economic Returns & Career Transitions for Iowa Community College Students, Iowa Department of Education and Iowa Workforce Development U.S Census Bureau, 2007-2009 American Community Survey Bureau of Labor Statistics, Current Population Survey
![Tom SCHENK JR. Iowa Department of Education (515) 281-3753 [email protected]](https://files.speakerdeck.com/presentations/4e80f7a6d209e10060000a2e/slide_28.jpg)