Longitudinal Data and Higher Education Accountability
Initially presented at the Community College Leadership and Policy Brown Bag Seminar at Iowa State University in Ames, Iowa on September 27, 2009. Recording of presentation here: http://www.cclp.hs.iastate.edu/bb_schenk.html
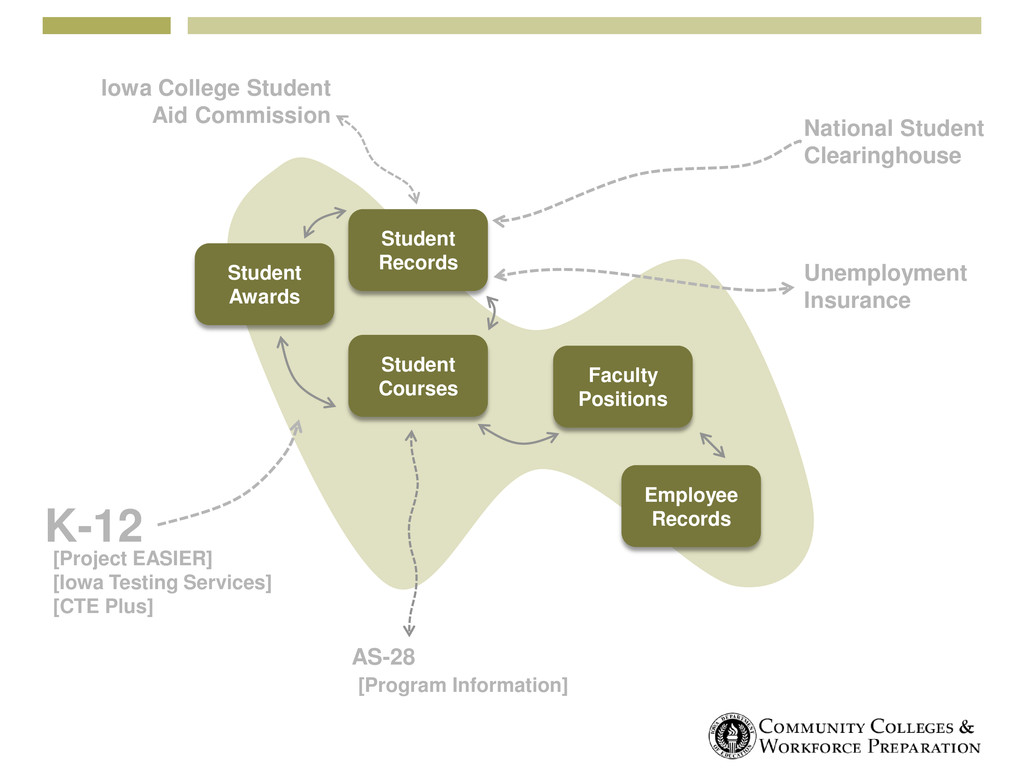
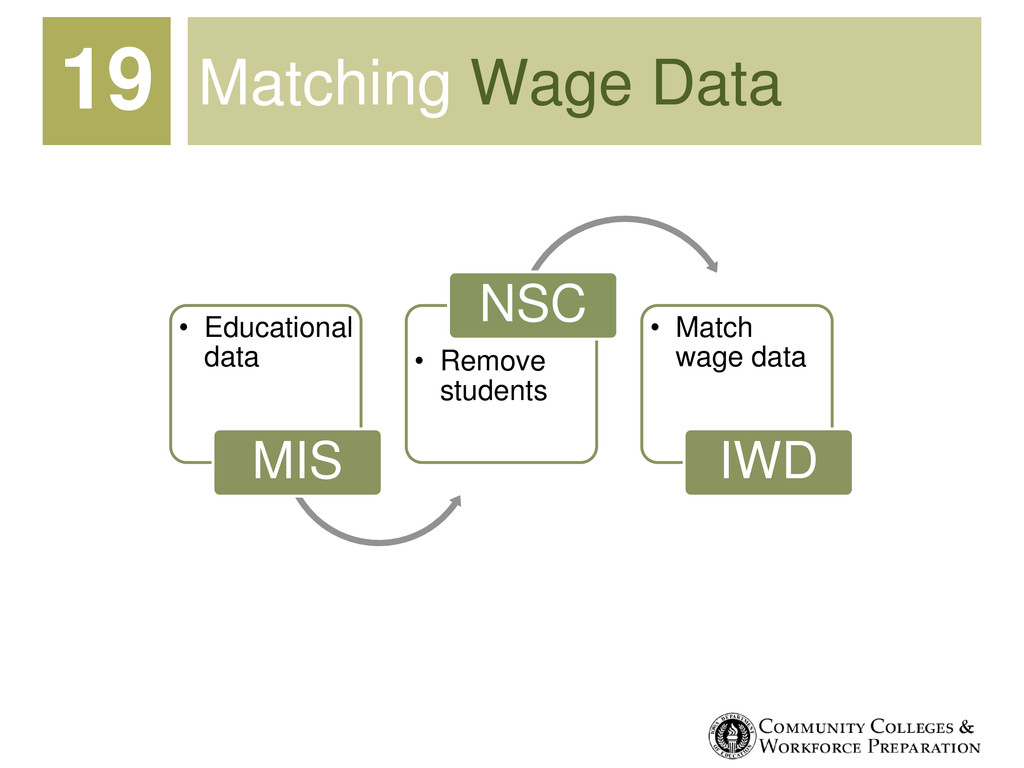
basis. Includes multiple jobs. Excludes workers in some sectors (e.g., military). Does not include hourly wages or full-time status. Only includes employees within Iowa. Unemployment Insurance 18
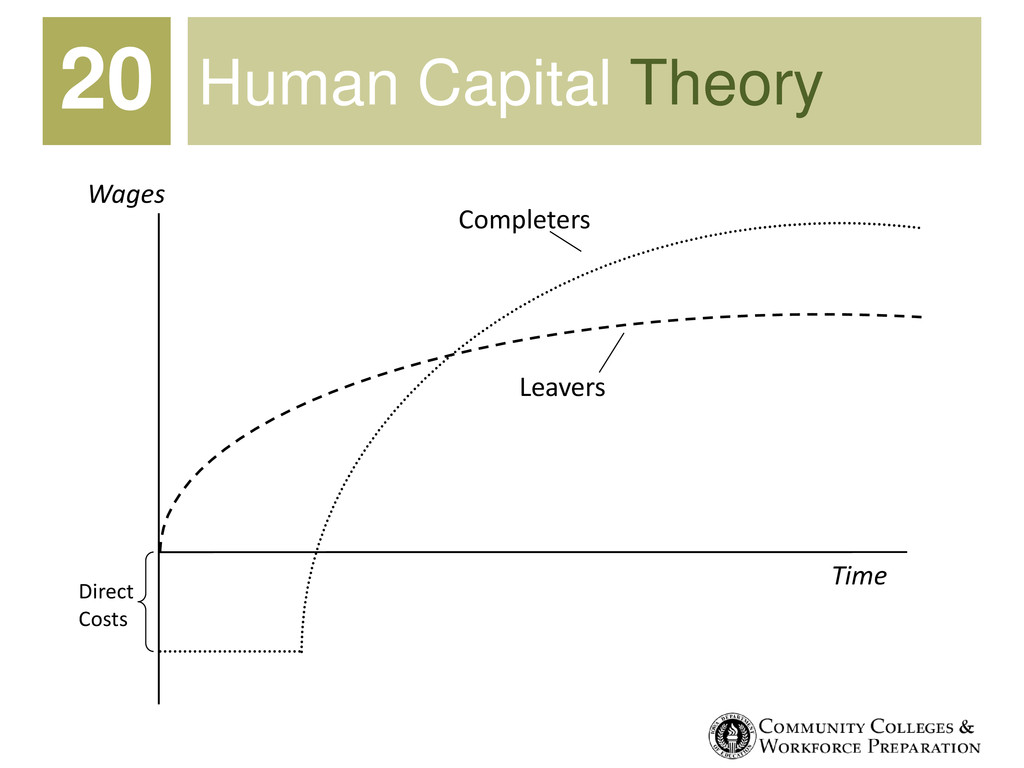
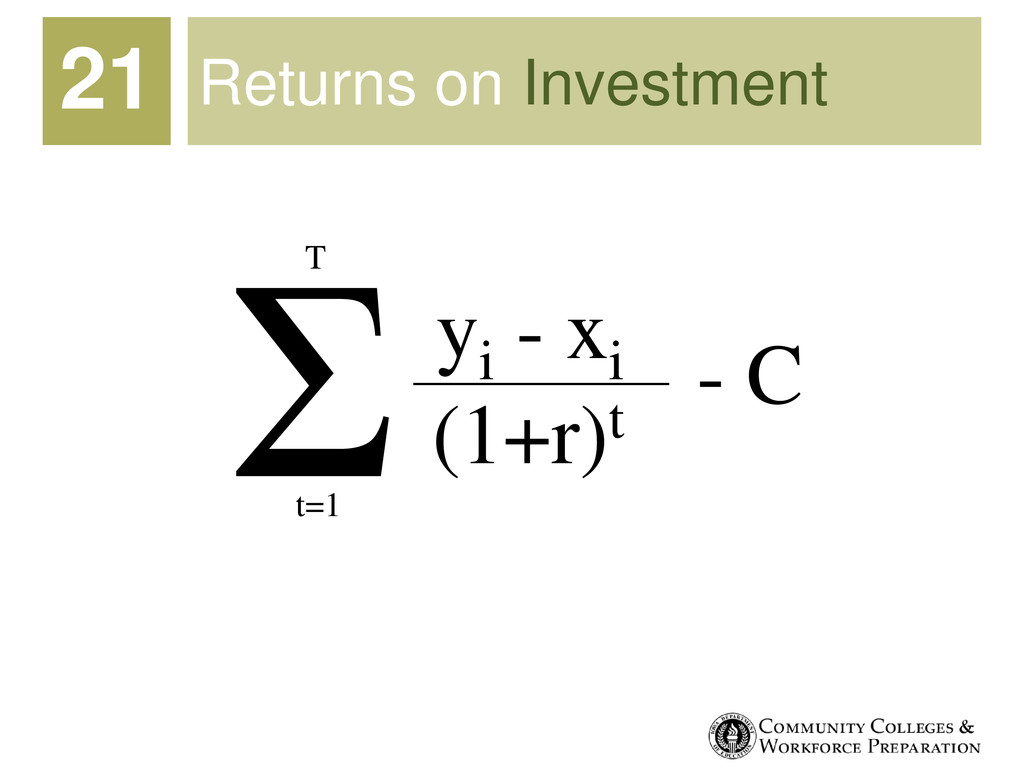
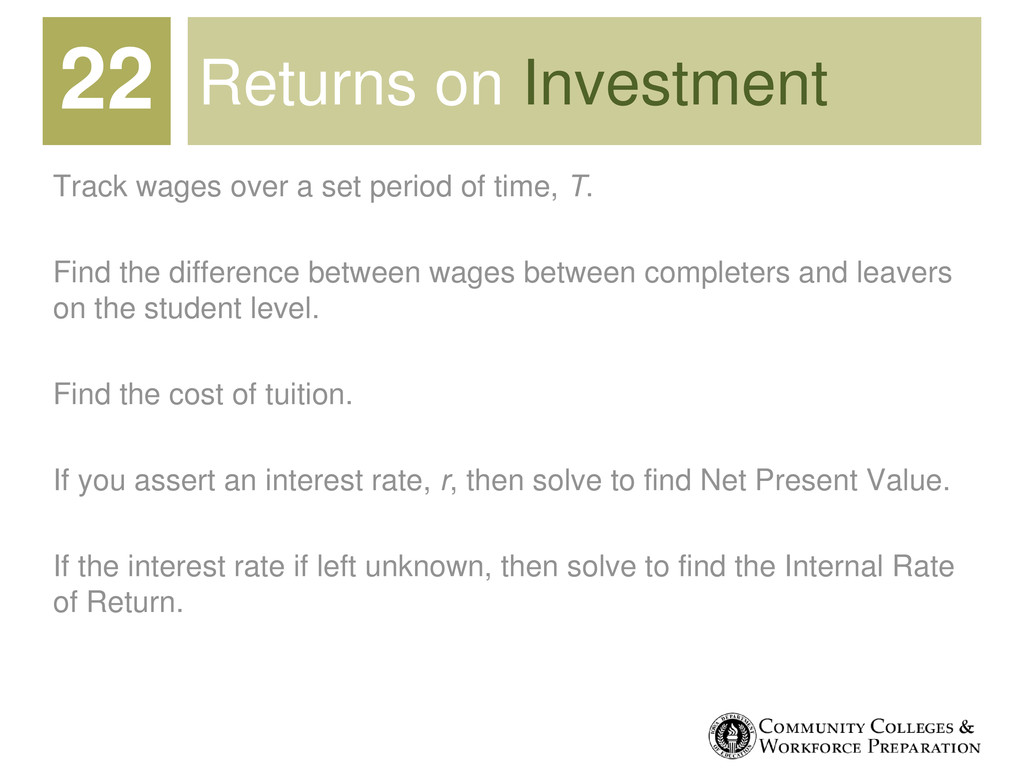
time, T. Find the difference between wages between completers and leavers on the student level. Find the cost of tuition. If you assert an interest rate, r, then solve to find Net Present Value. If the interest rate if left unknown, then solve to find the Internal Rate of Return. 22
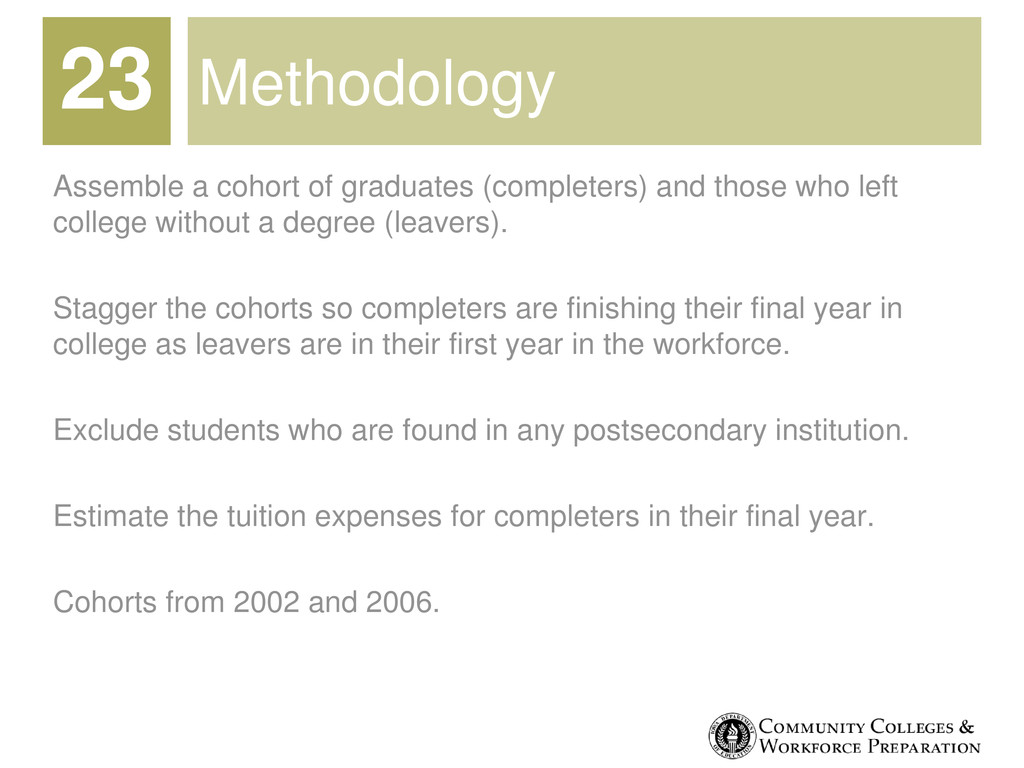
left college without a degree (leavers). Stagger the cohorts so completers are finishing their final year in college as leavers are in their first year in the workforce. Exclude students who are found in any postsecondary institution. Estimate the tuition expenses for completers in their final year. Cohorts from 2002 and 2006. 23
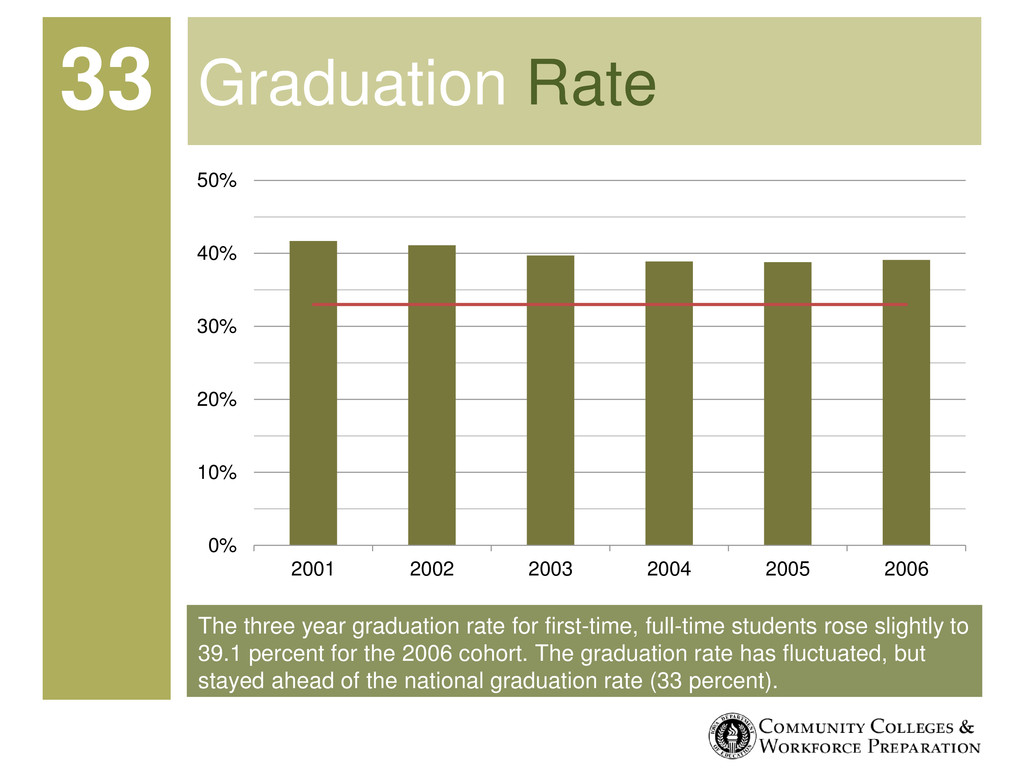
slightly to 39.1 percent for the 2006 cohort. The graduation rate has fluctuated, but stayed ahead of the national graduation rate (33 percent). Graduation Rate 33 0% 10% 20% 30% 40% 50% 2001 2002 2003 2004 2005 2006
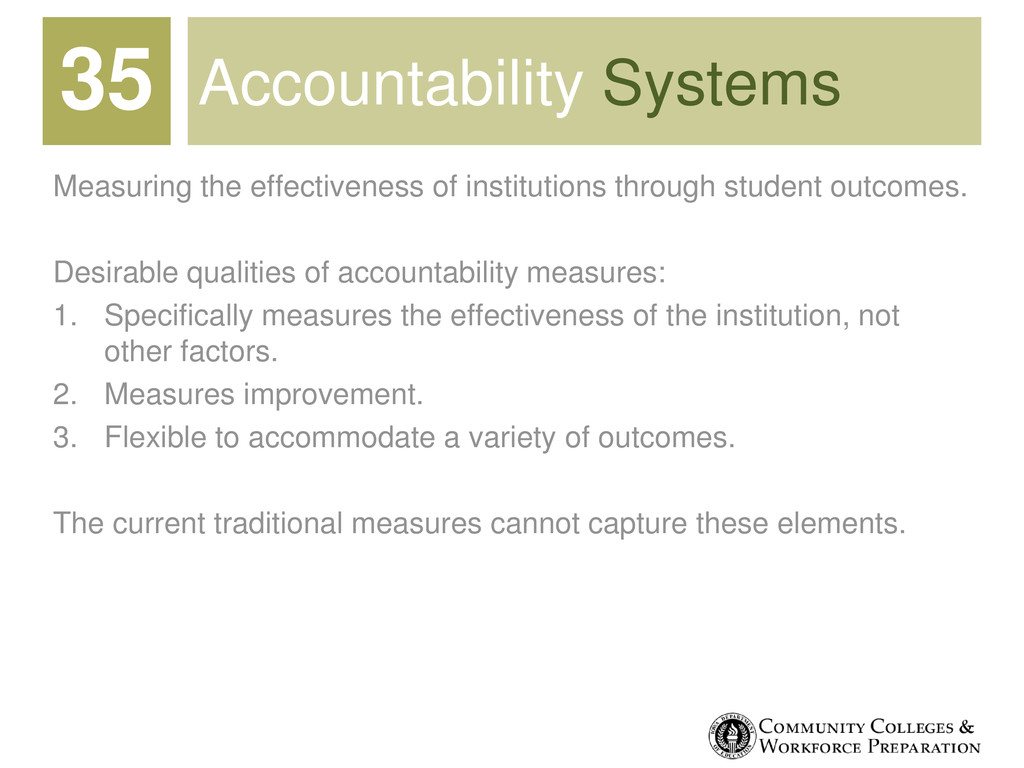
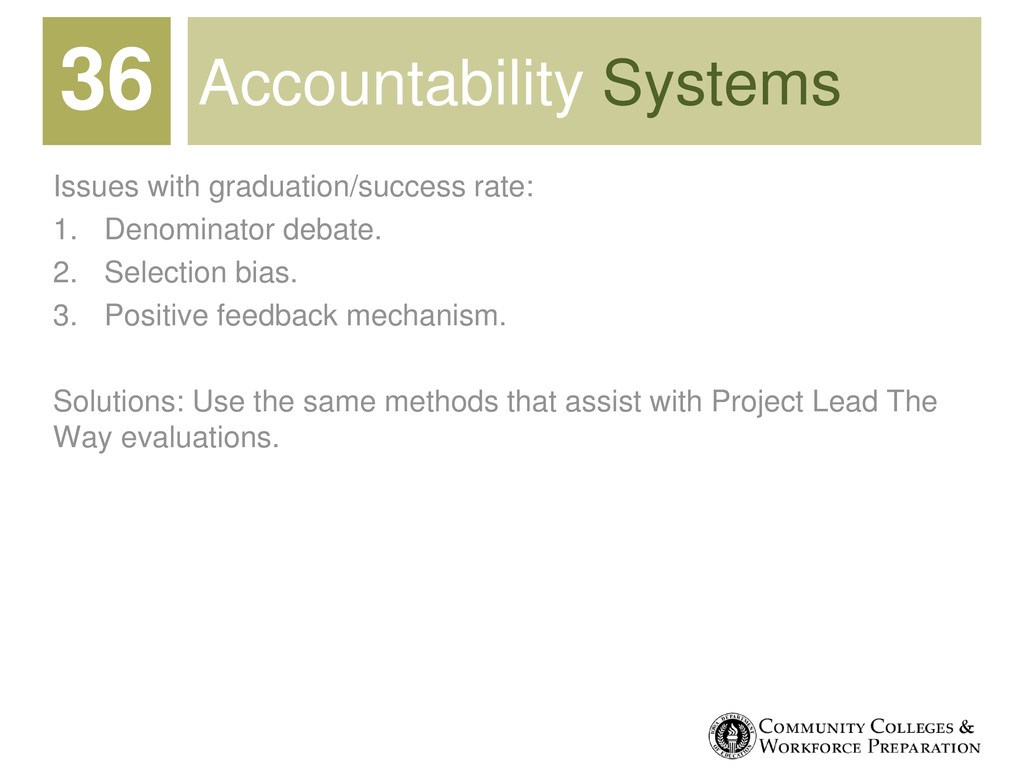
Desirable qualities of accountability measures: 1. Specifically measures the effectiveness of the institution, not other factors. 2. Measures improvement. 3. Flexible to accommodate a variety of outcomes. The current traditional measures cannot capture these elements. 35
Education. Education data can be obtained from the Department of Education, other data (e.g., UI records) will need special permission. Data is distributed de-identified and must be returned or destroyed at the completion of the research study. Obtaining data is relatively low-cost, nominal fee (<$100) for a secure flash drive. 40