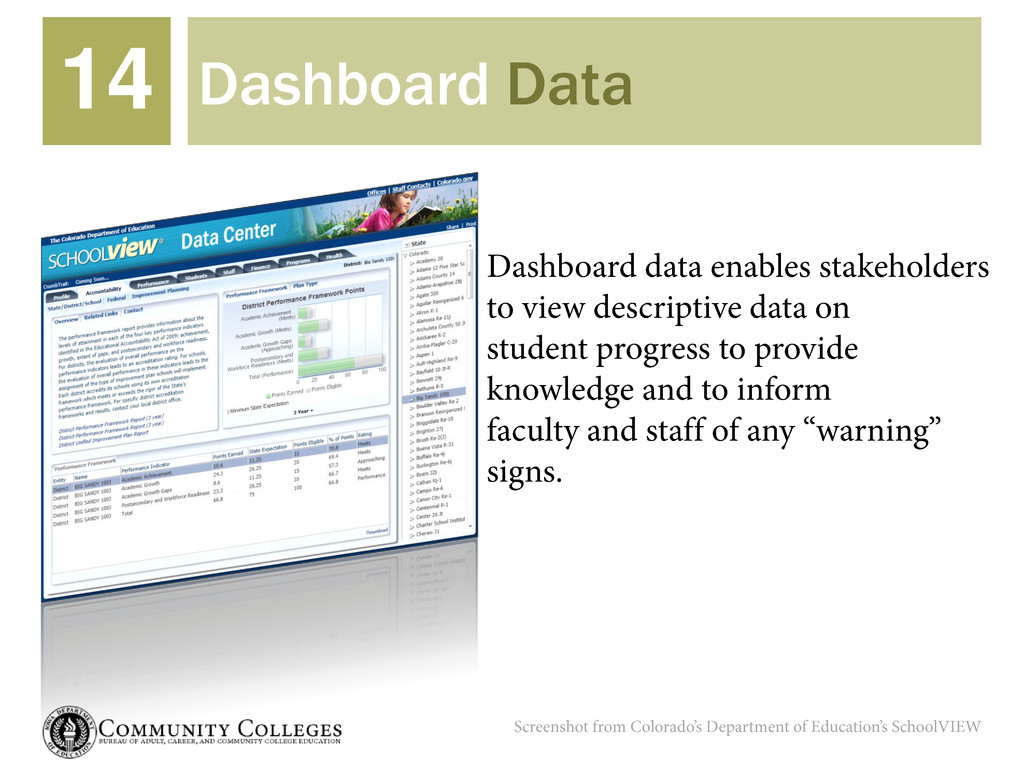
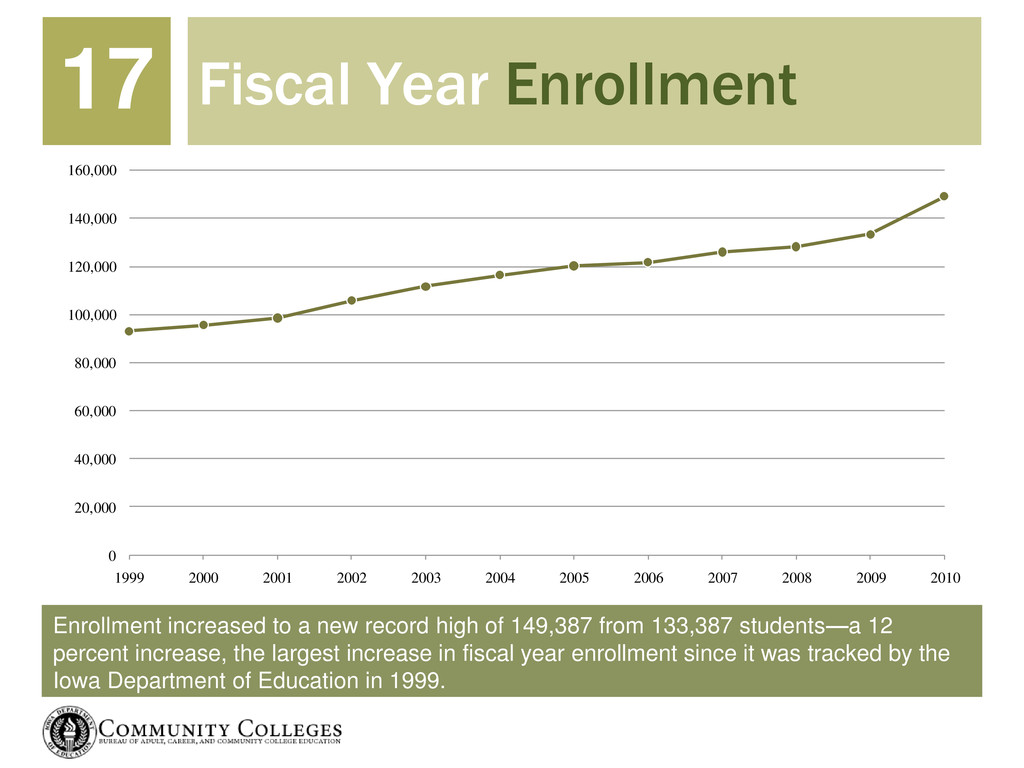
133,387 students—a 12 percent increase, the largest increase in fiscal year enrollment since it was tracked by the Iowa Department of Education in 1999. Fiscal Year Enrollment 17 0 20,000 40,000 60,000 80,000 100,000 120,000 140,000 160,000 1999 2000 2001 2002 2003 2004 2005 2006 2007 2008 2009 2010
type. Most of these students continue onto a 4-year institution after leaving the college. CTE is the second largest with 31 percent of enrollment. Program Types 19
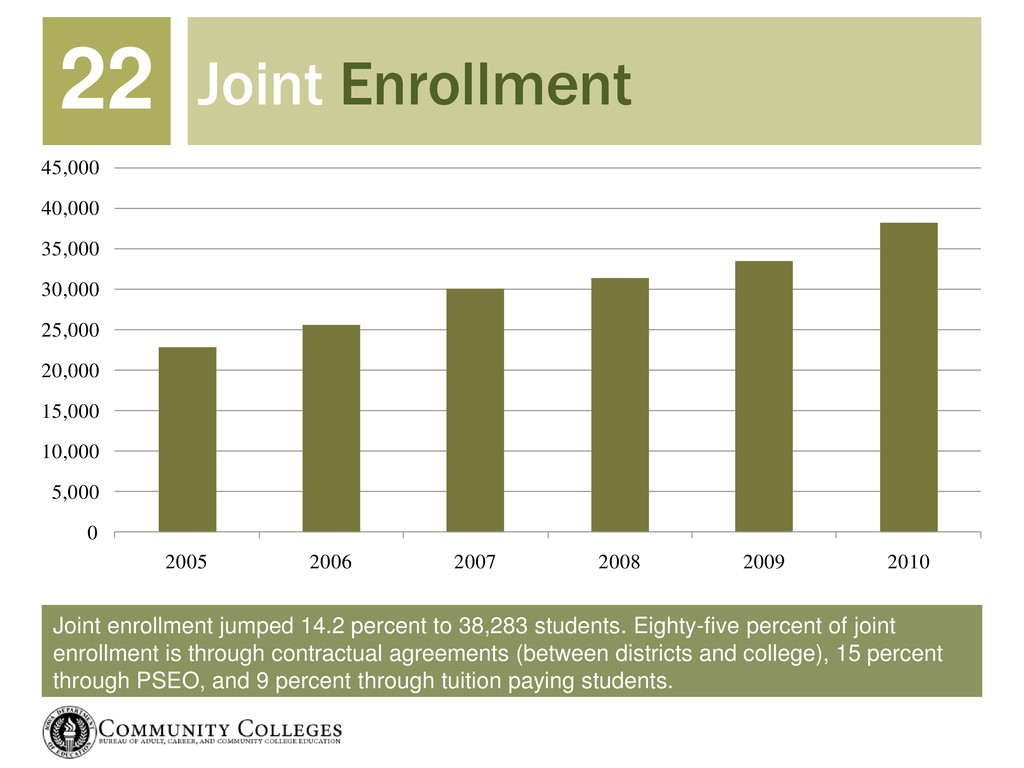
a third were juniors. Overall, more than 92 percent of joint enrollees were upperclassmen. Grade Level 23 0% 10% 20% 30% 40% 50% 60% 70% 9th Grade 10th Grade 11th Grade 12th Grade 2008
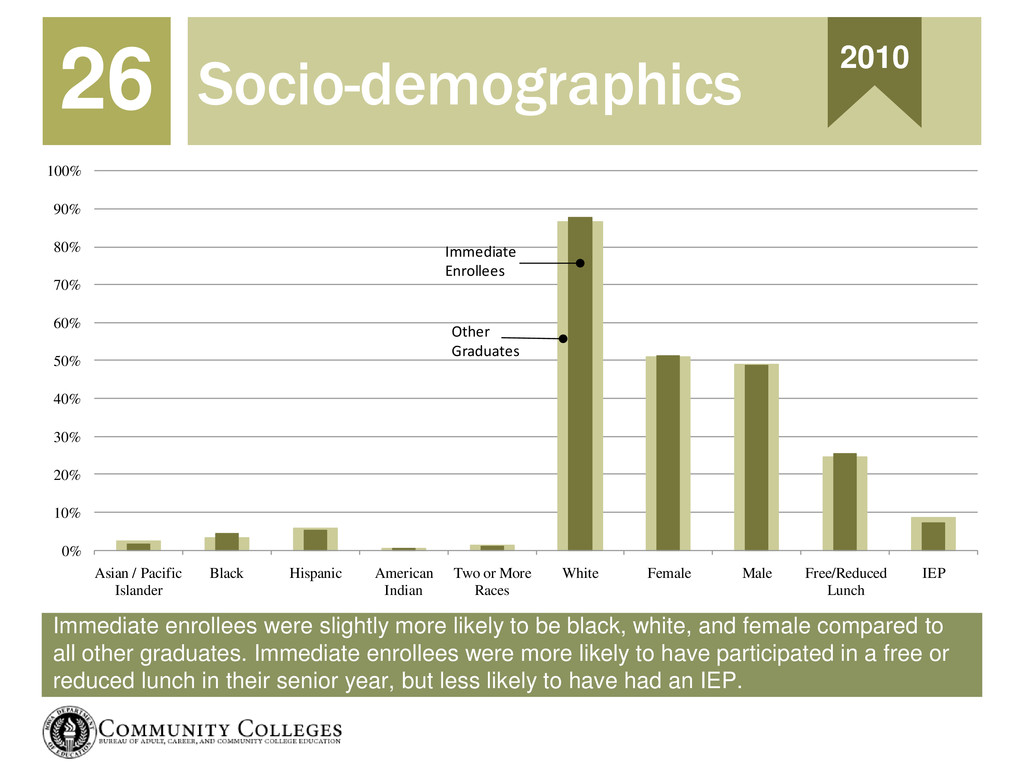
and female compared to all other graduates. Immediate enrollees were more likely to have participated in a free or reduced lunch in their senior year, but less likely to have had an IEP. Socio-demographics 26 2010 0% 10% 20% 30% 40% 50% 60% 70% 80% 90% 100% Asian / Pacific Islander Black Hispanic American Indian Two or More Races White Female Male Free/Reduced Lunch IEP Immediate Enrollees Other Graduates
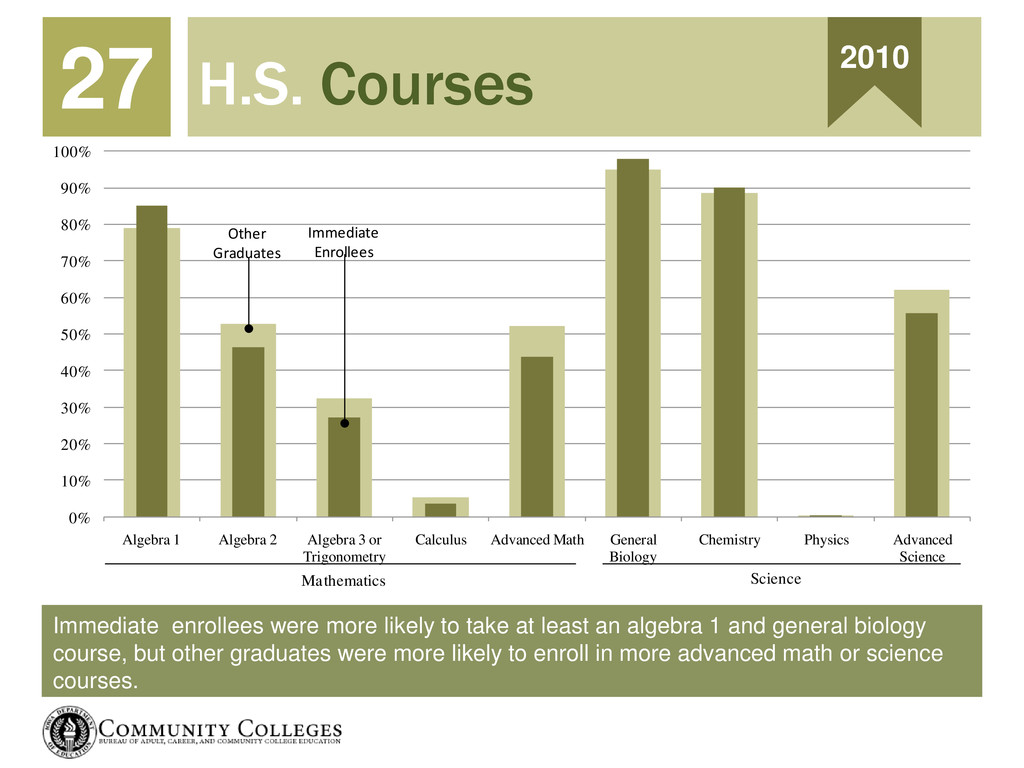
algebra 1 and general biology course, but other graduates were more likely to enroll in more advanced math or science courses. H.S. Courses 27 2010 0% 10% 20% 30% 40% 50% 60% 70% 80% 90% 100% Algebra 1 Algebra 2 Algebra 3 or Trigonometry Calculus Advanced Math General Biology Chemistry Physics Advanced Science Mathematics Science Immediate Enrollees Other Graduates
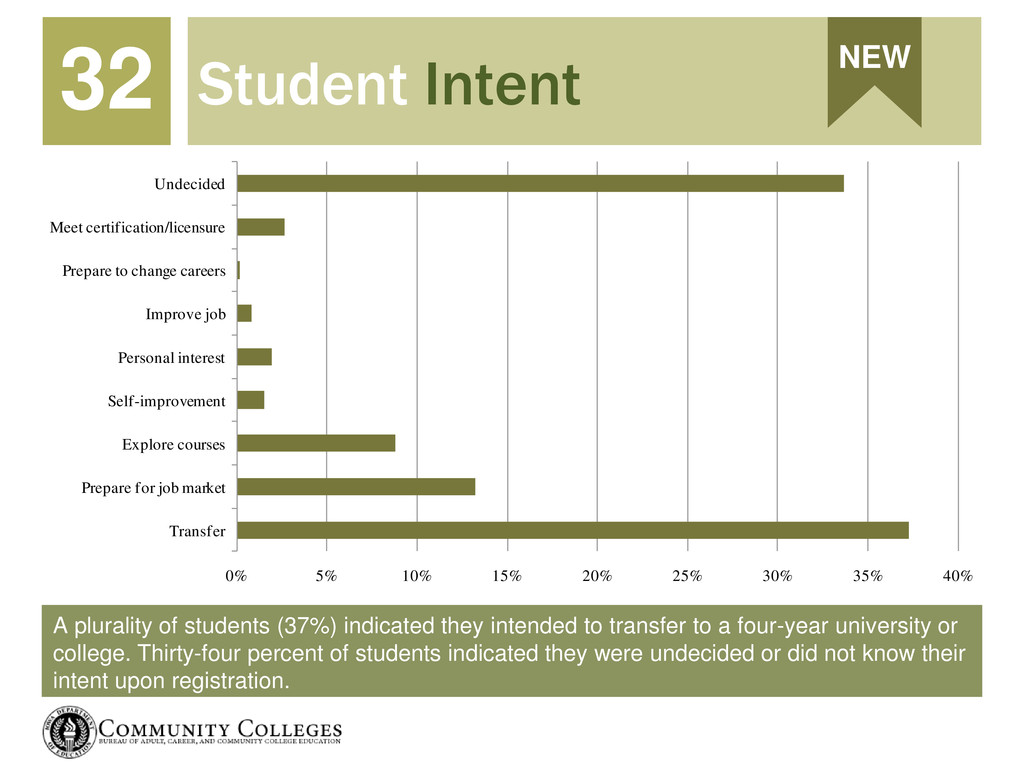
to a four-year university or college. Thirty-four percent of students indicated they were undecided or did not know their intent upon registration. Student Intent 32 0% 5% 10% 15% 20% 25% 30% 35% 40% Transfer Prepare for job market Explore courses Self-improvement Personal interest Improve job Prepare to change careers Meet certification/licensure Undecided NEW
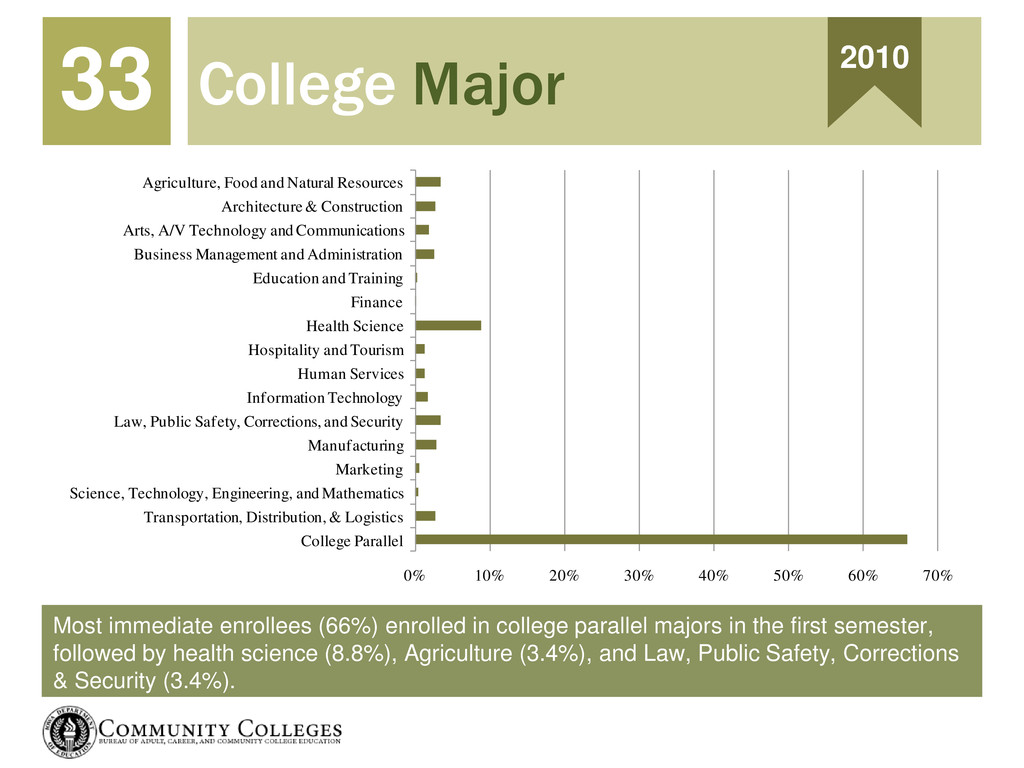
the first semester, followed by health science (8.8%), Agriculture (3.4%), and Law, Public Safety, Corrections & Security (3.4%). College Major 33 2010 0% 10% 20% 30% 40% 50% 60% 70% College Parallel Transportation, Distribution, & Logistics Science, Technology, Engineering, and Mathematics Marketing Manufacturing Law, Public Safety, Corrections, and Security Information Technology Human Services Hospitality and Tourism Health Science Finance Education and Training Business Management and Administration Arts, A/V Technology and Communications Architecture & Construction Agriculture, Food and Natural Resources
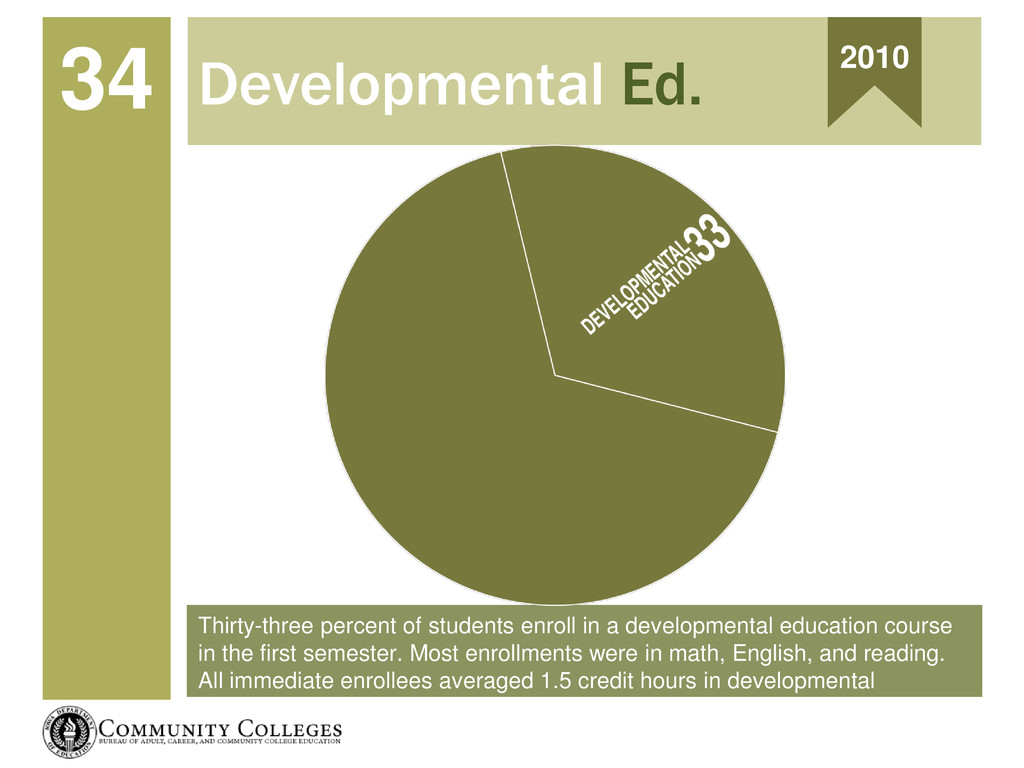
in the first semester. Most enrollments were in math, English, and reading. All immediate enrollees averaged 1.5 credit hours in developmental education. Developmental Ed. 34 2010
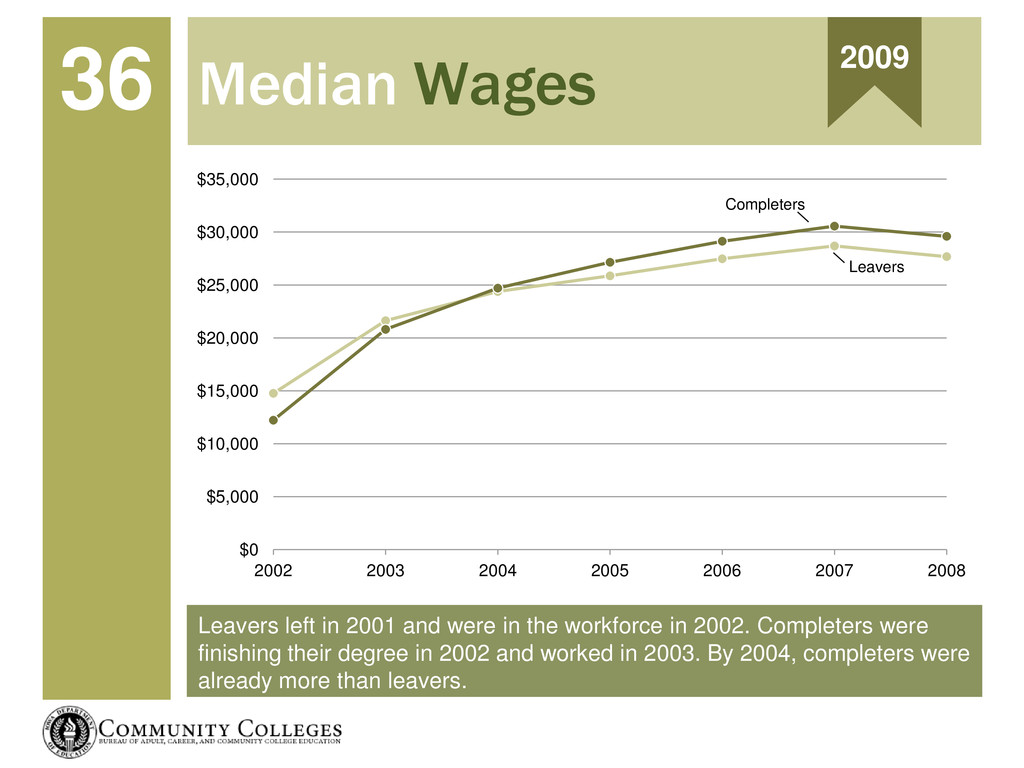
2002. Completers were finishing their degree in 2002 and worked in 2003. By 2004, completers were already more than leavers. Median Wages 36 $0 $5,000 $10,000 $15,000 $20,000 $25,000 $30,000 $35,000 2002 2003 2004 2005 2006 2007 2008 Completers Leavers 2009
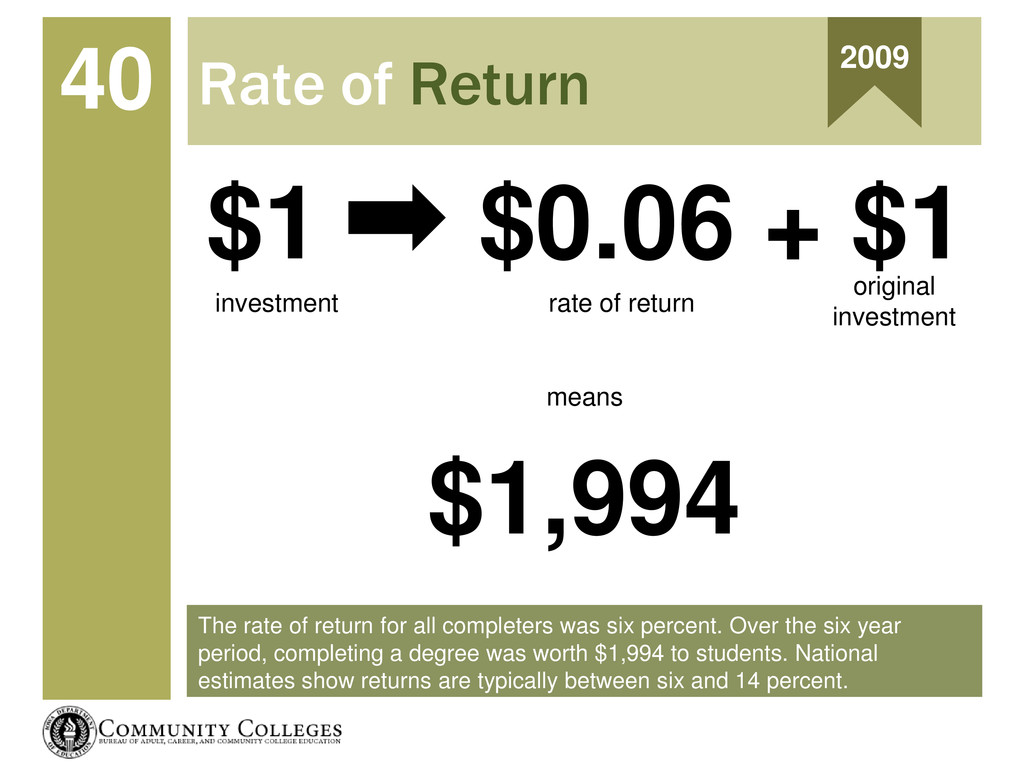
Over the six year period, completing a degree was worth $1,994 to students. National estimates show returns are typically between six and 14 percent. Rate of Return 40 2009 $1 $0.06 + $1 investment rate of return original investment $1,994 means
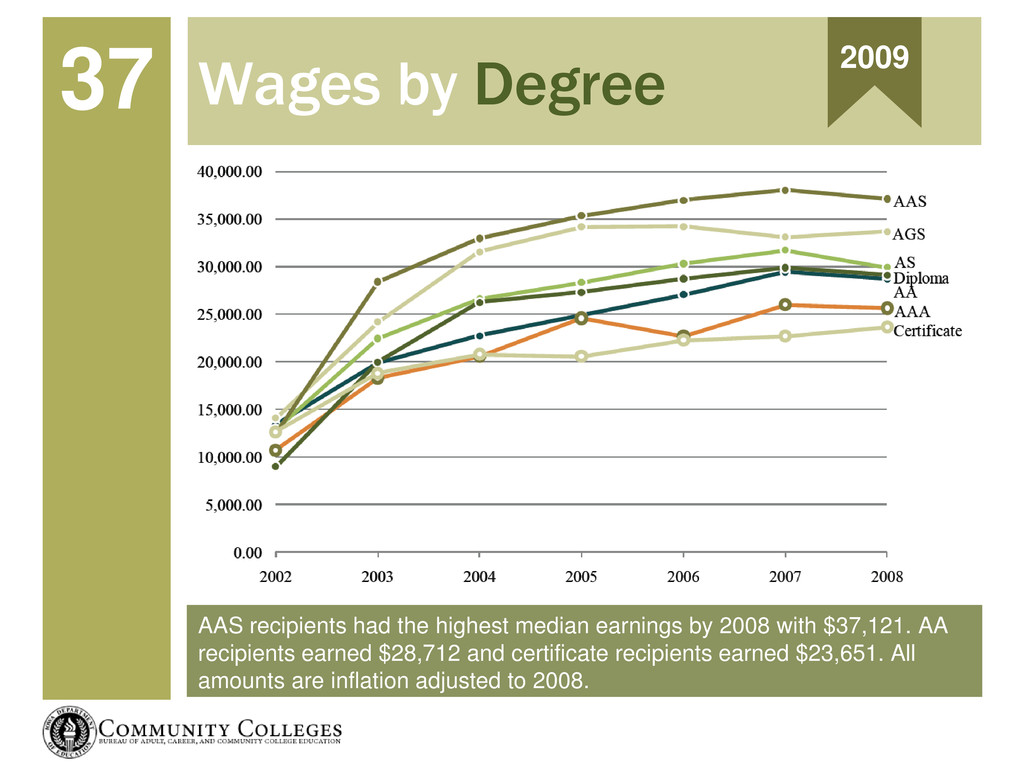
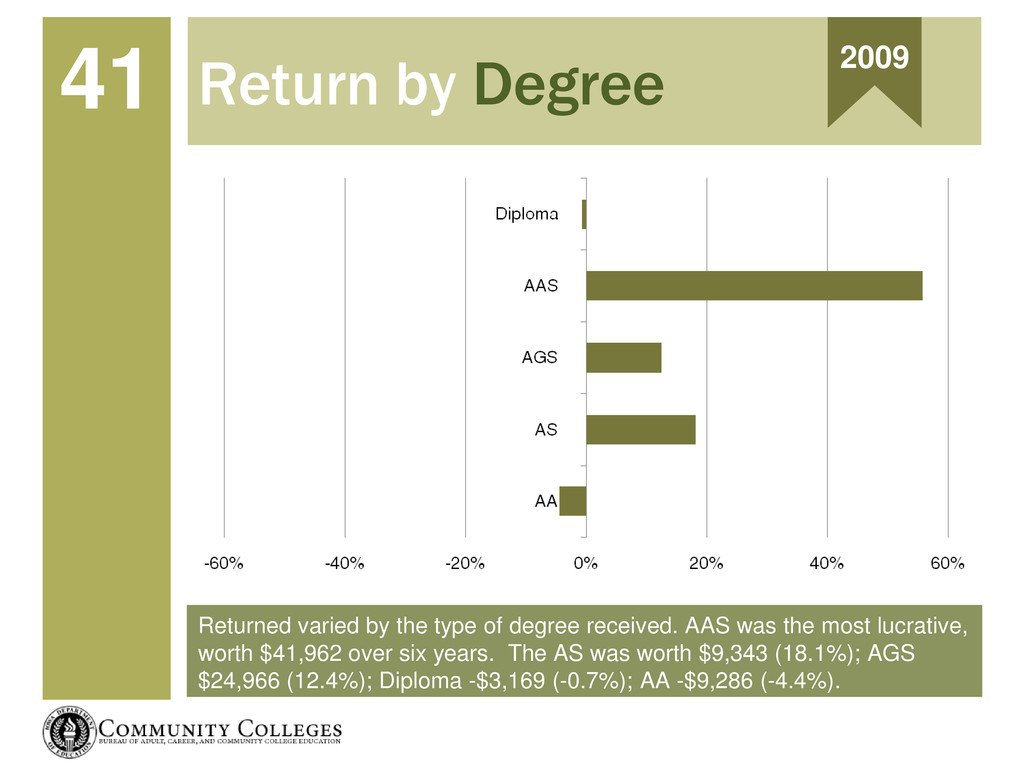
the most lucrative, worth $41,962 over six years. The AS was worth $9,343 (18.1%); AGS $24,966 (12.4%); Diploma -$3,169 (-0.7%); AA -$9,286 (-4.4%). Return by Degree 41 2009
www.educateiowa.gov www.educateiowa.gov/ccpublications/ www.dataqualitycampaign.org nces.ed.gov/programs/slds www.schoolview.org Cohen, Arthur & Florence B. Brawer (1996). The American Community College (3rd Ed.). Jossey-Bass: San Francisco. Juice Analytics. A Guide to Creating Dashboards People Love to Use “Data, data everywhere”, The Economist (2/15/2010) Voluntary Framework of Accountability: Preliminary Technical Manual v1.0. American Association of Community Colleges (1/25/11).
![Tom SCHENK JR. Iowa Department of Education (515) 281-3753 [email protected]](https://files.speakerdeck.com/presentations/4fc98ac6af6a02001f028180/slide_43.jpg)