The Annual Condition of Iowa's Community Colleges: 2010
A summary of Iowa community college students and faculty during the 2009-2010 academic year. Includes a special report on high school graduates in community college.
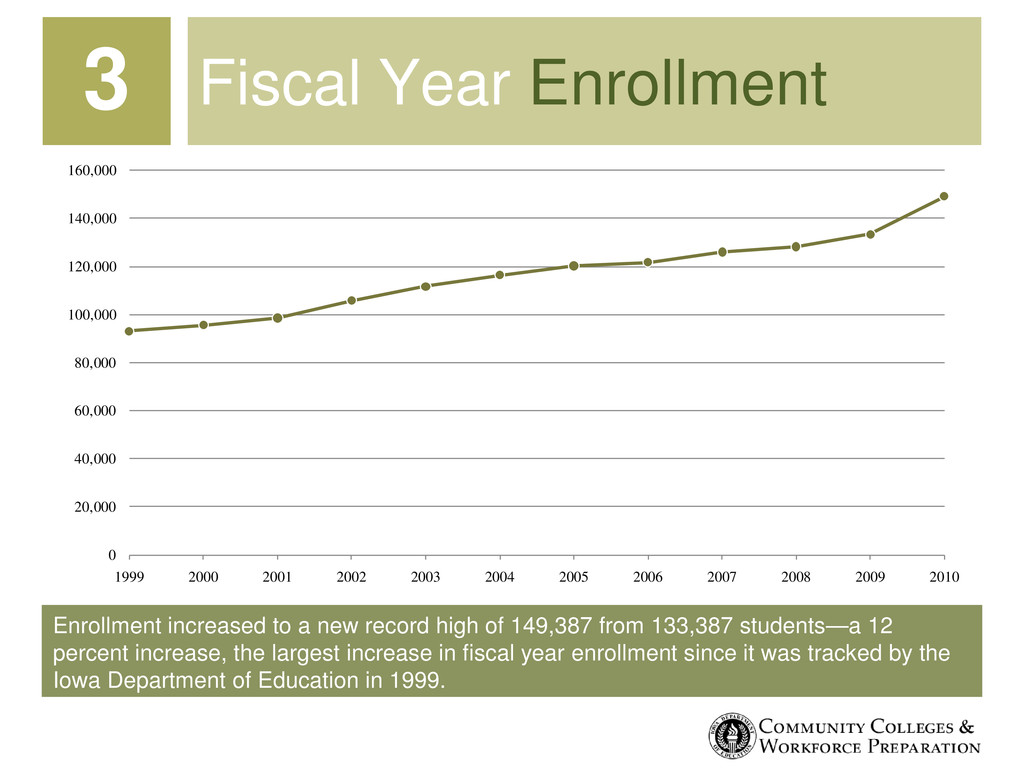
133,387 students—a 12 percent increase, the largest increase in fiscal year enrollment since it was tracked by the Iowa Department of Education in 1999. Fiscal Year Enrollment 3 0 20,000 40,000 60,000 80,000 100,000 120,000 140,000 160,000 1999 2000 2001 2002 2003 2004 2005 2006 2007 2008 2009 2010
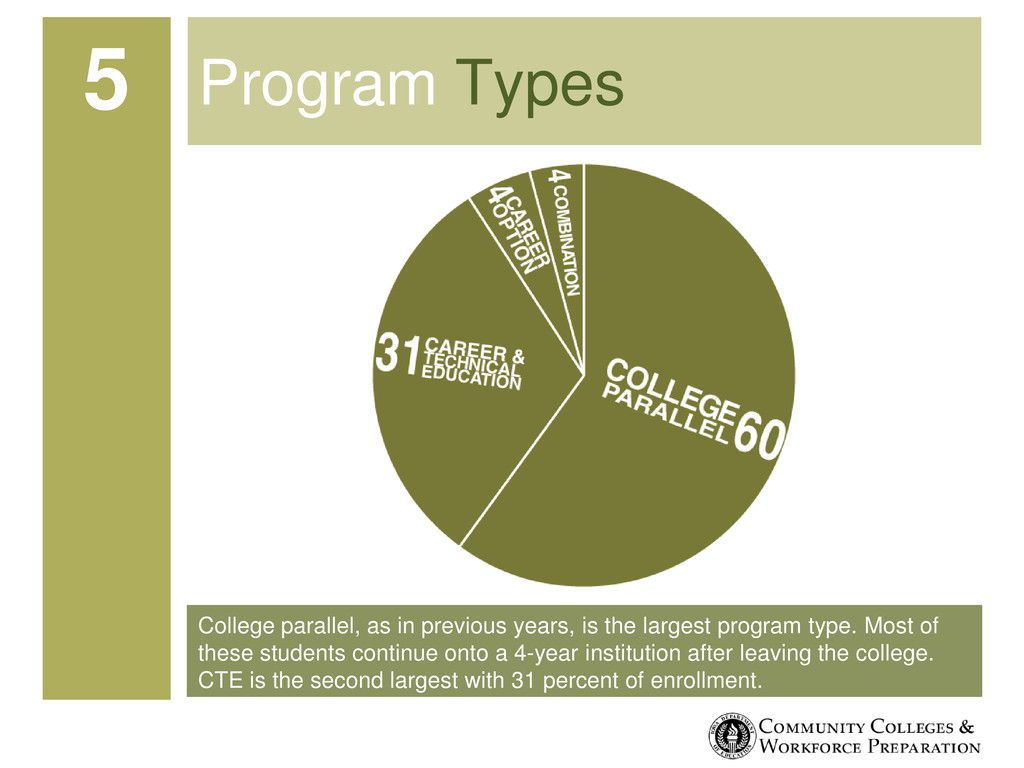
type. Most of these students continue onto a 4-year institution after leaving the college. CTE is the second largest with 31 percent of enrollment. Program Types 5
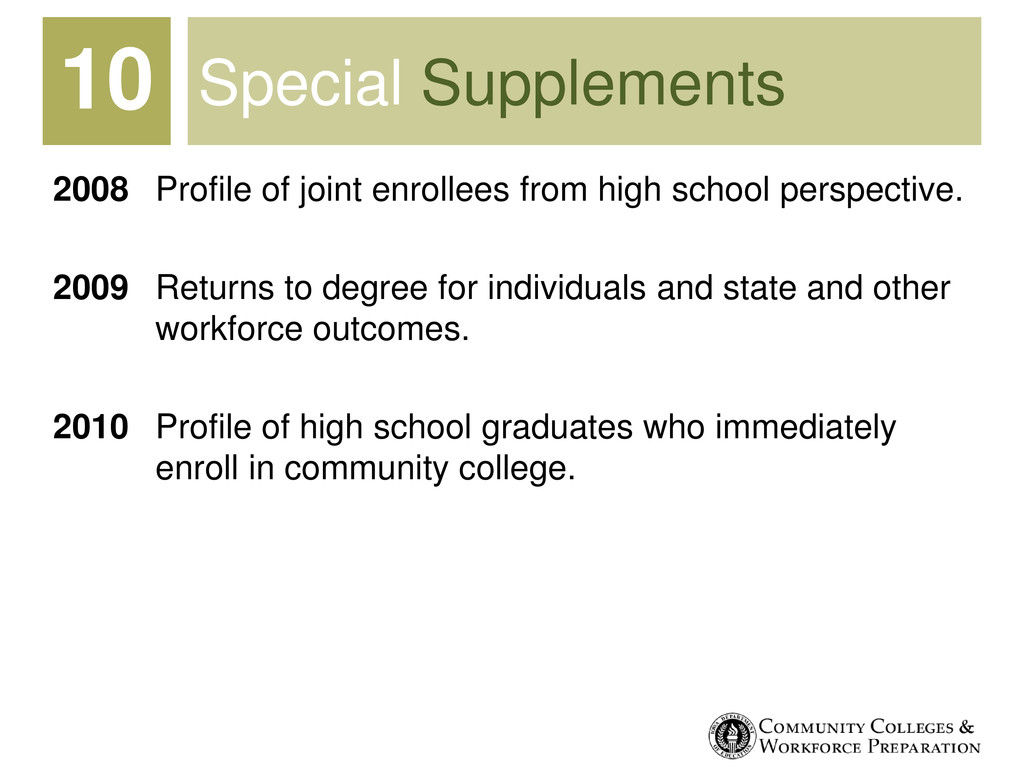
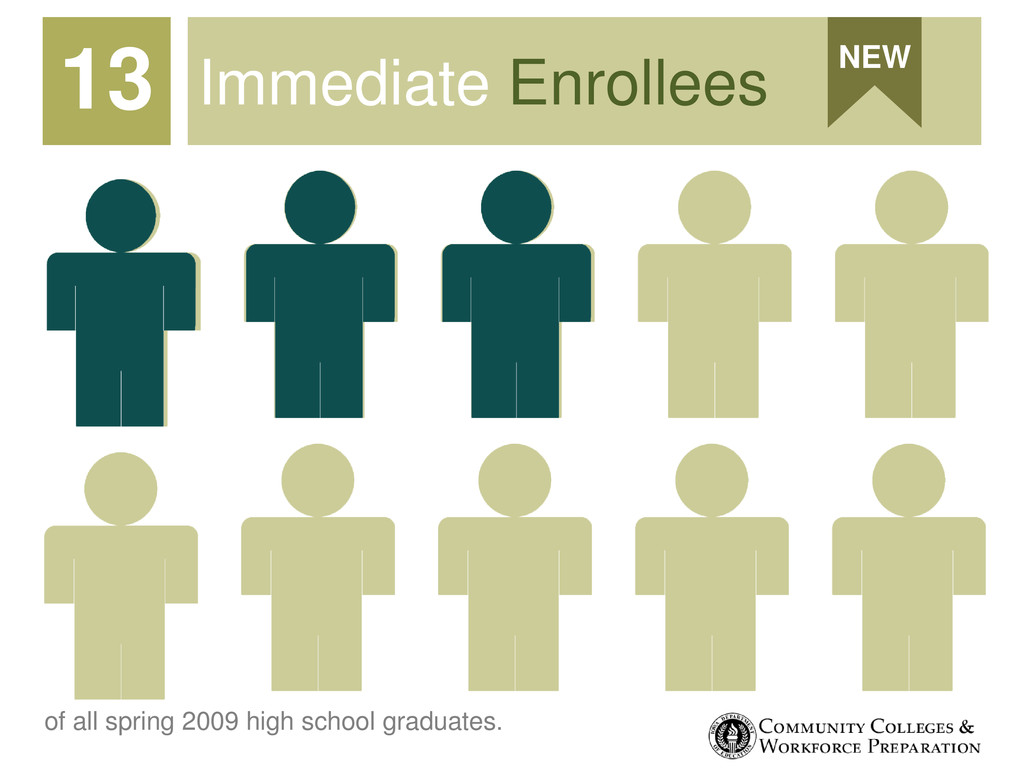
perspective. 2009 Returns to degree for individuals and state and other workforce outcomes. 2010 Profile of high school graduates who immediately enroll in community college. 10
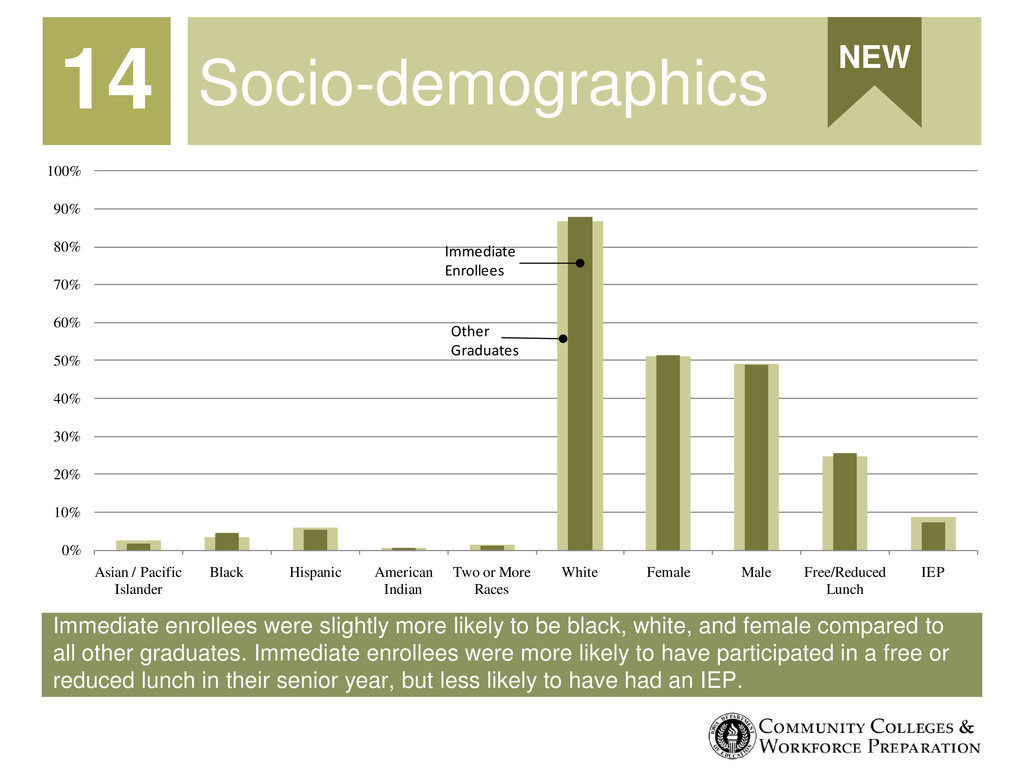
and female compared to all other graduates. Immediate enrollees were more likely to have participated in a free or reduced lunch in their senior year, but less likely to have had an IEP. Socio-demographics 14 NEW 0% 10% 20% 30% 40% 50% 60% 70% 80% 90% 100% Asian / Pacific Islander Black Hispanic American Indian Two or More Races White Female Male Free/Reduced Lunch IEP Immediate Enrollees Other Graduates
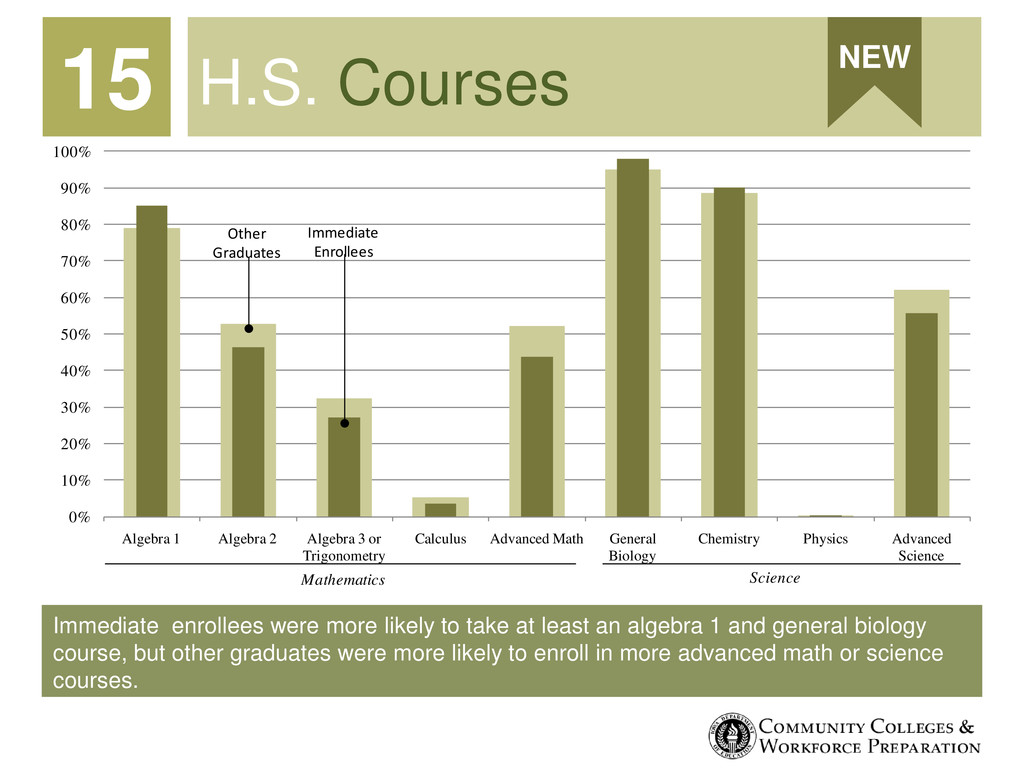
algebra 1 and general biology course, but other graduates were more likely to enroll in more advanced math or science courses. H.S. Courses 15 NEW 0% 10% 20% 30% 40% 50% 60% 70% 80% 90% 100% Algebra 1 Algebra 2 Algebra 3 or Trigonometry Calculus Advanced Math General Biology Chemistry Physics Advanced Science Mathematics Science Immediate Enrollees Other Graduates
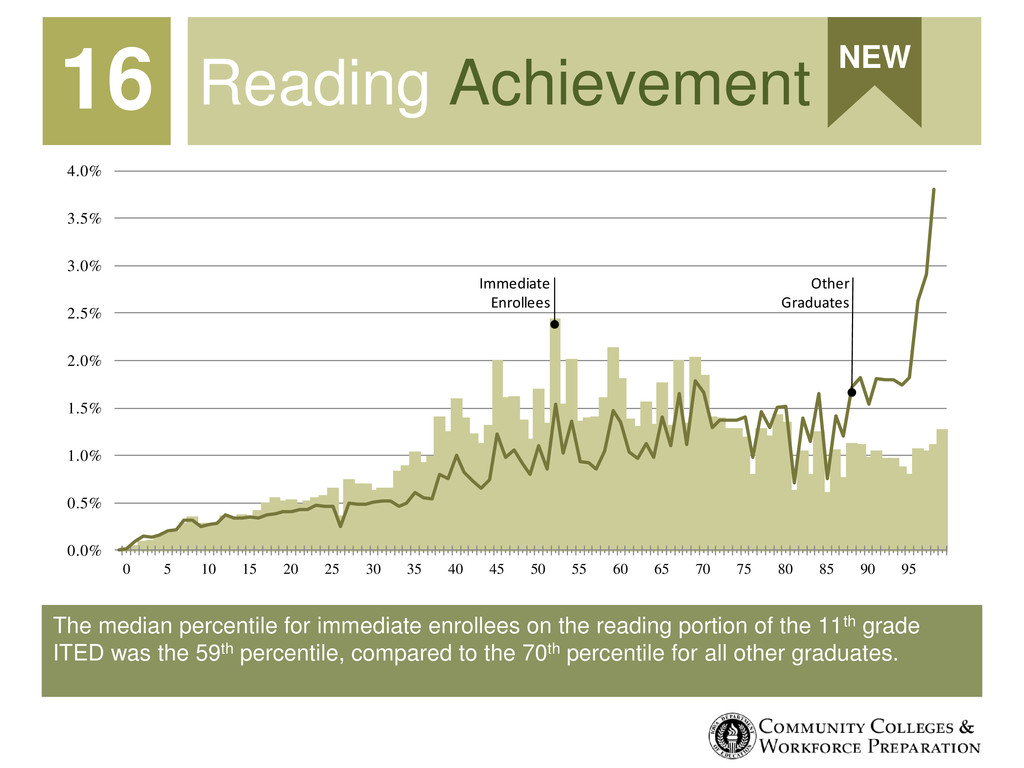
of the 11th grade ITED was the 59th percentile, compared to the 70th percentile for all other graduates. Reading Achievement 16 NEW 0.0% 0.5% 1.0% 1.5% 2.0% 2.5% 3.0% 3.5% 4.0% 0 5 10 15 20 25 30 35 40 45 50 55 60 65 70 75 80 85 90 95 Other Graduates Immediate Enrollees
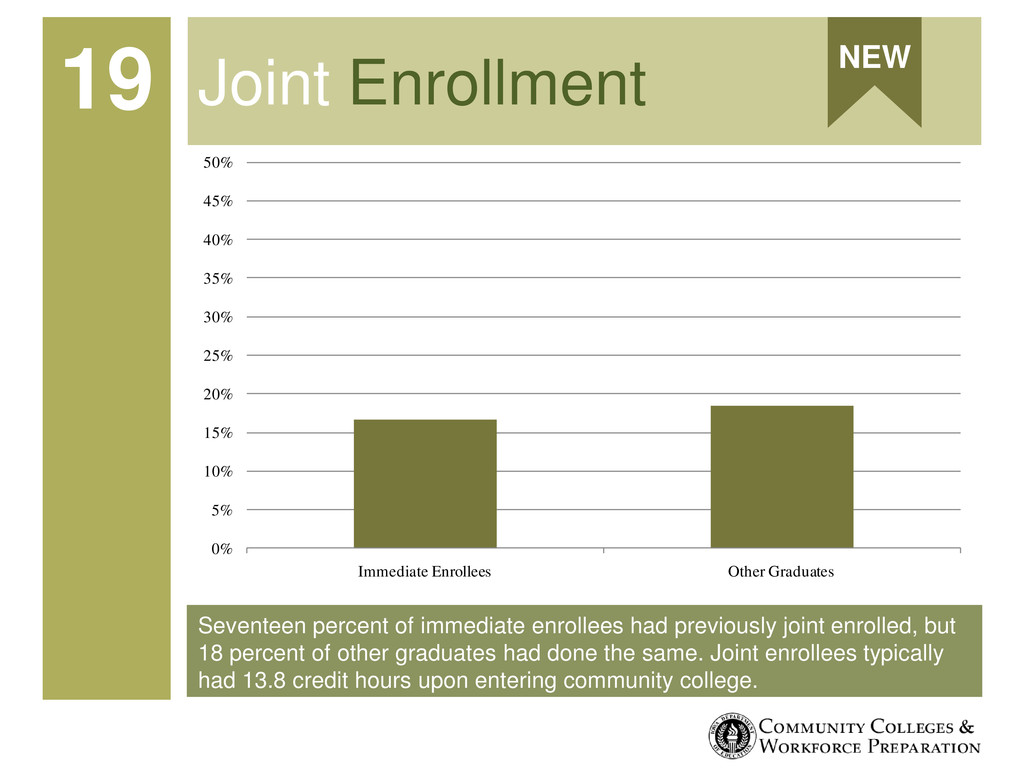
18 percent of other graduates had done the same. Joint enrollees typically had 13.8 credit hours upon entering community college. Joint Enrollment 19 NEW 0% 5% 10% 15% 20% 25% 30% 35% 40% 45% 50% Immediate Enrollees Other Graduates
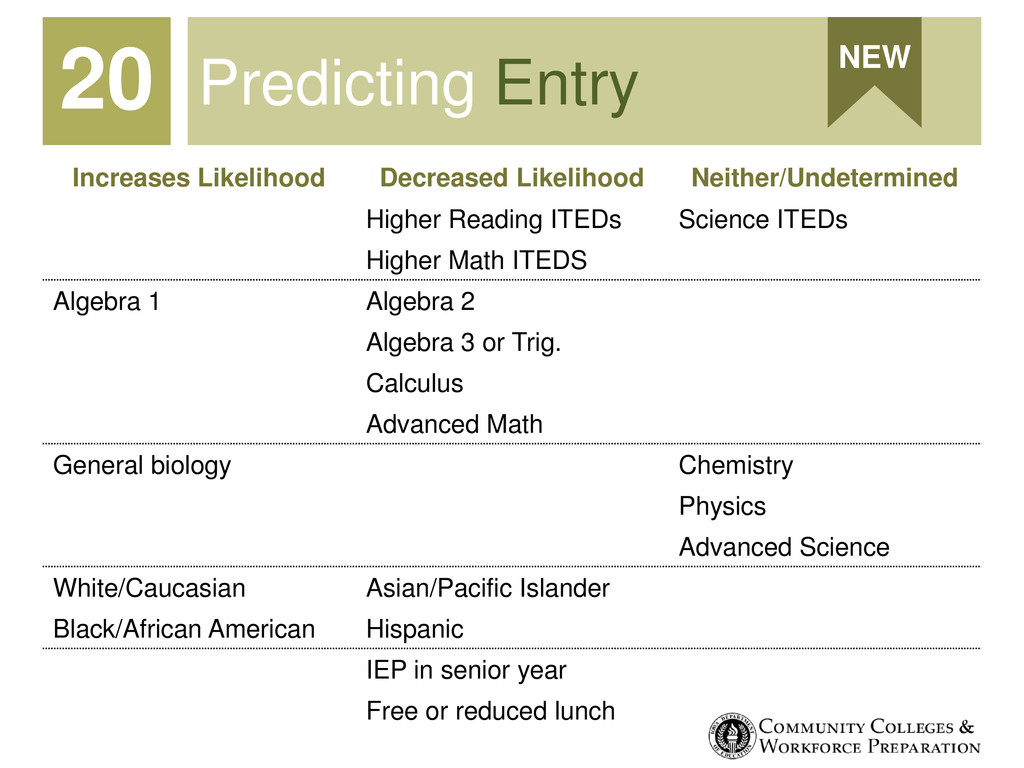
Reading ITEDs Science ITEDs Higher Math ITEDS Algebra 1 Algebra 2 Algebra 3 or Trig. Calculus Advanced Math General biology Chemistry Physics Advanced Science White/Caucasian Asian/Pacific Islander Black/African American Hispanic IEP in senior year Free or reduced lunch
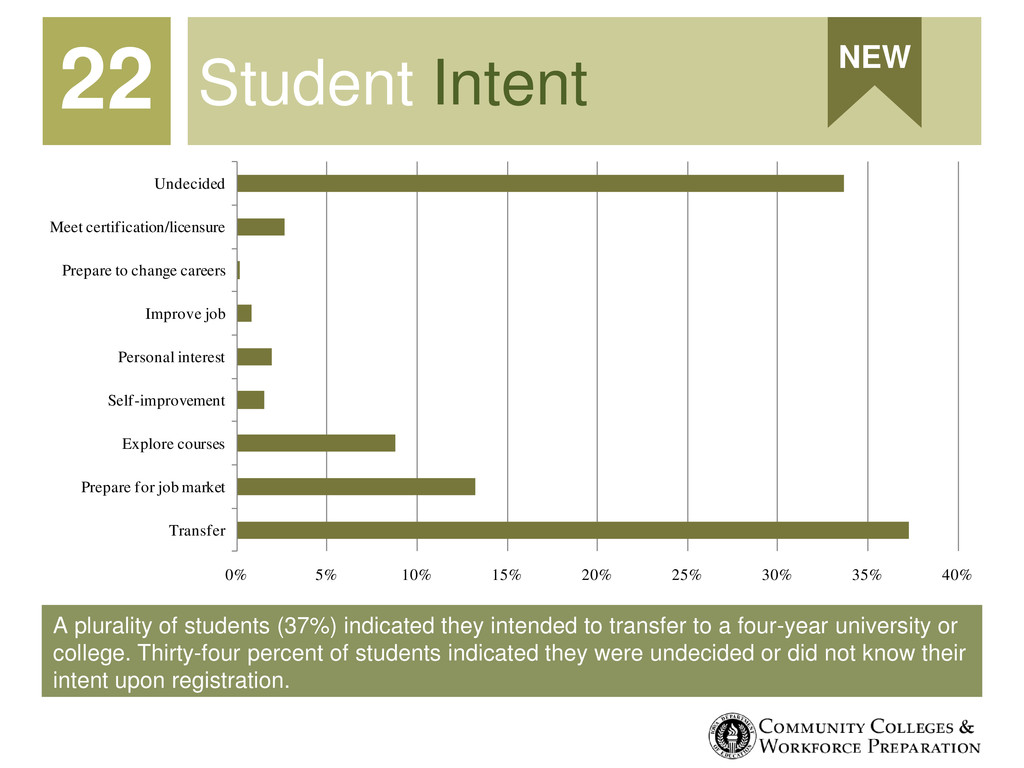
to a four-year university or college. Thirty-four percent of students indicated they were undecided or did not know their intent upon registration. Student Intent 22 0% 5% 10% 15% 20% 25% 30% 35% 40% Transfer Prepare for job market Explore courses Self-improvement Personal interest Improve job Prepare to change careers Meet certification/licensure Undecided NEW
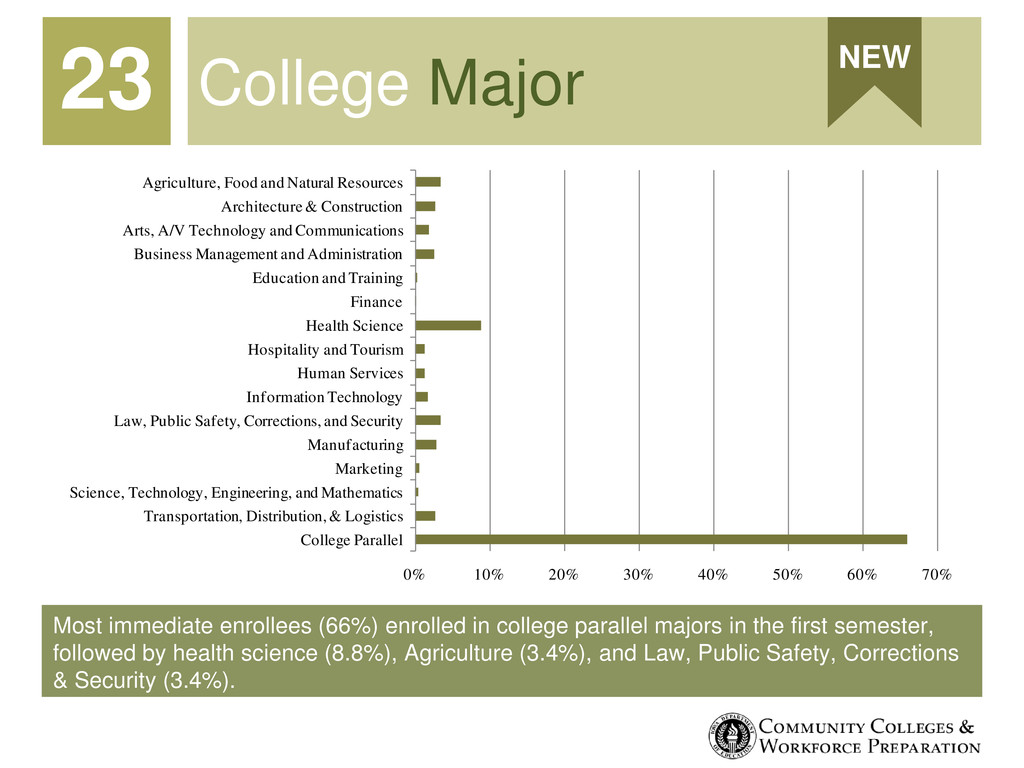
the first semester, followed by health science (8.8%), Agriculture (3.4%), and Law, Public Safety, Corrections & Security (3.4%). College Major 23 NEW 0% 10% 20% 30% 40% 50% 60% 70% College Parallel Transportation, Distribution, & Logistics Science, Technology, Engineering, and Mathematics Marketing Manufacturing Law, Public Safety, Corrections, and Security Information Technology Human Services Hospitality and Tourism Health Science Finance Education and Training Business Management and Administration Arts, A/V Technology and Communications Architecture & Construction Agriculture, Food and Natural Resources
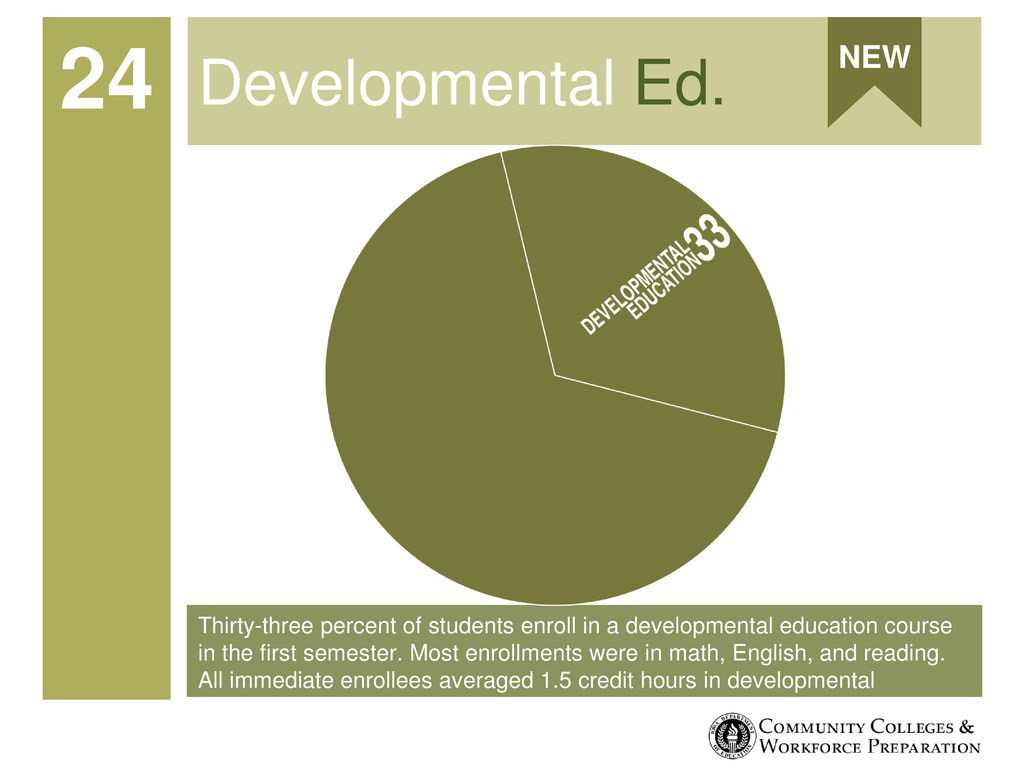
in the first semester. Most enrollments were in math, English, and reading. All immediate enrollees averaged 1.5 credit hours in developmental education. Developmental Ed. 24 NEW
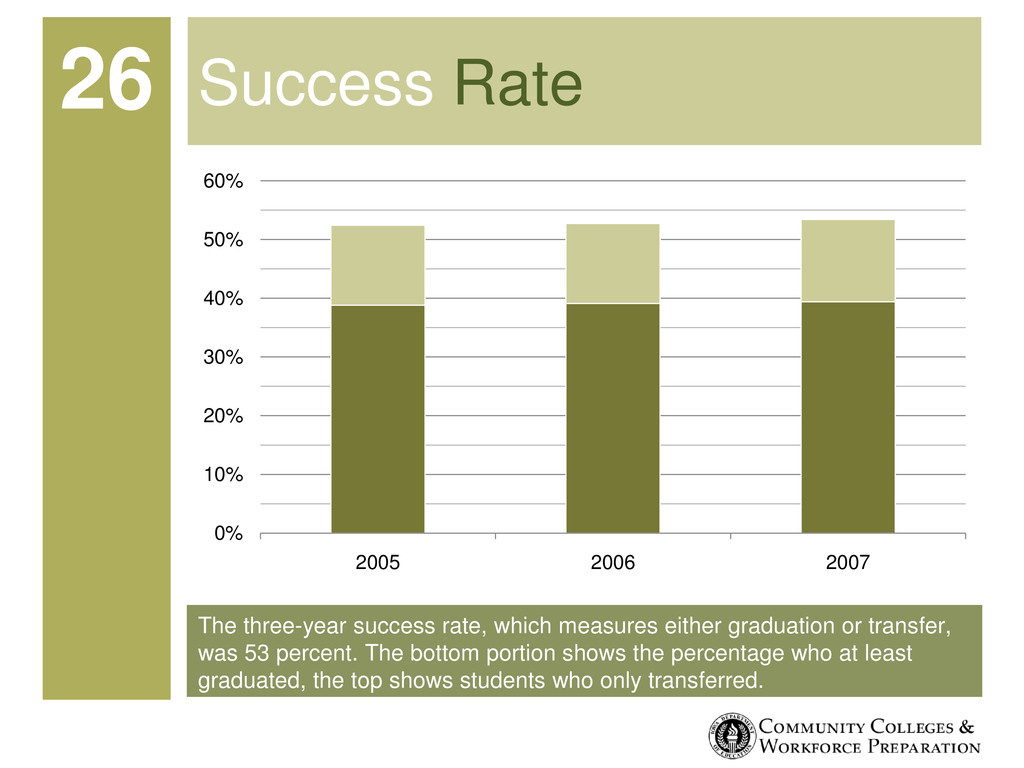
was 53 percent. The bottom portion shows the percentage who at least graduated, the top shows students who only transferred. Success Rate 26 0% 10% 20% 30% 40% 50% 60% 2005 2006 2007
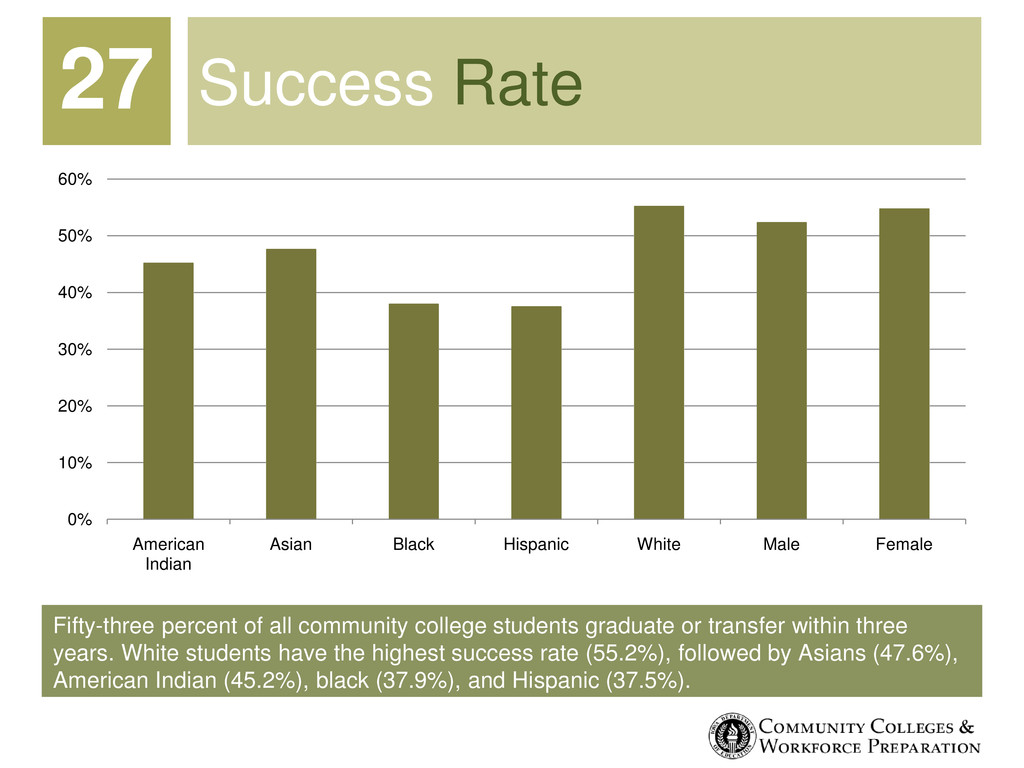
within three years. White students have the highest success rate (55.2%), followed by Asians (47.6%), American Indian (45.2%), black (37.9%), and Hispanic (37.5%). Success Rate 27 0% 10% 20% 30% 40% 50% 60% American Indian Asian Black Hispanic White Male Female
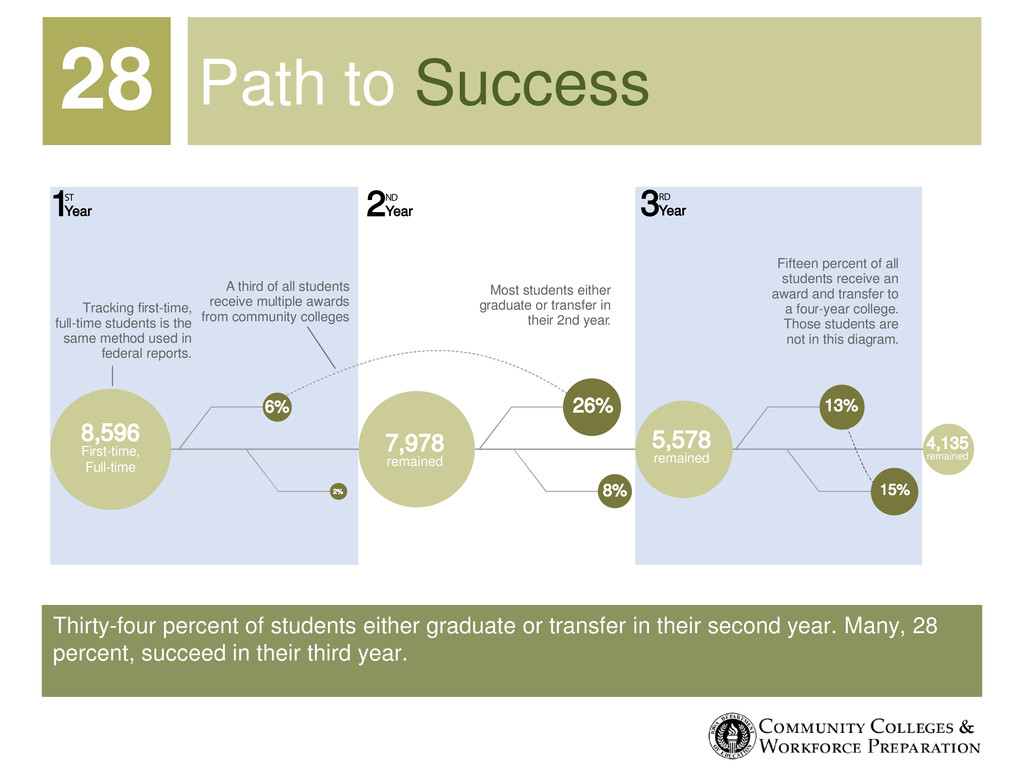
second year. Many, 28 percent, succeed in their third year. Path to Success 28 1ST Year Tracking first-time, full-time students is the same method used in federal reports. A third of all students receive multiple awards from community colleges Most students either graduate or transfer in their 2nd year. 6% 2% 8% 26% 13% 15% Fifteen percent of all students receive an award and transfer to a four-year college. Those students are not in this diagram. 2ND Year 3RD Year 8,596 First-time, Full-time 7,978 remained 5,578 remained 4,135 remained