Upgrade to Pro — share decks privately, control downloads, hide ads and more …

BMTC20: Closing Keynote: Tourism and Marketing in a Competitive Era

BMTC20: Closing Keynote: Tourism and Marketing in a Competitive Era

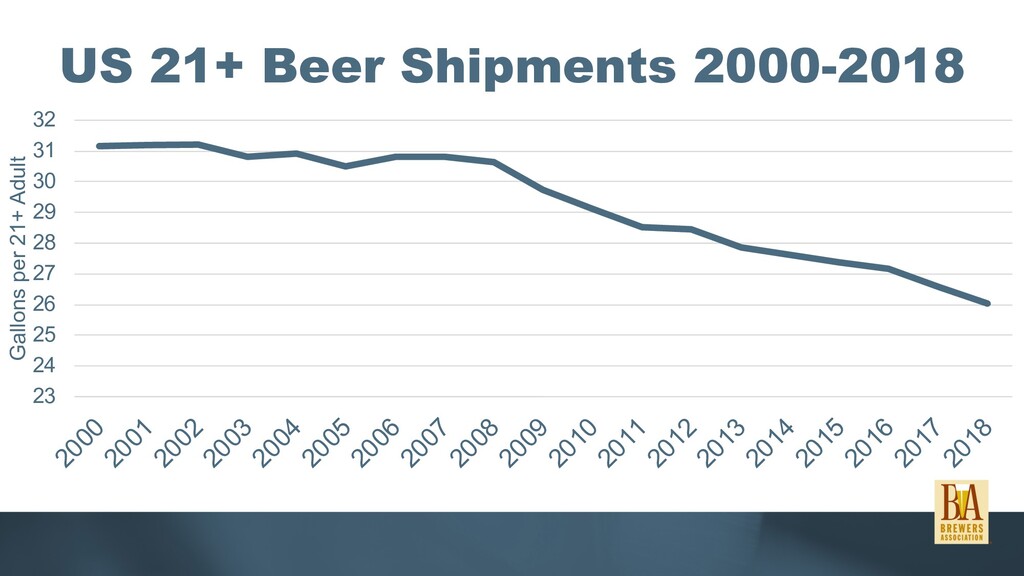
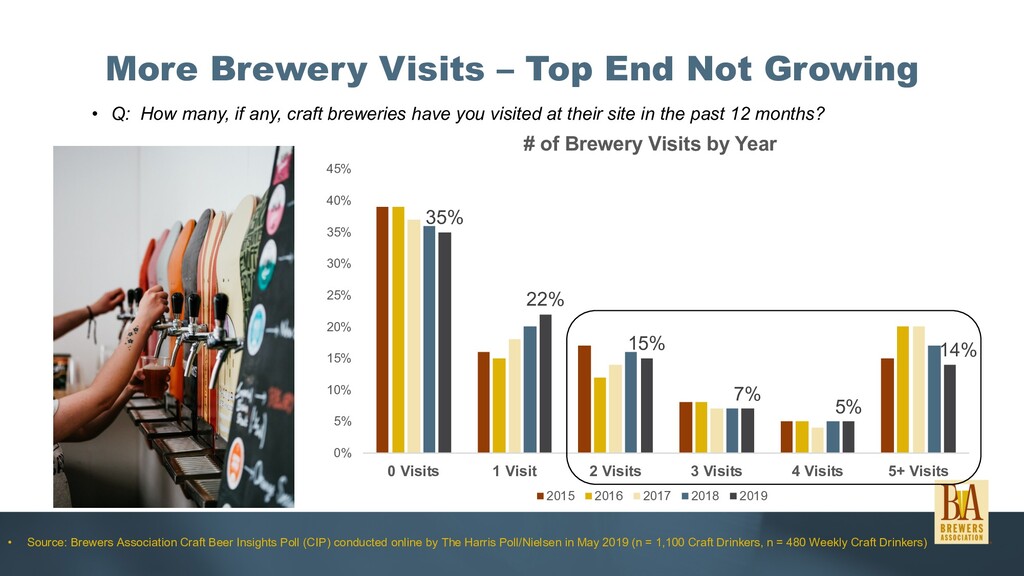
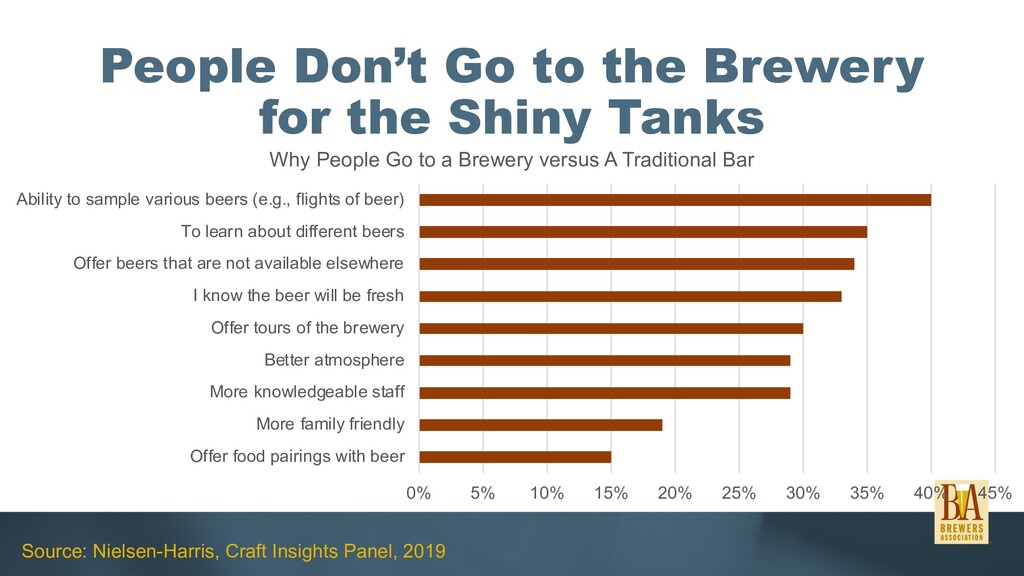
Bart Watson, Chief Economist at the Brewers Association, is making his debut at BMTC and will come prepared with the high level insight only he can provide. We all know the beer industry has changed in recent years, with a flattening of the growth curve and continued entrance of new breweries and other beer industry businesses. Bart will discuss this new competitive environment and how you can adjust your own tourism position and marketing programs to best succeed.

Zephyr Conferences

February 06, 2020
Tweet

More Decks by Zephyr Conferences

Other Decks in Education

Transcript

  1. The Big Contradiction The segment has never been stronger The

    market has never been more competitive = More important than ever to differentiate
  2. 0 1,000 2,000 3,000 4,000 5,000 6,000 7,000 8,000 9,000

    10,000 2010/2012 2011/2013 2012/2014 2013/2015 2014/2016 2015/2017 2016/2018 2017/2019 TTB Permits vs Dec Active, 2 years Later Permits Brewery
  3. 0 2,000 4,000 6,000 8,000 10,000 12,000 1995 1996 1997

    1998 1999 2000 2001 2002 2003 2004 2005 2006 2007 2008 2009 2010 2011 2012 2013 2014 2015 2016 2017 2018 Breweries and Brewery Permits, 1995-2018
  4. 0.00 0.20 0.40 0.60 0.80 1.00 1.20 1.40 1.60 1.80

    0.00 2.00 4.00 6.00 8.00 10.00 12.00 14.00 16.00 18.00 20.00 State-by-State, 2018 Licenses per 100,000 21+ vs 2019 Growth
  5. Total U.S. Alcohol Beverage Permits Grow Across All Segments 0

    5,000 10,000 15,000 2010 2011 2012 2013 2014 2015 2016 2017 2018 2019 U.S. Brewery Permits 0 1,000 2,000 3,000 4,000 2010 2011 2012 2013 2014 2015 2016 2017 2018 2019 U.S. Distillery Permits 0 5,000 10,000 15,000 2010 2011 2012 2013 2014 2015 2016 2017 2018 2019 U.S. Winery Permits Almost 30,000 permitted alcohol suppliers in U.S. +20,000 in past 10 years: 2010 = 9,803 Current = 29,007 Source: U.S. TTB 2019.
  6. • Craft consumers are aging • 2020 to 2030 population

    projections • 21-34 = +200,000 • 35-44 = +5.7 million • 45-54 = +1.6 million
  7. Demographics: Challenge and Opportunity Source: Brewers Association Craft Beer Insights

    Poll (CIP) conducted online by The Harris Poll/Nielsen in May 2019 (n = 1,100 Craft Drinkers, n = 480 Weekly Craft Drinkers) Q: Over the course of a typical month, about how many different craft beer brands do you purchase? 75% Purchase 1-3 Brands 0% 5% 10% 15% 20% 25% 30% 35% 2015 2016 2017 2018 2019 Regular Craft Drinker Weekly Drinker % That Purchase 1-3 Brands % That Purchase 5+ Brands
  8. Alcohol Consumption Over Time Do You Have Occasion to Drink

    Alcohol? 0 10 20 30 40 50 60 70 80 1939 1945 1947 1949 1950 1951 1952 1957 1958 1960 1966 1969 1974 1979 1981 1985 1988 1990 1994 1996 2000 2001 2002 2003 2004 2005 2006 2007 2008 2009 2010 2011 2012 2013 2014 2015 2016 2017 2018 2019 Percent who said “Yes” Source: Gallup Poll, 2016.
  9. Total U.S. Ethanol Per Capita 2010 to 2018 1.34 1.31

    1.31 1.30 1.30 1.30 1.29 1.26 1.25 0.37 0.38 0.38 0.38 0.38 0.38 0.39 0.39 0.39 0.79 0.81 0.83 0.84 0.84 0.86 0.87 0.90 0.90 0.0 0.5 1.0 1.5 2.0 2.5 2010 2011 2012 2013 2014 2015 2016 2017 2018 Gallons Per LDA Beer Wine Spirits Source: Compiled by NBWA from TTB, Discus and BIG, 2019 (2018 wine volumes estimated by NBWA)
  10. US 21+ Beer Shipments 2000-2018 23 24 25 26 27

    28 29 30 31 32 2000 2001 2002 2003 2004 2005 2006 2007 2008 2009 2010 2011 2012 2013 2014 2015 2016 2017 2018 Gallons per 21+ Adult
  11. AND INCREASINGLY A THIRD CHANNEL STORY Especially for Millennials at

    the High End • Source: Nielsen Bev Al Generations Study - 2016 • Q: What percentage of the time did you make your purchase at each of the following places/venues? % OF TIME PURCHASES MADE AT… OFF PREMISE Retail Store ON PREMISE Bar/Restaurant 3rd SPACE CHANNEL DM NON CRAFT (total 21+) 56% 34% 9% DM NON CRAFT – MILLENNIALS 55% 34% 11% IMPORTS (total 21+) 52% 35% 13% IMPORTS – MILLENNIALS 41% 35% 23% CRAFT (total 21+) 43% 40% 17% CRAFT – MILLENNIALS 40% 37% 23% 3rd space channel here includes… Sporting events; Music Festivals; Tasting rooms
  12. The Structure of the On Premise Universe Source: Nielsen TDLinx

    (August 2019) No. of restaurants, bars & nightclubs: August‘19 vs. YAGO Drinking 81,519 -1.2% 300,261 -0.9% Eating 218,742 -0.7% Casual Dining 164,677 Fine Dining 13,205 Neighborhood Bar 56,832 -1.4% Sports Bar 10,076 +1.0% Premium Bar 3,765 +11.8% Key Take A Ways: • On Premise outlets are shrinking, with Eating and Drinking outlets now both experiencing decline and at similar rates • There are some positive stories in a declining Drinking channel, with sports/premium bars still experiencing growth vs YA Fast Casual 28,105 Polished Casual 6,722 QSR 6,033 Casual Nightclub 6,044 -7.5% NB TD Linx analysis does not include Lodging, Recreation or Other Other On Premise 87,136 +0.4% Recreation 55,160 -0.1% Lodging 20,651 +0.9% Other 11,325 +1.0%
  13. Retail Contradictions too 0 10,000 20,000 30,000 40,000 50,000 60,000

    2001 2002 2003 2004 2005 2006 2007 2008 2009 2010 2011 2012 2013 2014 2015 2016 2017 2018 Drinking Places (# of Establishments) 400 450 500 550 600 650 700 Thousands More Total Retailers 2010 2018 Source: TDLinks™
  14. 66% 57% 43% 9% 71% 62% 43% 7% Regional Local

    National Not at all sure Craft Drinker Weekly PREFERENCE IS REGIONAL/LOCAL OVER NATIONAL Source: Brewers Association Craft Beer Insights Poll (CIP) conducted online by The Harris Poll/Nielsen in May 2019 (n = 1,100 Craft Drinkers, n = 480 Weekly Craft Drinkers Q: Which best describes the type of craft beer you typically purchase (select all) Only sold in my state, or neighboring states Only sold in my town or city Sold across the U.S.
  15. LOCAL CRAFT OUTPERFORMS SEGMENT • Local Craft defined as brands

    with 85% or more volume in one state or retailer Source: Nielsen XAOC/Conv/Liq+Mil Exchanges; 52 weeks end 06/22/19; *Craft includes brands owned by large brewers -1.0% -1.7% 5.0% Total Craft* Craft excluding Local Local Craft Dollar Growth Trend Off-Premise Channels Small but Gaining Share: • Local Craft accounts for 10.3% of Craft dollars, up nearly 1% from last year Premium Price: • Average price for Local Craft 6-pack is $14.34 vs $9.26 for average price of Craft in off premise
  16. Craft Demo Gains, Opportunities Remain 35% 37% 38% 40% 43%

    2015 2016 2017 2018 2019 Percentage of Craft Beer Drinkers Among 21+ Pop’n (Several times a year or more often) Male 56% +10 Female 31% +6 21-34 57% +7 35-44 51% +11 45-54 42% +8 55-64 34% +7 65+ 28% +8
  17. More Brewery Visits – Top End Not Growing • Q:

    How many, if any, craft breweries have you visited at their site in the past 12 months? • Source: Brewers Association Craft Beer Insights Poll (CIP) conducted online by The Harris Poll/Nielsen in May 2019 (n = 1,100 Craft Drinkers, n = 480 Weekly Craft Drinkers) 35% 22% 15% 7% 5% 14% 0% 5% 10% 15% 20% 25% 30% 35% 40% 45% 0 Visits 1 Visit 2 Visits 3 Visits 4 Visits 5+ Visits # of Brewery Visits by Year 2015 2016 2017 2018 2019
  18. Also While Travelling 0% 10% 20% 30% 40% 50% 60%

    2015 2016 2017 2018 2019 Visited In Past 12 Months (Net), More than 2 Hours from Home Source: Nielsen-Harris, Craft Insights Panel, 2019
  19. Total Brewery Tourists (Extrapolated) 36,780,777 55,418,167 0 10,000,000 20,000,000 30,000,000

    40,000,000 50,000,000 60,000,000 2015 2016 2017 2018 2019 Source: Nielsen-Harris, Craft Insights Panel, 2019, US Census Bureau
  20. 0 1,000 2,000 3,000 4,000 5,000 6,000 7,000 8,000 0

    500,000 1,000,000 1,500,000 2,000,000 2,500,000 3,000,000 3,500,000 2014 2015 2016 2017 2018 Premise Use and Active Breweries
  21. People Don’t Go to the Brewery for the Shiny Tanks

    0% 5% 10% 15% 20% 25% 30% 35% 40% 45% Offer food pairings with beer More family friendly More knowledgeable staff Better atmosphere Offer tours of the brewery I know the beer will be fresh Offer beers that are not available elsewhere To learn about different beers Ability to sample various beers (e.g., flights of beer) Why People Go to a Brewery versus A Traditional Bar Source: Nielsen-Harris, Craft Insights Panel, 2019
  22. BREWERY VISITS CONTINUE TO HELP DRIVE FUTURE SALES • Q:

    After your visit(s) to a craft brewery, which of the following describe how, if at all, your purchasing habits of that craft brewer’s product changed? • Source: Brewers Association Craft Beer Insights Poll (CIP) conducted online by The Harris Poll/Nielsen in May 2019 (n = 1,100 Craft Drinkers, n = 480 Weekly Craft Drinkers) • Base: Visited craft brewery More than 50% of Craft Drinkers purchased more after visiting 17% 41% 25% 43% 15% 34% 24% 35% I PURCHASED A LOT MORE OF THAT CRAFT BREWER'S PRODUCTS I PURCHASED A LITTLE MORE OF THAT CRAFT BREWER'S PRODUCTS I PURCHASED A LOT MORE OF THAT CRAFT BREWER'S PRODUCTS I PURCHASED A LITTLE MORE OF THAT CRAFT BREWER'S PRODUCTS 2019 2018 CRAFT DRINKERS WEEKLY CRAFT DRINKERS
  23. Where do Brewery Visits Drive Purchasing? • Q: You mentioned

    that you purchase more of a craft brewer’s products after visiting their brewery. At which of the following locations are you purchasing more of their products? Please select all that apply. • Source: Brewers Association Craft Beer Insights Poll (CIP) conducted online by The Harris Poll/Nielsen in May 2019 (n = 1,100 Craft Drinkers, n = 480 Weekly Craft Drinkers) • Base: Purchased more of a craft brewer’s products after visiting their brewery 66% 60% 54% 21% 16% 12% 2% 69% 64% 61% 26% 20% 14% 2% At the brewery Retail store In a restaurant/bar At a sporting event At a concert/festival Online Somewhere else Craft Drinkers Weekly Craft Drinkers Future purchased at the brewery appealing to 45-54 Craft Drinkers 21-34 Craft Drinkers more drawn to sporting events, concerts/festivals, and online Female Weekly Craft Drinkers purchasing more at sporting events
  24. IS IT TIME FOR CRAFT BEER TO ADVERTISE? • Q:

    How often, if at all, do you purchase a craft beer brand that you have never seen advertising for or heard of before purchasing it? • Source: Brewers Association Craft Beer Insights Poll (CIP) conducted online by The Harris Poll/Nielsen in May 2019 (n = 1,100 Craft Drinkers, n = 480 Weekly Craft Drinkers) 37% 35% 29% 26% 21% 2015 2016 2017 2018 2019 % Saying Always/Often Purchase Craft Beer They’ve Never Heard Of % Saying At Least Sometimes Purchase Craft Beer They’ve Never Heard Of 69% purchase at least sometimes Male more likely (71%) Female less likely (63%) Age 35-44 (77%) Weekly Drinkers (74%) 35-44
  25. A Different World = Different Marketing Holy trinity of marketing

    (A, T, R) Cognitive offloading Challenge and opportunity