(note, some of these slides are animated GIFs in the original version)
Video: https://vimeo.com/245809301
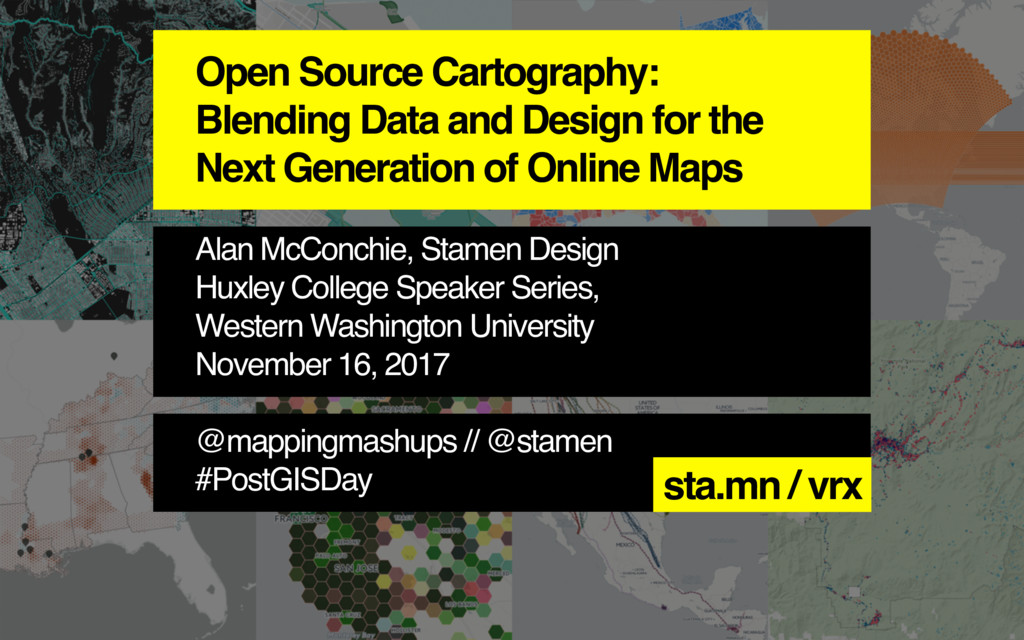
Presented at:
Huxley College Speaker Series,
Western Washington University
November 16, 2017
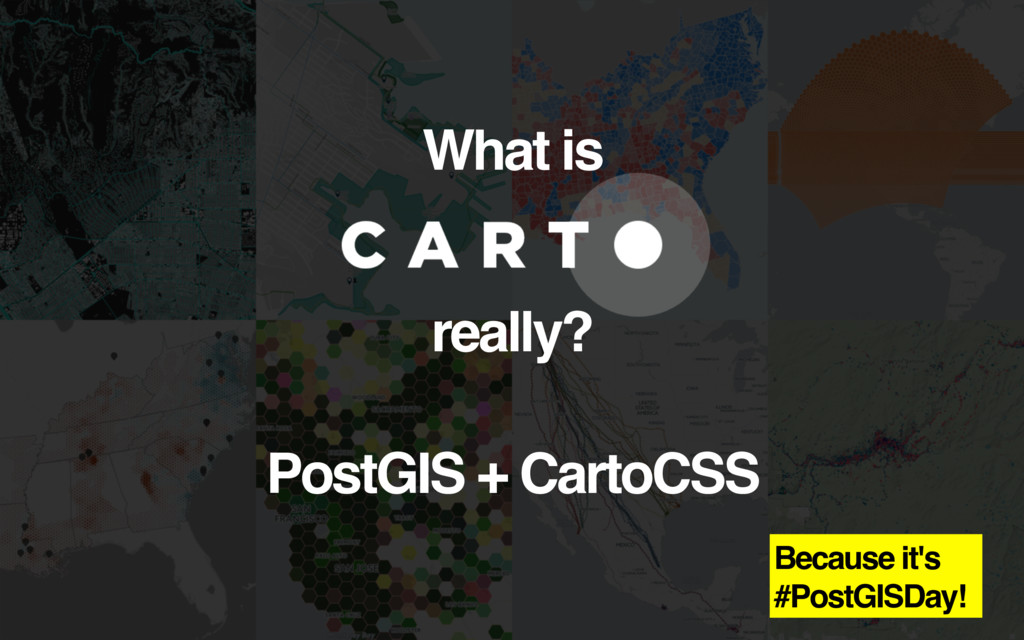
#PostGISDay
Details: https://huxley.wwu.edu/blog/huxley-college/huxley-speaker-series-mcconchie