Upgrade to Pro — share decks privately, control downloads, hide ads and more …

China Panel: Growing Internationally

BEMA
February 28, 2018

China Panel: Growing Internationally

BEMA

February 28, 2018
Tweet

More Decks by BEMA

Other Decks in Education

Transcript

  1. © Euromonitor International 5 Consumer trends and lifestyles. Companies and

    brands. Product categories and distribution channels. Production and supply chains. Economics and forecasting. Comparable data across markets. Experts at analyzing global markets, categories and trends
  2. © Euromonitor International 6 Market Definitions Baked goods Baked goods

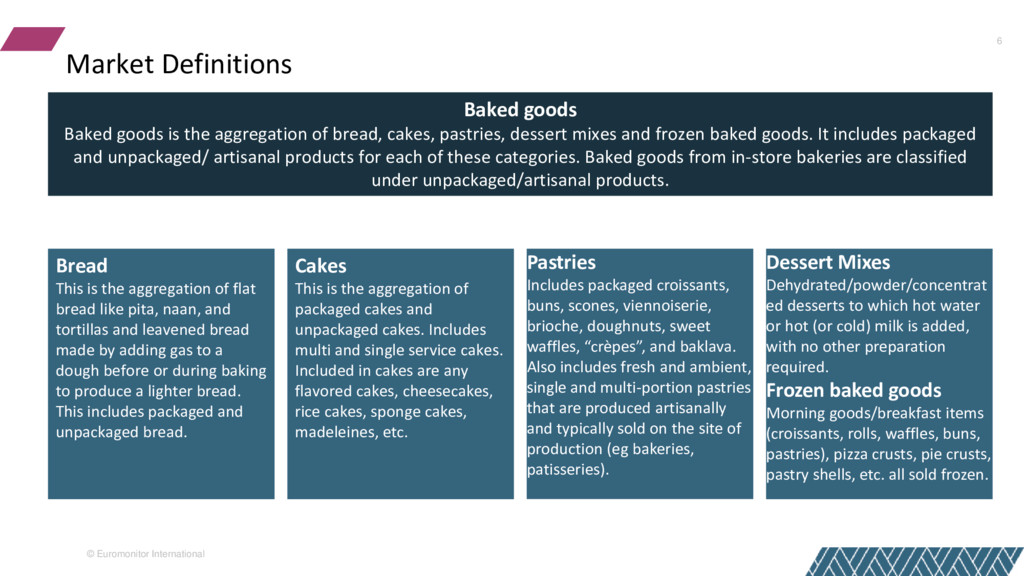
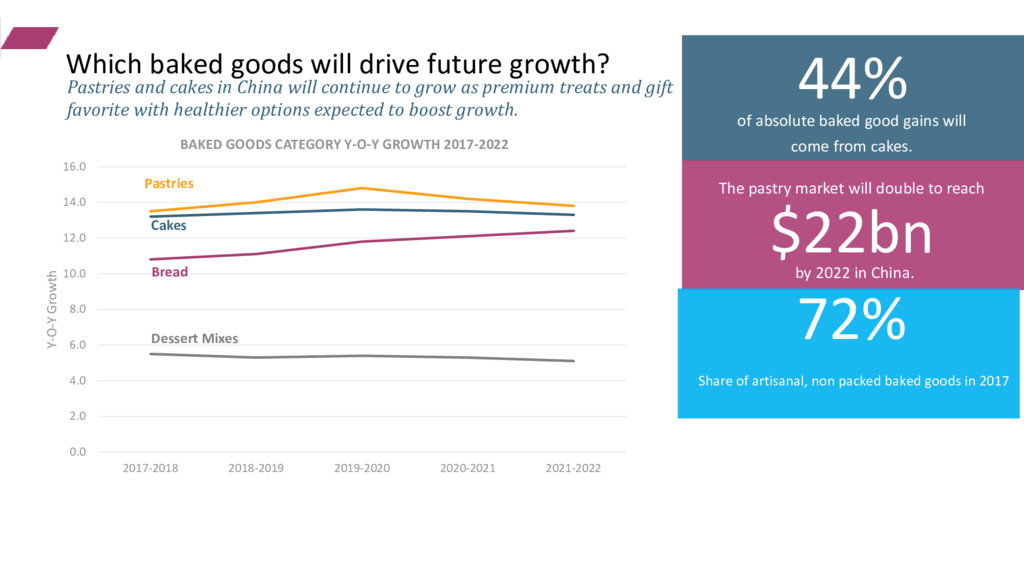
    is the aggregation of bread, cakes, pastries, dessert mixes and frozen baked goods. It includes packaged and unpackaged/ artisanal products for each of these categories. Baked goods from in-store bakeries are classified under unpackaged/artisanal products. Pastries Includes packaged croissants, buns, scones, viennoiserie, brioche, doughnuts, sweet waffles, “crèpes”, and baklava. Also includes fresh and ambient, single and multi-portion pastries that are produced artisanally and typically sold on the site of production (eg bakeries, patisseries). Bread This is the aggregation of flat bread like pita, naan, and tortillas and leavened bread made by adding gas to a dough before or during baking to produce a lighter bread. This includes packaged and unpackaged bread. Cakes This is the aggregation of packaged cakes and unpackaged cakes. Includes multi and single service cakes. Included in cakes are any flavored cakes, cheesecakes, rice cakes, sponge cakes, madeleines, etc. Dessert Mixes Dehydrated/powder/concentrat ed desserts to which hot water or hot (or cold) milk is added, with no other preparation required. Frozen baked goods Morning goods/breakfast items (croissants, rolls, waffles, buns, pastries), pizza crusts, pie crusts, pastry shells, etc. all sold frozen.
  3. © Euromonitor International 8 The baked goods market in China

    has surged with over 13% growth in the last five years, reaching $28.5bn in 2017.
  4. 13.3% Historic CAGR % of baked goods in China 2012-2017.

    © Euromonitor International 9 7.5% Absolute Volume Growth for the period. $28.5bn $15.7bn 2012 2017 CHINA BAKED GOODS SALES RSP 2012- 2017 (USD) The baked goods market in China has grown USD$12.8bn in absolute terms in the last five years. Which baked goods drive growth?
  5. Greater snacking for time-strapped consumers What macro trends have driven

    these historic gains? Since foreign-funded bakeries began entering China in the 1990s, the Chinese market, traditionally used to “sweet buns”, has continued to become more Westernized. Experimentation with Western-style baked goods Modern grocery growth with in store bakeries
  6. 72% 16lb Of market sales come from artisanal products. Per

    Capita average annual consumption of baked goods. 83% Of total sales fall into sweet baked goods. 45% Of total cake sales are results of the popular gifting tradition among Chinese consumers. $12.4bn $10.8bn $4.9bn $0.4bn Cakes Pastries Bread Dessert Mixes CHINA BAKED GOODS SALES RSP 2017 (USD) New Western favorites including fresh baguettes, croissants and macaroons drive baked goods sales. Which categories account for the largest share?
  7. © Euromonitor International 12 Hsu Fu Chi is a top

    Sachima brand in China. Hui Tou Ke waffles brings a Western favorite product through a familiar local brand. Kong Weng puff pastries remain a favorite product. Cake – 44% Sachima $725mn Mochi $508mn Donuts $541mn Pastries – 38% Puff Pastries $1,860mn Pineapple Pastries $606mn Tants $519mn Croissants $335mn Bread – 17% Buns $843mn Waffles $768mn Rou Song Bing $465mn CHINA BAKED GOODS SALES RSP 2017 (USD) Despite new Western product availability, local favorites still are extremely popular in Chinese cakes and pastries that can be deep-fried, baked and stewed. What type of products are driving this growth?
  8. McDonald’s will almost double its number of restaurants in China

    over the next five years. restaurants in over 1,100 cities. 10,000 hours. Starbucks is opening a store in China every Hua Lai Shi, a burger franchise, aims to open +2,000 outlets in 100 cities across China. 15 KFC has more than NUMBER OF CHAINED FAST FOOD OULETS IN CHINA 5,000 As Western style fast food outlets move into China, the demand for baked goods continues to grow. What outlets are driving this growth? 2,075 1,754 1,143 3,879 4,596 1,565 4,668 6,193 1,819 Chained Burger Fast Food Chained Coffee Shops Chained Bkaery Product Fast Food 2012 2017 2021
  9. $15.7bn $53bn $28.5bn $58.6bn China USA 2012 2017 Despite contradictory

    health trends, the baked good markets in China and the US are still growing overall. China is the second-largest baked goods market in the world, with retail sales valued at US$28.5bn in 2017, just behind the US. In 2017 cake sales in China were USD$12.4bn representing 43% of the market whereas bread sales in the US (USD$23.4bn) have the are the largest category in baked goods. BAKED GOODS SALES RSP 2012- 2017 (USD) China is growing at a rate almost double the US baked goods market. China vs. the US historic growth
  10. 2.0% 13.0% US baked goods market historic CAGR (2012-2017) Chinese

    baked goods market historic CAGR (2012-2017) $81mn Absolute growth of Chinese baked goods market 2012-2017 USD $5.6bn Absolute growth of US baked goods market 2012-2017 USD . CHINA BAKED GOODS SALES RSP 2017 (USD) Despite small market dips in 2015-2016, the Chinese baked goods market has continued to outpace the US market historically. China vs. US historic growth -1% 1% 3% 5% 7% 9% 11% 13% 15% 17% 2012-2013 2013-2014 2014-2015 2015-2016 2016-2017 Y-O-Y Growth in China and the US Baked Goods Market 2012-2017 China US
  11. Chinese Market US Market  2,800 commercial bakeries in operation.

     Bread is the largest category.  Highly fragmented market with lots of competitors.  Artisanal brands make up 45% of the market.  39% of baked goods sold in grocery markets, 26% in traditional bakeries.  1,450 commercial bakeries in operation.  Cake is the largest category.  Highly fragmented market with lots of competitors.  Artisanal brands make up 72% of the market.  53% of baked goods are sold in bakeries.  Local bakeries offer traditional treats like puff pastries and buns (25% of pastry market sales).  92 holidays where baked goods are given as gifts.
  12. © Euromonitor International 19 The baked goods market in China

    is highly fragmented The top brands account for less than 15% of total retail value share. 4.6% 2.9% 2.1% 1.2% 1.0% 0.8% 0.7% 0.7% 0.6% 0.5% 0.4% 0.3% 2017 Retail Value Share of Baked Goods Artisanal goods mostly sold through bakeries make up 72% of retail sales, with private label making up 4.7% of retail sales in 2017. Most players have a strong regional presence, like Bakery Christine with a high retail sales in Yangtze-river Delta area including Shanghai but has only one store in Beijing.
  13. Dali Food Co Ltd Toly Bread Co Ltd Orion Group

    Panpan Foodstuff Co Ltd Nestlé SA © Euromonitor International 20  In 2017, domestic players counted for four of the top five players of baked goods in China.  Domestic manufacturers dominate, largely because of their noticeable distribution competency, especially in lower-tier cities and rural areas, as well as their ability to quickly respond to shifts in consumer trends.  Local manufacturers also benefit from established sales networks, in particular in low-tier cities and rural areas are able to gain the largest share of sales in baked goods.  Unlike other food products that can be kept longer, bread and cakes have short preservation time and need strict storage conditions to stay fresh. Bakeries must be able to offer fresh products in a country where food safety is a highly important factor for the Chinese after many food scandals. BAKED GOODS SALES IN RSP 2017 (USD) The Chinese baked goods market is dominated by local players. $1.3bn $0.8bn $0.6bn $0.33bn $0.28bn Top baked goods brands in China
  14.  The company has a biscuit processing plant with eight

    production lines.  Operates in 2 segments: manufacturing and sale of food and beverages.  Produces items that are particularly popular in the northeast of China, they offer bread, cakes, pastries, croissants, biscuits and cookies. Dali Food Co. Ltd. Toly Bread Co. Ltd.  “Central factory + wholesale” production and distribution mode.  Short-term shelf-stable packaged bread products, featured much less preservative and short storage life within one or two weeks to deliver freshness.  15 production bases across various regions of China, ensures its supply of products and maximize its consumer access.  Despite being an international company, they have developed new products to suit Chinese consumer’s habits and needs with a closer look on their traditions and eating habits.  The company has 3 production bases and 4 headquarters in China and runs over 69 services offices.  Its main products include tarts, pies, chocolate cakes and tiramisu. Among these products, the Orion Pie is sold in more than 60 countries and regions, accounting for about 70% of the international chocolate pie market. Orion Group Panpan Foodstuff Co. Ltd.  Helping to grow their market share, Panpan continues to introduce new, innovative baked goods.  They introduced Panpan Hand Stick, a shredded bread.  Featuring high quality ingredients, this product answers consumer demands for healthier and more premium baked goods.  It allows for more DIY potential for consumers to pair it with vegetables to make a salad dish, or pair it for a sandwich. Top Five Competitors in China Baked Good Market Snapshots
  15. 27th 28th 29% Rank in Logistics Performance Index out of

    160 countries in 2016 Ease of doing business ranking out of 138 countries in 2016 Of the Chinese population employed in manufacturing in 2017  As China tries to improve the country’s manufacturing industry, US products, known for being innovative and producing high quality products are highly sought after. The government and industries alike are trying to improve conditions to attract US investments.  The Chinese government has worked diligently in recent years to ease regulatory pressure, address corruption and narrow the skills gap add to improve the overall appeal for American manufacturers.  Despite these improvements, the main challenges for US firms remain in pricing, protecting intellectual property rights and logistics/ transportation.  Addressing logistic issues, in May 2016, the Chinese government announced plans to invest US$720 billion on 303 transport infrastructure projects between 2017 and 2020 through Public Private Partnerships (PPP). © Euromonitor International 22 Despite a strong local market, China is encouraging foreign investment and new business from US manufacturers. US manufacturer opportunities in China
  16. LARGE DISTRIBUTION REQUIRED Entering the Chinese market often relies heavily

    upon personal relationships developed and maintained at all levels of distribution. Many companies utilize multiple sales channels to overcome the sheer size and cultural diversity of the country. DISTINCT REGION PREFERENCES Regional tastes and styles dictate baked good products, prices and manufacturing. These different types of preferences make production challenging to streamline across regions. Examples include: Cantonese bakeries (Guangdong province), Sichuan bakeries (Sichuan province, Suzhou bakeries (Jiangsu province), Qin bakeries (Shaanxi province), and Jin bakeries (Shanxi province). 23 Labor costs have continued to increase in recent years. While the cost of maintaining service plans is often factored into machinery sales, it is important for exporters to consider this as they determine pricing. Some regions and municipalities have different requirements to provide localized after-sales service, which would require on-site training or local manufacturer representatives to be present. INTELLECTUAL PROPERTY RIGHTS (IPR) While the Chinese government is working to improve IPR protection, it is recommended that US companies establish a clear strategy to handle the challenges of protecting their IPR in a complex legal environment. LABOR COST
  17. © Euromonitor International 24 China is set to become one

    of the most attractive baked goods markets worldwide.
  18. © Euromonitor International 25 The baked goods market in China

    will continue to grow. BAKED GOODS MARKET SALES RSP 2017- 2022 (USD) 12.7% Forecast CAGR % of baked goods in China 2012-2017. 2017 2018 2019 2020 2021 2022 $28.5bn $32.2bn $36.5bn $41.4bn $47bn $53.3bn $24bn Absolute growth by 2022 (USD). Future market growth
  19. What product characteristics and trends will drive future growth? As

    more consumers in China become health conscious, trends around ingredients and naturals will continue to impact the market for baked goods. Gut Health: The rise of bread products like sourdough Plant-based foods Natural sweeteners: Like Inulin (prebiotic fiber) as sugar and/or flour replacement
  20. 44% The pastry market will double to reach of absolute

    baked good gains will come from cakes. XXXX The average price of pastries in 72% Share of artisanal, non packed baked goods in 2017 0.0 2.0 4.0 6.0 8.0 10.0 12.0 14.0 16.0 2017-2018 2018-2019 2019-2020 2020-2021 2021-2022 Y-O-Y Growth BAKED GOODS CATEGORY Y-O-Y GROWTH 2017-2022 Pastries Cakes Bread Dessert Mixes $22bn by 2022 in China. Pastries and cakes in China will continue to grow as premium treats and gift favorite with healthier options expected to boost growth. Which baked goods will drive future growth?
  21. 12.7% CAGR % (2012-2017)  The Chinese market for baked

    goods has grown $12.8bn absolute gains in the last five years.  China has had the largest baked goods market growth in Asia Pacific historically. $53.5bn Market size 2022  The Chinese market will grow at a 13.3% CAGR from 2017- 2022.  This will lead to $24.7bn in absolute gains.  China is projected to be come the second largest market in the world for baked goods. © Euromonitor International 28 Pastries/Cakes  Pastries are set to grow the fastest in the next five years.  Sweet baked goods in cakes and pastries are worth almost three times more than bread products in China.  These sweet treats are popular for gifts and holidays, leading to higher priced, premium products. Healthy Eating  In the next five years, health conscious trends will continue to influence baked good categories.  More consumers will be looking for functional, better for you baked good products. Pro-US Business  China has made substantial improvements in recent years to encourage foreign investment.  Distribution and logistics remain the largest challenge for international companies looking to work in China. Key Takeaways for Baked Goods in China
  22. intralox.com Helen Xi Introduction Intralox US Relocated to New Orleans

    2016 Global Business Development Manager Mainly focus on America and Europe market Intralox China Started in Shanghai 2011 APAC Business Development Analyst Focus on Bakery business in China, Japan, Australia, SEA.
  23. intralox.com New Orleans Amsterdam Shanghai Sao Paulo Melbourne Tokyo Bangalore

    Birmingham Grand Rapids Maryland Intralox Global Footprint
  24. intralox.com Shanghai • APAC Headquarter • Established in Shanghai 2006

    • Employee: +200 from China, US, Japan, Thailand, etc. • Market Coverage:China, Japan, Korea, Australia, New Zealand, South East Asia countries, etc. • Footprint in China: a sales office, a warehouse and an equipment workshop • Sales model: direct 英特乐中国 Intralox China Located in the Yangtze River Delta Area: 2,448 mi² Population: 24M in 2017
  25. The Company • Founded in 1983 in Santa Barbara, California

    • All manufacturing is done in the USA. • Sales and Service offices located • California • Michigan • United Kingdom • China
  26. China Office • Opened August, 2008 • Location: Zhuhai, Guangdong

    Province, China • Currently have 7 employees • Sales and Service
  27. • Sales • 15% of our business comes from China

    and India China Office • China Trade Shows (Bakery China) • Customers Served • Rich Products • Holliland • Maxims
  28. • 2006 Sourced conveyor system locally for China project •

    2009 “JV” with US company to manufacture conveyor system • 2010 Officially Registered as a ‘WOFE’, separated from JV • 2011 Moved to larger location, increased product offering • 2013 Added 2nd building to extend capacity • 2016 Created additional engineering resource for RBS • 2018 Moving to larger location. Capacity increase 300% Markel Tianjin, China Major Milestones
  29. 5,000 sq mtr manufacturing facility • 1,800 sq mtr Assembly

    • 1,500 sq mtr Administration • 1,700 sq mtr Machining Centre Full Machine Shop Capability • Laser, Water Jet, CNC, Welding, etc Full Service and Installation Support • Dedicated team plus use of factory technicians Dough Technologist -Support • Malaysia – Based Markel Tianjin, China – Capabilities Review Full Engineering Team • Dedicated to AMF • Dedicated to RBS Project Management • Complete whole line systems installed. • (Manufacturing independently after 1 week) Sales Office, Beijing • Machine Sales • Customer Service