$30 off During Our Annual Pro Sale. View Details »

Genomic sketching with HyperLogLog

Ben Langmead
November 07, 2019

Genomic sketching with HyperLogLog

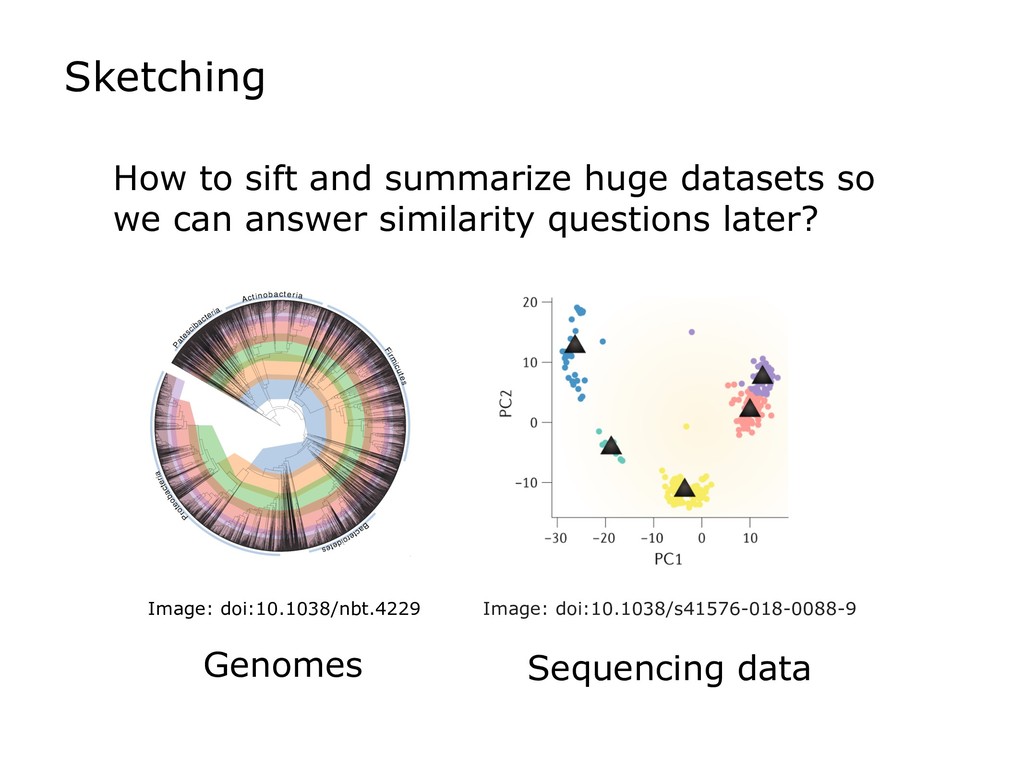
Sketch data structures can be used to distill huge genomics datasets into small summaries. Sketches can then be compared to find, for example, the degree of k-mer similarity between two datasets. This is the basis for a growing number of bionformatics tools solving an array of problems, e.g. clustering genomes, searching for datasets with certain sequence content, accelerating the overlapping step in genome assemblers, or mapping sequencing reads.

I will discuss the basic problems addressed by sketches, with a focus on MinHash and HyperLogLog. I will suggest a unified way of thinking about these, which are often described in different terms (e.g. "ordered" versus "bit-pattern observable"). I will further relate these structures to Bloom filters, which have found many applications in bioinformatics.

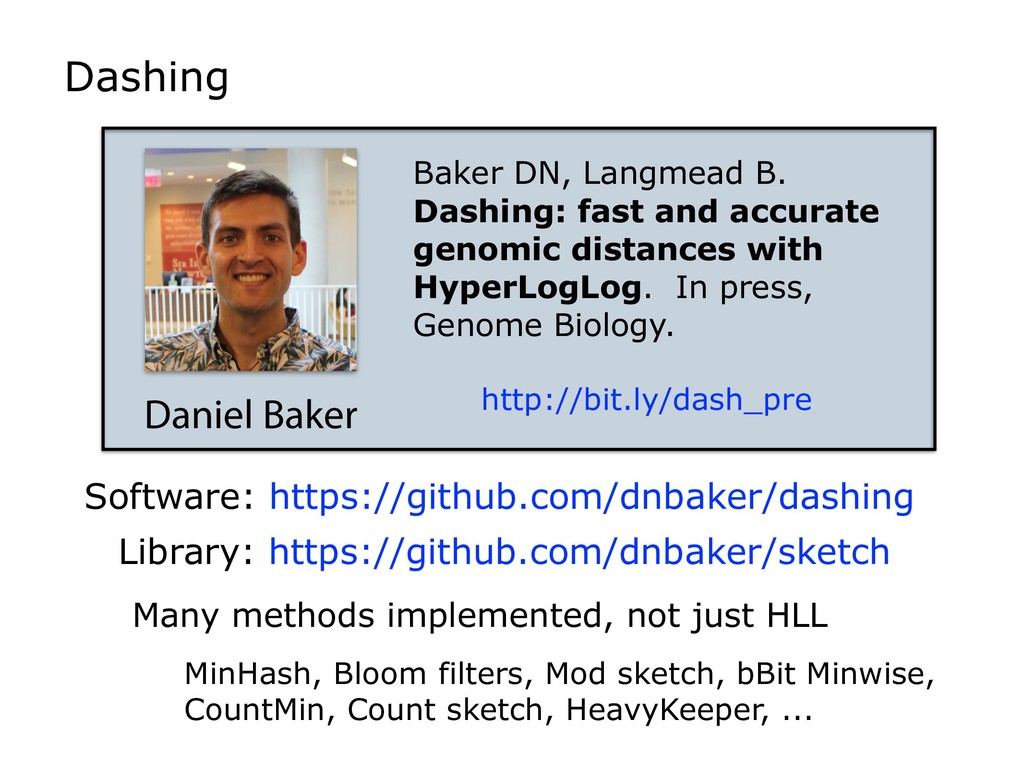
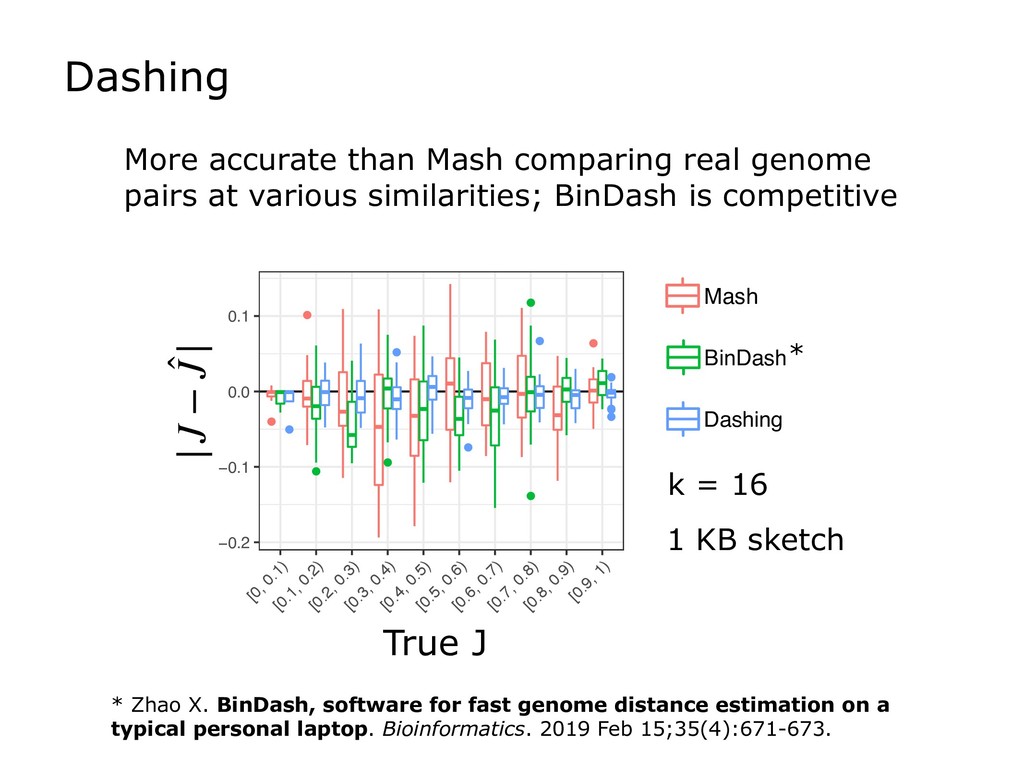
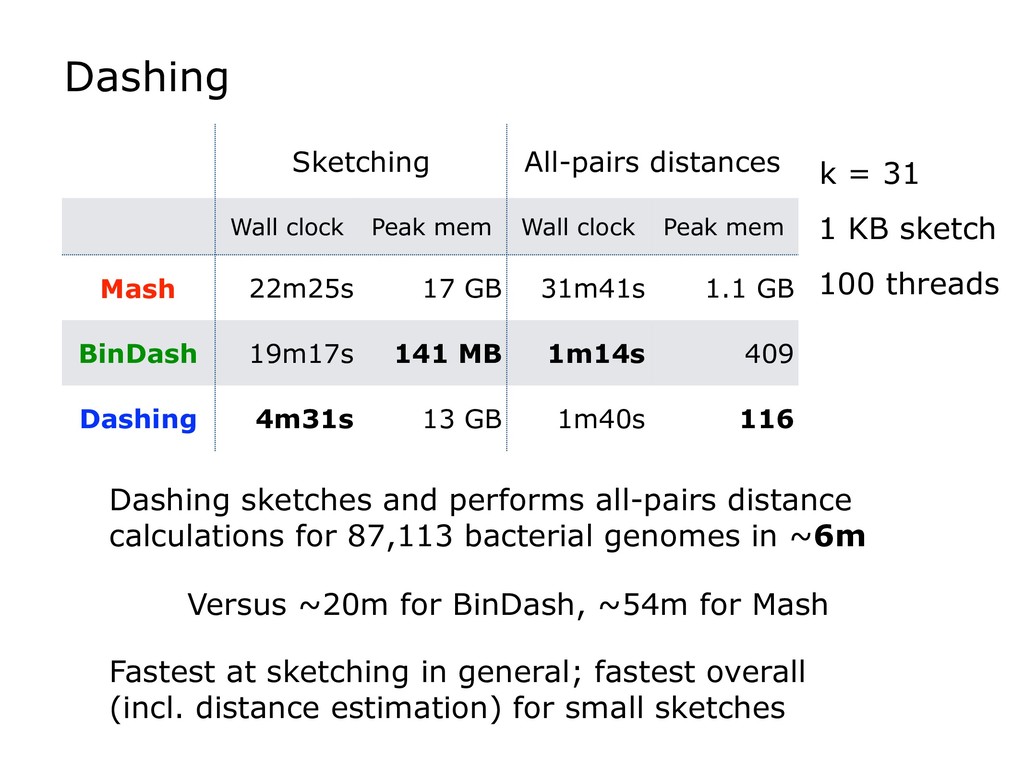
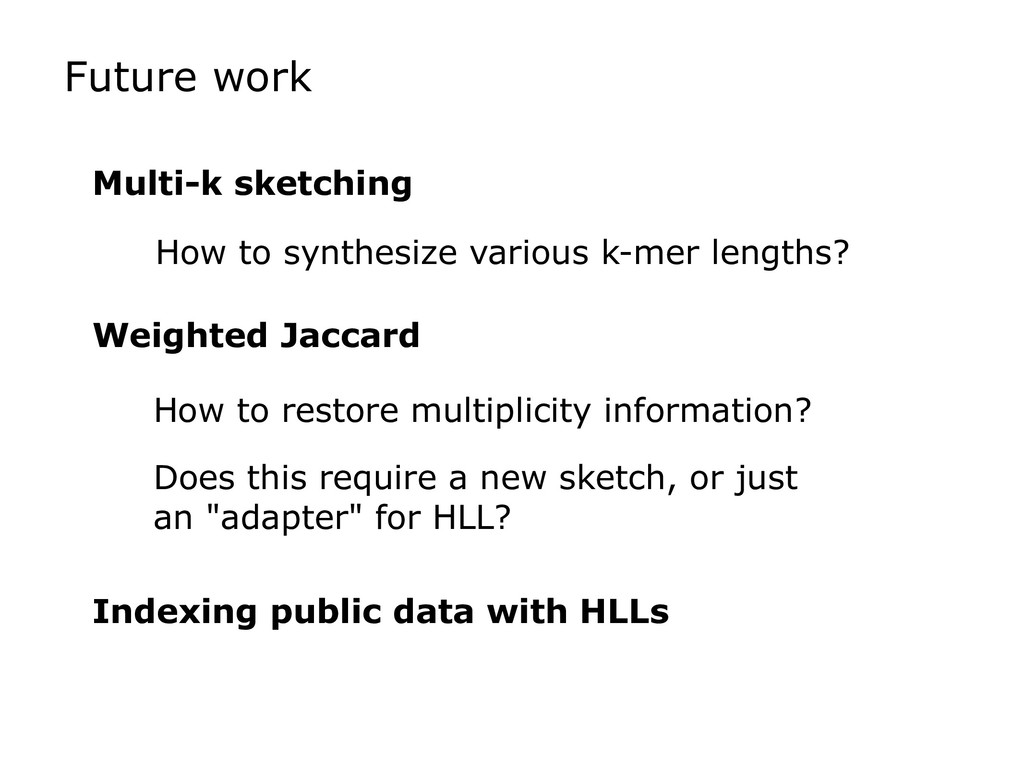
Finally, I will discuss how HyperLogLog is used in the new Dashing software tool, which tackles a similar set of sequence-similarity problems as Mash and BinDash. I will show how HyperLogLog helps address a major issue with MinHash, namely its lower accuracy in cases where one of the sets being compared is much smaller than the other. Finally, I will discuss how the ability to create sketches efficiently enables further accuracy improvements, for example, by making it easier to sketch across an array of k-mer sizes.

Ben Langmead

November 07, 2019
Tweet

More Decks by Ben Langmead

Other Decks in Research

Transcript

  1. Ben Langmead
    JHU Computer Science
    [email protected], langmead-lab.org, @BenLangmead
    Genome Informatics, Cold Spring Harbor Laboratory
    November, 2019
    Genomic sketching with HyperLogLog
    Tweetable

    View Slide

  2. Sketching
    How to sift and summarize huge datasets so
    we can answer similarity questions later?
    Genomes Sequencing data
    Image: doi:10.1038/nbt.4229
 Image: doi:10.1038/s41576-018-0088-9

    View Slide

  3. Sketching
    Capture extreme or
    informative items
    k-merize
    Sample
    FASTA
    FASTA
    FASTQ
    FASTQ
    (shingle)

    View Slide

  4. Cardinality
    Biological
    relatedness
    AGGCCACAGTGTATTATGACTG
    ||||||||||| |||||||||
    AGGCCACAGTGAGTTATGACTG
    AAAAAAAAAAAGATGT-AAGTA
    |||||||||||||||| |||||
    AAAAAAAAAAAGATGTAAAGTA
    GAGG--TCAGATTCACAGCCAC
    |||| ||||||||||||||||
    GAGGGGTCAGATTCACAGCCAC
    Set
    similarities
    J =
    |A ∩ B|
    |A ∪ B|
    Cardinalities
    |A|
    |B|
    |A ∪ B|
    |A ∩ B|
    C =
    |A ∩ B|
    |A|

    View Slide

  5. 342
    830
    017
    332
    525
    092
    709
    I take cards labeled
    1--1,000 and choose a
    random subset of size n
    to hide in my hat
    You may see one
    representative from the cards
    in the hat; which to pick?
    You would like
    to estimate n
    Hat problem

    View Slide

  6. What if minimum was 500?
    Estimate should grow as minimum shrinks
    ...10? ... 4?
    Hat problem
    0 999
    min = 40
    40 ≈ 1000/(n + 1)
    n ≈ 24
    Easy to compute, fits in 10 bits

    View Slide

  7. Hat analogy seems
    contrived...
    ...but matches the
    situation where we
    hash items up front
    0x39AD49CC
    0x9FAA176B
    h(x)
    AAAB63icbZDLSgMxFIbP1Futt6pLN8Ei1E2ZEUGXRTcuK9gLtEPJpJlOaJIZkoxYhr6CGxeKuPWF3Pk2ZtpZaOsPgY//nEPO+YOEM21c99spra1vbG6Vtys7u3v7B9XDo46OU0Vom8Q8Vr0Aa8qZpG3DDKe9RFEsAk67weQ2r3cfqdIslg9mmlBf4LFkISPY5FZUfzofVmtuw50LrYJXQA0KtYbVr8EoJqmg0hCOte57bmL8DCvDCKezyiDVNMFkgse0b1FiQbWfzXedoTPrjFAYK/ukQXP390SGhdZTEdhOgU2kl2u5+V+tn5rw2s+YTFJDJVl8FKYcmRjlh6MRU5QYPrWAiWJ2V0QirDAxNp6KDcFbPnkVOhcNz/L9Za15U8RRhhM4hTp4cAVNuIMWtIFABM/wCm+OcF6cd+dj0Vpyiplj+CPn8wdvb43T
    AAAB63icbZDLSgMxFIbP1Futt6pLN8Ei1E2ZEUGXRTcuK9gLtEPJpJlOaJIZkoxYhr6CGxeKuPWF3Pk2ZtpZaOsPgY//nEPO+YOEM21c99spra1vbG6Vtys7u3v7B9XDo46OU0Vom8Q8Vr0Aa8qZpG3DDKe9RFEsAk67weQ2r3cfqdIslg9mmlBf4LFkISPY5FZUfzofVmtuw50LrYJXQA0KtYbVr8EoJqmg0hCOte57bmL8DCvDCKezyiDVNMFkgse0b1FiQbWfzXedoTPrjFAYK/ukQXP390SGhdZTEdhOgU2kl2u5+V+tn5rw2s+YTFJDJVl8FKYcmRjlh6MRU5QYPrWAiWJ2V0QirDAxNp6KDcFbPnkVOhcNz/L9Za15U8RRhhM4hTp4cAVNuIMWtIFABM/wCm+OcF6cd+dj0Vpyiplj+CPn8wdvb43T
    AAAB63icbZDLSgMxFIbP1Futt6pLN8Ei1E2ZEUGXRTcuK9gLtEPJpJlOaJIZkoxYhr6CGxeKuPWF3Pk2ZtpZaOsPgY//nEPO+YOEM21c99spra1vbG6Vtys7u3v7B9XDo46OU0Vom8Q8Vr0Aa8qZpG3DDKe9RFEsAk67weQ2r3cfqdIslg9mmlBf4LFkISPY5FZUfzofVmtuw50LrYJXQA0KtYbVr8EoJqmg0hCOte57bmL8DCvDCKezyiDVNMFkgse0b1FiQbWfzXedoTPrjFAYK/ukQXP390SGhdZTEdhOgU2kl2u5+V+tn5rw2s+YTFJDJVl8FKYcmRjlh6MRU5QYPrWAiWJ2V0QirDAxNp6KDcFbPnkVOhcNz/L9Za15U8RRhhM4hTp4cAVNuIMWtIFABM/wCm+OcF6cd+dj0Vpyiplj+CPn8wdvb43T
    AAAB63icbZDLSgMxFIbP1Futt6pLN8Ei1E2ZEUGXRTcuK9gLtEPJpJlOaJIZkoxYhr6CGxeKuPWF3Pk2ZtpZaOsPgY//nEPO+YOEM21c99spra1vbG6Vtys7u3v7B9XDo46OU0Vom8Q8Vr0Aa8qZpG3DDKe9RFEsAk67weQ2r3cfqdIslg9mmlBf4LFkISPY5FZUfzofVmtuw50LrYJXQA0KtYbVr8EoJqmg0hCOte57bmL8DCvDCKezyiDVNMFkgse0b1FiQbWfzXedoTPrjFAYK/ukQXP390SGhdZTEdhOgU2kl2u5+V+tn5rw2s+YTFJDJVl8FKYcmRjlh6MRU5QYPrWAiWJ2V0QirDAxNp6KDcFbPnkVOhcNz/L9Za15U8RRhhM4hTp4cAVNuIMWtIFABM/wCm+OcF6cd+dj0Vpyiplj+CPn8wdvb43T
    0xDF89114B
    { , , , , , ..., }
    Hat problem
    - hash function

    View Slide

  8. Two-hat problem
    B
    A
    Can we estimate cardinality
    of unions? Intersections?
    About coincidences
    Cardinalities
    |A|
    |B|
    |A ∪ B|
    |A ∩ B|

    View Slide

  9. A
    B
    Space of coincidences is large
    Image inspired by: Ondov B, Starrett G, Sappington A, Kostic A, Koren S, Buck
    CB, Phillippy AM. Mash Screen: high-throughput sequence containment
    estimation for genome discovery. Genome Biol 20, 232 (2019)
    Need multiple representatives per set
    Two-hat problem

    View Slide

  10. Bottom k
    A
    B
    Instead of minimum only, consider "bottom 3"
    "Bottom-k sketch" can estimate cardinalities
    of unions and intersections
    Larger k averages more, improving estimate

    View Slide

  11. k-partition
    A
    B
    Instead of bottom-3, consider minimum in
    each of 3 partitions
    Accomplishes something similar to bottom-k

    View Slide

  12. Mash
    Bottom-k
    MinHash sketch
    1. Ondov BD, Treangen TJ, Melsted P,
    Mallonee AB, Bergman NH, Koren S,
    Phillippy AM. Mash: fast genome and
    metagenome distance estimation using
    MinHash. Genome Biol. 2016 Jun
    20;17(1):132.
    2. Broder AZ. On the resemblance and
    containment of documents. Compression
    and Complexity of Sequences 1997 -
    Proceedings 1998:21–29.
    A
    B
    Image: ref 1

    View Slide

  13. Mash
    Representative fits in
    bits
    U is often 32 or 64
    ⌈log2
    U⌉
    1. Ondov BD, Treangen TJ, Melsted P, Mallonee AB, Bergman NH, Koren S,
    Phillippy AM. Mash: fast genome and metagenome distance
    estimation using MinHash. Genome Biol. 2016 Jun 20;17(1):132.
    Image: ref 1

    View Slide

  14. Log vs LogLog
    Instead of minimum, say we use log-minimum
    min
    0x030F6556 ⌊log2
    ⌋ 25
    Estimate is of ; can re-exponentiate
    later, but with added variance & bias
    ⌊log2
    n⌋
    Representatives take
    rather than bits
    log log U
    log U
    Pro:
    Con:
    32 bits
    6 x 5 bits

    View Slide

  15. Dashing
    Daniel Baker
    Baker DN, Langmead B.
    Dashing: fast and accurate
    genomic distances with
    HyperLogLog. In press,
    Genome Biology.
    http://bit.ly/dash_pre
    Software: https://github.com/dnbaker/dashing
    Library: https://github.com/dnbaker/sketch
    Many methods implemented, not just HLL
    MinHash, Bloom filters, Mod sketch, bBit Minwise,
    CountMin, Count sketch, HeavyKeeper, ...

    View Slide

  16. HyperLogLog
    HLL
    Input items
    11110011
    11110011
    11110011
    11110011
    001 01001
    110 00001
    ...
    ...
    Hash values


    ...
    ...

    Register 000
    01001 10001
    10101 10110
    00100
    Register 001
    00100 10110
    01011 10101
    00010 01011
    11111 11110
    Register 010
    Register 011
    Register 111
    ...
    Hash
    Take
    prefix
    Cardinality
    Estimate
    3
    2 ~ 22
    ~ 23
    ...
    ... ...
    ...
    p q
    ...
    ...
    ...
    ...
    Overall
    Estimate
    Baker DN, Langmead B. Dashing: fast and accurate genomic
    distances with HyperLogLog. In press, Genome Biology.
    1. k-partition
    2. ⌊log2
    n⌋
    3. Re-exponentiation
    4. Averaging,
    bias correction

    View Slide

  17. Trick 1: SIMD instructions
    8-bit registers
    well suited to
    vectorized (SIMD)
    instructions
    Union equals
    elementwise min:
    HLL(A) HLL(B) HLL(A U B)
    PMINUB
    VPMINUB
    VPMINUB
    AVX2
    AVX512-BW
    SSE2
    ...
    ...
    ...

    View Slide

  18. Trick 2: Changing log base
    0x030F65A691DD9010
    25
    64 bits
    6 bits
    ⌊log1.19

    8 bits
    min
    ⌊log2

    101
    Waste
    Register
    array
    Register
    array
    LZC or

    View Slide

  19. Dashing
    HLL handles lopsided sets
    better than bottom-k
    MinHash 1,2
    1. Koslicki, David, and Hooman Zabeti. Improving
    MinHash via the containment index with
    applications to metagenomic analysis. Applied
    Mathematics and Computation 354 (2019): 206-215.
    2. Ondov B, Starrett G, Sappington A, Kostic A, Koren S,
    Buck CB, Phillippy AM. Mash Screen: high-throughput
    sequence containment estimation for genome
    discovery. Genome Biol 20, 232 (2019)
    MinHash
    HLL
    J = 0.111
    |J − ̂
    J|
    log2
    (sketch bytes)

    View Slide

  20. Dashing


    ● ●


    −0.2
    −0.1
    0.0
    0.1
    [0, 0.1)
    [0.1, 0.2)
    [0.2, 0.3)
    [0.3, 0.4)
    [0.4, 0.5)
    [0.5, 0.6)
    [0.6, 0.7)
    [0.7, 0.8)
    [0.8, 0.9)
    [0.9, 1)
    True J
    Est J − True J
    k = 16, log2
    (sketch bytes) = 10


    −0.025
    0.000
    0.025
    0.050
    [0, 0.1)
    [0.1, 0.2)
    [0.2, 0.3)
    [0.3, 0.4)
    [0.4, 0.5)
    [0.5, 0.6)
    [0.6, 0.7)
    [0.7, 0.8)
    [0.8, 0.9)
    True J
    Est J − True J
    k = 16, log2
    (sketch bytes) = 14

    0.2
    0.3
    k = 21, log2
    (sketch bytes) = 10


    0.06
    k = 21, log2
    (sketch bytes) = 14


    ● ●
    −0.2
    −0.1
    [0, 0.1)
    [0.1, 0.2)
    [0.2, 0.3)
    [0.3, 0.4)
    [0.4, 0.5)
    [0.5, 0.6)
    [0.6, 0.7)
    [0.7, 0.8)
    [0.8, 0.9)
    [0.9, 1)
    True J
    −0.06
    −0.03
    [0, 0.
    Mash BinDash Dashin
    More accurate than Mash comparing real genome
    pairs at various similarities; BinDash is competitive
    |J − ̂
    J|
    True J


    ● ●


    −0.2
    −0.1
    0.0
    [0, 0.1)
    [0.1, 0.2)
    [0.2, 0.3)
    [0.3, 0.4)
    [0.4, 0.5)
    [0.5, 0.6)
    [0.6, 0.7)
    [0.7, 0.8)
    [0.8, 0.9)
    [0.9, 1)
    True J
    Est J
    −0.06
    −0.03
    0.00
    [0, 0.1)
    [0.1, 0.2)
    [0.2, 0.3)
    [0.3
    Est J
    Mash BinDash Dashing (MLE)


    −0.2
    −0.1
    0.0
    0.1
    [0, 0.1)
    [0.1, 0.2)
    [0.2, 0.3)
    [0.3, 0.4)
    [0.4, 0.5)
    [0.5, 0.6)
    [0.6, 0.7)
    [0.7, 0.8)
    [0.8, 0.9)
    [0.9, 1)
    True J
    Est J − True


    −0.06
    −0.03
    0.00
    0.03
    [0, 0.1)
    [0.1, 0.2)
    [0.2, 0.3)
    [0.3, 0.4)
    [0.4, 0.5)
    [0.5, 0.6)
    [0.6
    True J
    Est J − True
    Mash BinDash Dashing (MLE)
    k = 16
    1 KB sketch
    * Zhao X. BinDash, software for fast genome distance estimation on a
    typical personal laptop. Bioinformatics. 2019 Feb 15;35(4):671-673.
    *

    View Slide

  21. Dashing
    Dashing sketches and performs all-pairs distance
    calculations for 87,113 bacterial genomes in ~6m
    Fastest at sketching in general; fastest overall
    (incl. distance estimation) for small sketches
    Sketching All-pairs distances
    Wall clock Peak mem Wall clock Peak mem
    Mash 22m25s 17 GB 31m41s 1.1 GB
    BinDash 19m17s 141 MB 1m14s 409
    Dashing 4m31s 13 GB 1m40s 116
    k = 31
    1 KB sketch
    Versus ~20m for BinDash, ~54m for Mash
    100 threads

    View Slide

  22. Future work
    Multi-k sketching
    Weighted Jaccard
    Indexing public data with HLLs
    How to synthesize various k-mer lengths?
    How to restore multiplicity information?
    Does this require a new sketch, or just
    an "adapter" for HLL?

    View Slide

  23. Funding:
    • NSF: IIS-1349906
    • NIH: R01GM118568
    • XSEDE: TG-CIE170020
    Looking for Ph.D. students;
    write to [email protected]
    or chat with me
    Daniel Baker
    JHU:
    • Brad Solomon
    Software: https://github.com/dnbaker/dashing
    Library: https://github.com/dnbaker/sketch
    Preprint: http://bit.ly/dash_pre
    MinHash HyperLogLog
    Representatives come
    from min
    Store representatives in
    log U bits
    Representatives come
    from log-min (LZC)
    Bottom-k for averaging
    (in Mash)
    k-partition for averaging
    Store representatives in
    log log U bits

    View Slide

  24. References
    Broder AZ. On the resemblance and containment of documents.
    Compression and Complexity of Sequences 1997 - Proceedings
    1998:21–29.
    Koslicki, David, and Hooman Zabeti. Improving MinHash via the
    containment index with applications to metagenomic analysis.
    Applied Mathematics and Computation 354 (2019): 206-215.
    Ondov BD, Treangen TJ, Melsted P, Mallonee AB, Bergman NH, Koren
    S, Phillippy AM. Mash: fast genome and metagenome distance
    estimation using MinHash. Genome Biol. 2016 Jun 20;17(1):132.
    MinHash
    Mash
    Containment
    MinHash
    Zhao X. BinDash, software for fast genome distance estimation on a
    typical personal laptop. Bioinformatics. 2019 Feb 15;35(4):671-673.
    BinDash
    Ertl, O.: New cardinality estimation algorithms for hyperloglog
    sketches. CoRR abs/1702.01284 (2017). 1702.01284
    HLL card.
    estimation
    Dashing
    Baker DN, Langmead B. Dashing: fast and accurate genomic
    distances with HyperLogLog. In press, Genome Biology.
    Preprint: http://bit.ly/dash_pre

    View Slide