Upgrade to Pro — share decks privately, control downloads, hide ads and more …

GrimoireCon 2017 Brussels - Building visualizations (training)

Bitergia
February 03, 2017

GrimoireCon 2017 Brussels - Building visualizations (training)

Slides for GrimoireCon 2017 Brussels tutorial/training about building Grimoire Lab visualizations and dashboards

Bitergia

February 03, 2017
Tweet

More Decks by Bitergia

Other Decks in Technology

Transcript

  1. Outline Bitergia Analytics Dashboard The Kibana editor Visualizations and Searches

    Modifying and creating dashboards Dashboard: https://xxx.biterg.io Editor: https://xxx.biterg.io/edit ElasticSearch: https://xxx.biterg.io/data
  2. Architecture Original Data Sources Mining Tools Perceval @ GrimoireLab Info

    Enrich. GrimoireELK @ GrimoireLab Viz ElasticSearch + Kibiter (Kibana4)
  3. Some Features Drill down Time frame selection Sharing / embedding

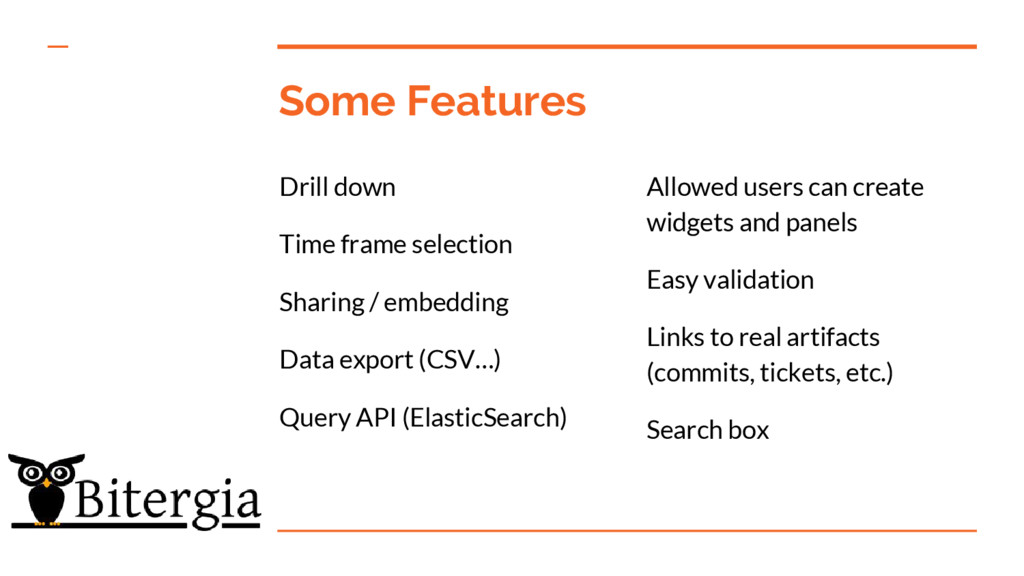
    Data export (CSV…) Query API (ElasticSearch) Allowed users can create widgets and panels Easy validation Links to real artifacts (commits, tickets, etc.) Search box
  4. Kibana editor for the dashboard Same data, with interface for

    editing - Edit & create visualizations - Tweak searches - Build your own panels
  5. Main components Index patterns (mapping to ES indexes) Searches (may

    include filters) Visualizations (on top of searches or indexes) Dashboards (panels)
  6. Index patterns Mapping in Kibana of one or more Elasticsearch

    indexes Fields of different types (number, string, date) Unfolding items, field contents are shown… ...and they can be used as filters
  7. Searches Views for index patterns May include a filter May

    include only some fields Can be included in a dashboard Can be saved / recovered
  8. Visualizations Based on an index pattern, or in a search

    Different kinds Data organized in metrics and buckets Can be saved / retrieved / edited
  9. Dashboards (panels) Visualizations can be added, removed, moved, edited Dashboards

    can be saved, retrieved Filters, date filters can be saved with the dashboard
  10. How to play You can create your own Start by

    saving panels with a new name Edit visualizations (save with different names) If needed, modify the searches
  11. ElasticSearch All indexes available from ElasticSearch instance You can query

    live REST HTTP interface Modules for Java, JavaScript, Python, and many more languages
  12. ElasticSearch (just checking) $ curl -XGET 'https://user:[email protected]/data' { "name" :

    "Morpheus", "cluster_name" : "elasticsearch", "version" : { "number" : "2.2.2", "build_hash" : "fcc01dd81f4de6b2852888450ce5a56436fd5852", "build_timestamp" : "2016-03-29T08:49:35Z", "build_snapshot" : false, "lucene_version" : "5.4.1" }, "tagline" : "You Know, for Search" }
  13. ElasticSearch (index description) $ curl -XGET 'https://user:[email protected]/data/git?pretty=true' { "git_project_160620_enriched_160913" :

    { "aliases" : { "git" : { } }, "mappings" : { "items" : { "dynamic" : "true", "properties" : { "Author" : { "type" : "string", "index" : "not_analyzed" }, "Committer" : { ...
  14. ElasticSearch (query for data) $ curl --silent -XPOST \ 'https://user:[email protected]/data/git/_search?q=lines_changed:0'

    ... { "_index": "git_project_160620_enriched_160913", "_type": "items", "_id": “...", "_source": { "is_git_commit": 1, "commit_date": "2013-09-10T21:29:28", "files": 1, "hash_short": "6bfe1f", "author_domain": "ifup.org", "message_analyzed": "Merge pull request #213 from...", ...
  15. Documentation A lot of documentation & videos are available: -

    GrimoireLab Training https://jgbarah.gitbooks.io/grimoirelab-training/ - ElasticSearch: The Definitive Guide https://www.elastic.co/guide/en/elasticsearch/guide/current/index.html - Kibana User Manual https://www.elastic.co/guide/en/kibana/current/index.html
  16. Come and play Feel free to play with the dashboard

    Warn us if you break something! (We can recover from scratch) Create your own visualizations, panels We're creating documentation for fields in indexes