Upgrade to Pro — share decks privately, control downloads, hide ads and more …

AAGW3 - Buhendra Bhaduri - Data Streams, Access Portals, and Tools for Integration and Analysis

CGIAR-CSI
March 22, 2013

AAGW3 - Buhendra Bhaduri - Data Streams, Access Portals, and Tools for Integration and Analysis

CGIAR-CSI

March 22, 2013
Tweet

More Decks by CGIAR-CSI

Other Decks in Research

Transcript

  1. Data Streams, Access Portals, and Tools for Integration and Analysis

    Presented at Africa Agriculture GIS Week Application of Spatial Science in African Research and Development Budhendra Bhaduri Corporate Research Fellow March 12, 2012 Addis Ababa, Ethiopia
  2. Managed by UT-Battelle for the U.S. Department of Energy 

    World’s most powerful open scientific computing facility  Nation’s largest concentration of open source materials research ORNL is DOE’s largest science and energy laboratory  $1.6B budget  4,400 employees  3,900 research guests annually  $350 million invested in modernization  Nation’s most diverse energy portfolio  Operating the world’s most intense pulsed neutron source  Managing the billion- dollar U.S. ITER project
  3. Managed by UT-Battelle for the U.S. Department of Energy Climate

    change science Observation Experiments Computing Model development Global scale National scale Regional scale Landscape scale Local scale Process Models and Earth System Models Knowledge Systems for Sustainability Lab-to-Field-Scale Experiments & Observations Translation of fundamental science to societal benefit is an important goal for Oak Ridge National Laboratory
  4. 4 Managed by UT-Battelle for the U.S. Department of Energy

    Presentation_name Geospatial Cyberinfrastructure • Provides access to best in class, geographically distributed resources – Data – Scalable computation – Visualization • Platform for data integration and knowledge dissemination • Enables on time and on demand information and knowledge delivery, particularly for time critical mission support
  5. 5 Managed by UT-Battelle for the Department of Energy Environmental

    Data Science & Systems – Atmospheric Radiation Measurements (ARM) Archive – Carbon Dioxide Information and Analysis Center (CDIAC) – NASA Distributed Active Archive Center (DAAC) – USA National Phenology Network – National Biological Information Infrastructure Provide data management and analysis for large, integrated environmental databases to the nation’s research community and policymakers
  6. 6 Managed by UT-Battelle for the U.S. Department of Energy

    ARM Data Archive • The Atmospheric Radiation Measurement (ARM) Climate Research Facility is a U.S. Department of Energy scientific user facility for the study of global climate change by the national and international research community.
  7. 7 Managed by UT-Battelle for the U.S. Department of Energy

    • Provide comprehensive data, information, and research support to national and international modeling efforts, researchers and societal interests Established 1982 • 300 databases include multi- disciplinary, multi-agency, multi- national data and information – Carbon cycle (GHG emissions, land-use change, terrestrial fluxes) – Trace gases (atmospheric and oceanic) – Climatic data • Satisfy ~350,000 requests for data worldwide annually www.climatemodeling.org/c-lamp
  8. 8 Managed by UT-Battelle for the Department of Energy NASA

    Distributed Active Archive Center (DAAC): Biogeochemical dynamics, ecological data, and environmental processes 3. Regional and Global Studies (178) • Climate • Soils • Vegetation • Hydroclimatology 2. Validation of Land Products (21) Total Data Sets = 885 1. Field Campaigns (676) • FIFE • OTTER • SNF • BOREAS • LBA BOREAS LBA LBA S2K S2K In-situ Observations ? Remote Sensing LAI/fPAR NPP • Land Validation • MODIS Subsets • FLUXNET • NPP • BigFoot LAI/fPAR NPP 4. Model Products (9) • Benchmark Models •IBIS, BIOME-BGC, LSM • Manuscript Models •PNeT, Century, Biome-BGC
  9. 9 Managed by UT-Battelle for the Department of Energy Daymet:

    Daily surface weather interpolation • Daymet uses daily surface weather observations from a distributed station network to generate interpolated (and extrapolated) surfaces. • Inputs: Daily maximum and minimum temperature, daily total precipitation, station locations, and a high-quality digital elevation model (DEM) • Outputs: Gridded daily temperatures, precipitation occurrence and amount, humidity, and incident shortwave radiation. Also numerous climatological summaries based on the daily surfaces • Cross-validation error statistics are a default output Peter Thornton et al. Sponsors: NASA Earth Science: Terrestrial Ecology Program DOE Office of Science: Biological and Environmental Research
  10. 12 Managed by UT-Battelle for the Department of Energy 1970:

    2,587 stations 2000: 50 stations Distribution of surface weather stations (daily precipitation)
  11. 14 Managed by UT-Battelle for the U.S. Department of Energy

    Spatio-Temporal Exploratory Model identifies factors affecting patterns of migration Diverse bird observations and environmental data from 300,00 locations in the US integrated and analyzed using High Performance Computing Resources DataONE: Enabling Science Collaboration Land Cover Meteorology MODIS – Remote sensing data • Examine patterns of migration • Infer how climate change may affect bird migration Model results Occurrence of Indigo Bunting (2008) Jan Sep Dec Jun Ap r
  12. 15 Managed by UT-Battelle for the U.S. Department of Energy

    USA National Phenology Network Key Goal: Understand how plants, animals and landscapes respond to environmental variation and climate change. ORNL developed the initial cyberinfrastructure and is funded by USGS for continued collaboration. 2005 Start of Season (SOS) “Phenology…is perhaps the simplest process in which to track changes in the ecology of species in response to climate change.” (IPCC 2007)
  13. Managed by UT-Battelle for the Department of Energy LandScan Population

    Distribution and Dynamics Model and Database Census Gridded Day Night LandScan Global LandScan USA As the finest population distribution data ever produced for the world and the US, LandScan Global and LandScan USA are the community standard for estimating population at risk
  14. 18 Managed by UT-Battelle for the U.S. Department of Energy

    Presentation_name LandScan Data Accessed Through Google Earth Interface
  15. 19 Managed by UT-Battelle for the U.S. Department of Energy

    Presentation_name Spatial refinement of LandScan Global
  16. 20 Managed by UT-Battelle for the U.S. Department of Energy

    Presentation_name Addis Ababa, Ethiopia  2 Xeon Quad core 2.4GHz CPUs + 4 Tesla GPUs + 48GB  Image analyzed (0.3m)  40,000x40,000 pixels (800 sq. km)  RGB bands  Overall accuracy 93%  Settlement class 89%  Non-settlement class 94%  Total processing time  27 seconds
  17. 21 Managed by UT-Battelle for the U.S. Department of Energy

    Presentation_name Neighborhood mapping: From local interactions to global realizations Damascus, Syria •Very loosely structured •Historical ethnic quarters/neighborhoods •Poor residents currently being displaced in some areas with urban development/tourism •Formal Urban Planning •Typical Urban Services •Middle to Upper Income •Unstructured Settlements •Lowest to lower middle income •Rural migrants
  18. 22 Managed by UT-Battelle for the U.S. Department of Energy

    Presentation_name Settlement characterization tool
  19. AERIAL VIDEO ANALYSIS Scene features exploited in aerial video analysis

    A. M. Cheriyadat, “Learning scene categories from high resolution satellite image for aerial video analysis,” Proc. of IEEE Computer Vision and Pattern Recognition Workshops (CVPRW), 2011
  20. 24 Managed by UT-Battelle for the U.S. Department of Energy

    Presentation_name Rapid Scene Analysis Play uavrun1output.avi
  21. Managed by UT-Battelle for the U.S. Department of Energy Soybeans

    Sunflower Corn June 20,2007 Fargo,ND July 19,2007 Soybeans Sunflower Corn Fargo,ND
  22. 27 Managed by UT-Battelle for the U.S. Department of Energy

    Presentation_name Design and develop a robust and scalable spatiotemporal data mining framework utilizing high resolution spatial and temporal data streams (MODIS and AWiFS) Geocomputation based strategy Preprocessing •Reprojection •Atmospheric corrections •Time series filtering Change detection •Time series prediction •Unsupervised multidimensional geospatial image clustering Change characterization •Classification •Phenology-based •Crop Type-based Google Earth NASA World Wind Other thin clients Greenup Onset Dormancy Onset Peak Length of growing season Key features of crop phenology
  23. 28 Managed by UT-Battelle for the U.S. Department of Energy

    Presentation_name • MODIS NDVI Time Series from Iowa – 6 years (2001 – 2006) – 23 observations per year • Trained for first 5 years and monitored last year • Accuracy was 88% on a validation set consisting of 97 labeled time series with 13 true changes Observed Predicted Variance No Change Varun Chandola, Ranga Raju Vatsavai: Scalable Time Series Change Detection for Biomass Monitoring Using Gaussian Process. NASA CIDU 2010: 69-82 (One of the best papers, invited to SADM Journal). Change Successful change prediction with Gaussian Process Model
  24. 29 Managed by UT-Battelle for the U.S. Department of Energy

    Presentation_name Wide area biomass monitoring in near real time is becoming a reality • 41,105 seconds (11.4 hours) Serial • 5,872 seconds (1.6 hours) Threads (16) • 604 seconds (10 minutes) MPI (96 nodes) • 34 seconds MPI + Threads (1536 cores) • MODIS Tile (4800x4800 pixels) – ~23 million locations/time series – 161 time steps (bi-weekly over 7 years) • FROST: An SGI Altrix ICE 8200 Cluster at ORNL – 128 compute nodes each with 16 virtual cores and 24 GB of RAM • Multicore (multithreaded) and Distributed (message passing) computing strategy
  25. 30 Managed by UT-Battelle for the U.S. Department of Energy

    Presentation_name Bioenergy Knowledge Discovery Framework • Integration of ~1500 data and map services; knowledgebase, models, and advanced analytical tools • Dynamic mapping for Billion Ton Update database (45 million records) • Programmatic cost savings and reusability (Energy Geoplatform for Open Data Initiative) 30 Facilitate informed decision by providing a means to synthesize, analyze, and visualize vast amounts of information http://bioenergykdf.net
  26. 31 Managed by UT-Battelle for the U.S. Department of Energy

    Presentation_name What’s in the Bioenergy KDF? • ~1400 curated spatial data sources • 1206 downloadable data, 1147 Map Services • Billion Ton update Databases • ~ 200 curated resources describing models and important journal articles • 113 Web resources Knowledge Bases • Resources links to 38 domain models • Commodity routing model • Infrastructure planning model Models • Geospatial and Graphical Visualization • Spatial Analysis and Querying • Faceted Search Tools
  27. 32 Managed by UT-Battelle for the U.S. Department of Energy

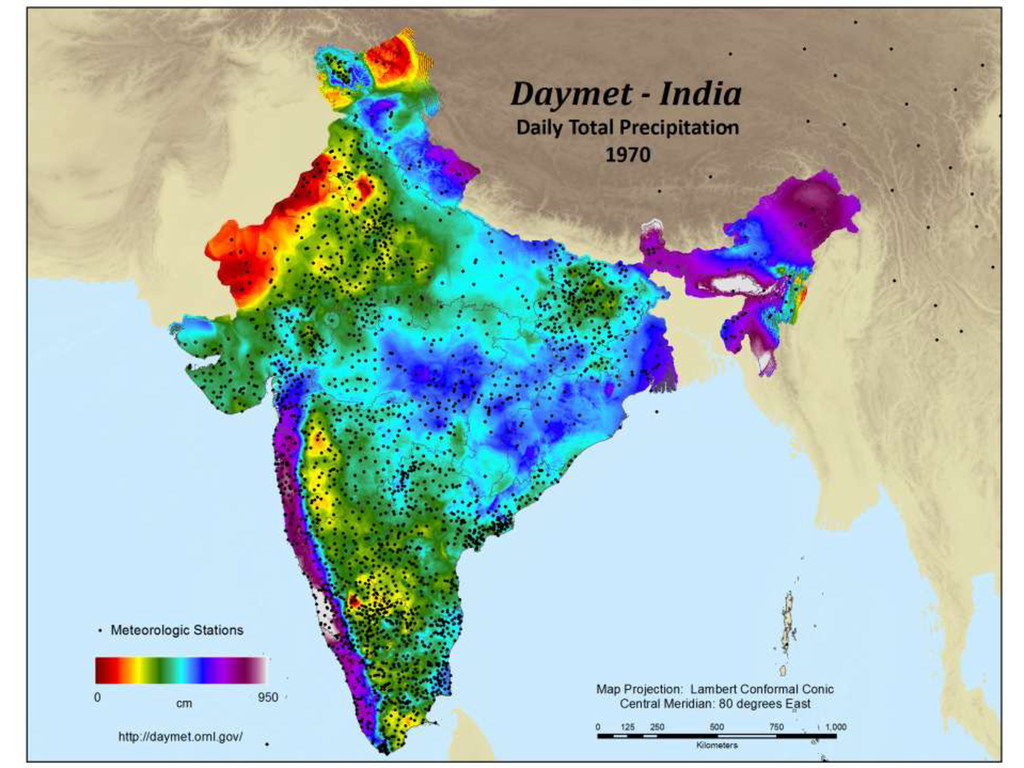
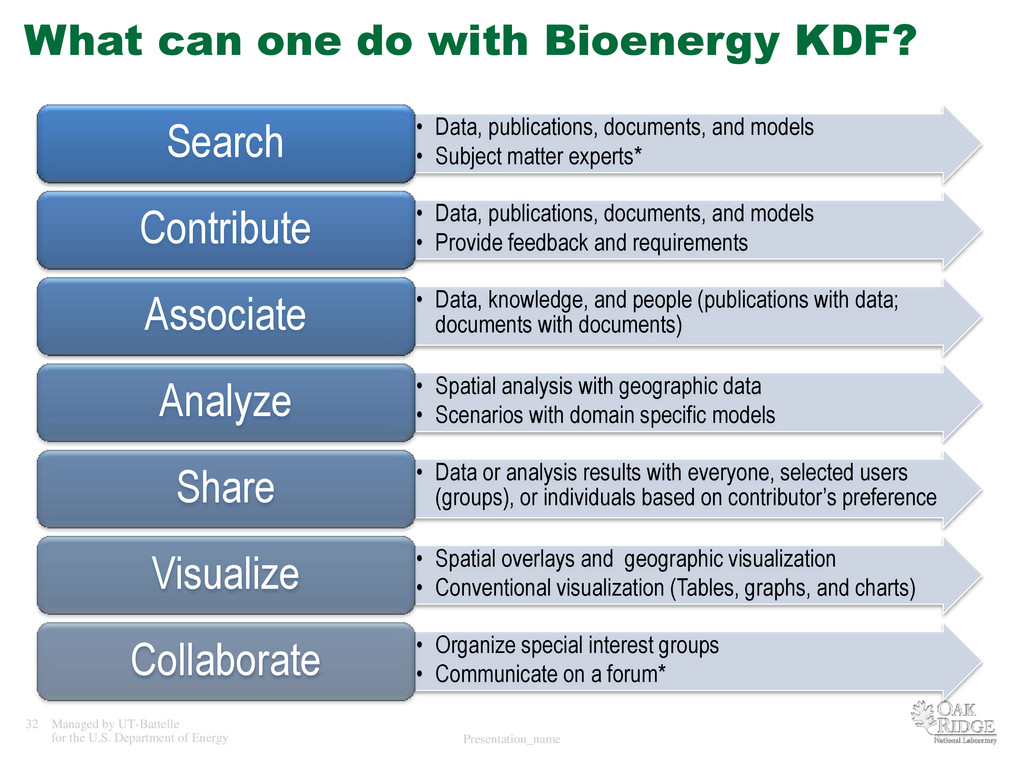
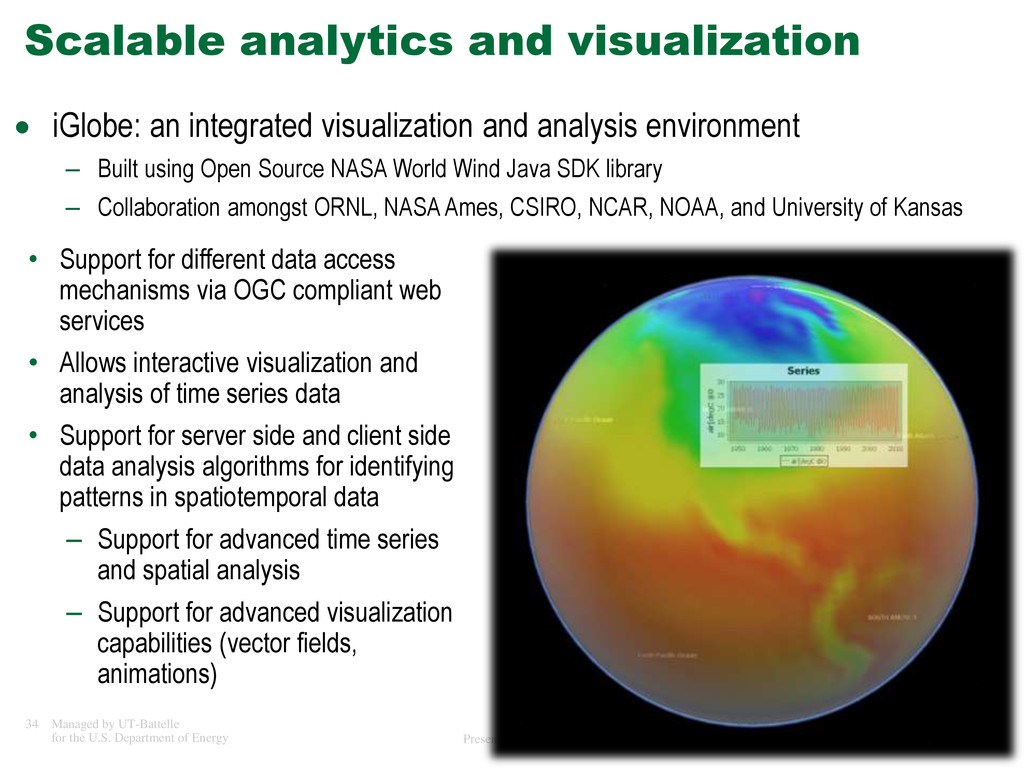
    Presentation_name What can one do with Bioenergy KDF? • Data, publications, documents, and models • Subject matter experts* Search • Data, publications, documents, and models • Provide feedback and requirements Contribute • Data, knowledge, and people (publications with data; documents with documents) Associate • Spatial analysis with geographic data • Scenarios with domain specific models Analyze • Data or analysis results with everyone, selected users (groups), or individuals based on contributor’s preference Share • Spatial overlays and geographic visualization • Conventional visualization (Tables, graphs, and charts) Visualize • Organize special interest groups • Communicate on a forum* Collaborate
  28. 33 Managed by UT-Battelle for the U.S. Department of Energy

    Presentation_name Bioenergy KDF is a novel capability • It is much more than a simple data warehouse or web-mapping application • Data integration for analysis and not just overlay • Not just data to people but data from people • KDF connects data, people, and knowledge to build a Bioenergy Community of Practice Data People Knowledge “Scientific progress depends on efficient and open sharing to generate maximum value. The traditional paradigm of sharing scientific data and results through the published literature is no longer effective where new technologies produce large volumes of diverse types of data” "The contents of the new generation of data and bioresources are continuously being enhanced and augmented by the community of user-producers…” [Schofield et al., Science 2010]
  29. 34 Managed by UT-Battelle for the U.S. Department of Energy

    Presentation_name Scalable analytics and visualization • Support for different data access mechanisms via OGC compliant web services • Allows interactive visualization and analysis of time series data • Support for server side and client side data analysis algorithms for identifying patterns in spatiotemporal data – Support for advanced time series and spatial analysis – Support for advanced visualization capabilities (vector fields, animations)  iGlobe: an integrated visualization and analysis environment – Built using Open Source NASA World Wind Java SDK library – Collaboration amongst ORNL, NASA Ames, CSIRO, NCAR, NOAA, and University of Kansas