NDVI In Nakuru, Kenya By John Kapoi Kipterer RCMRD, Kenya Alabi Omowumi Obafemi Awolowo University, Ile Ife, Nigeria Africa Agriculture GIS week, March 2013 ILRI-Ethiopia
exists when precipitation recorded is significantly below normal recorded levels causing a serious hydrological imbalance that affects land resource production systems (UNEP, 2000) Drought is broadly categorized into four main types: Meteorological, Agricultural, Socio Economic and Hydrological Drought (Wilhite and Glantz, 1985) Impacts of Drought in GHA: Loss of Livestock, loss of pasture and rangelands, reduced crop production, increased cost of essential food commodities, drying of water sources, increase social conflicts, increase in malnutrition rates , loss of humans lifes (in cases of protracted drought). 2
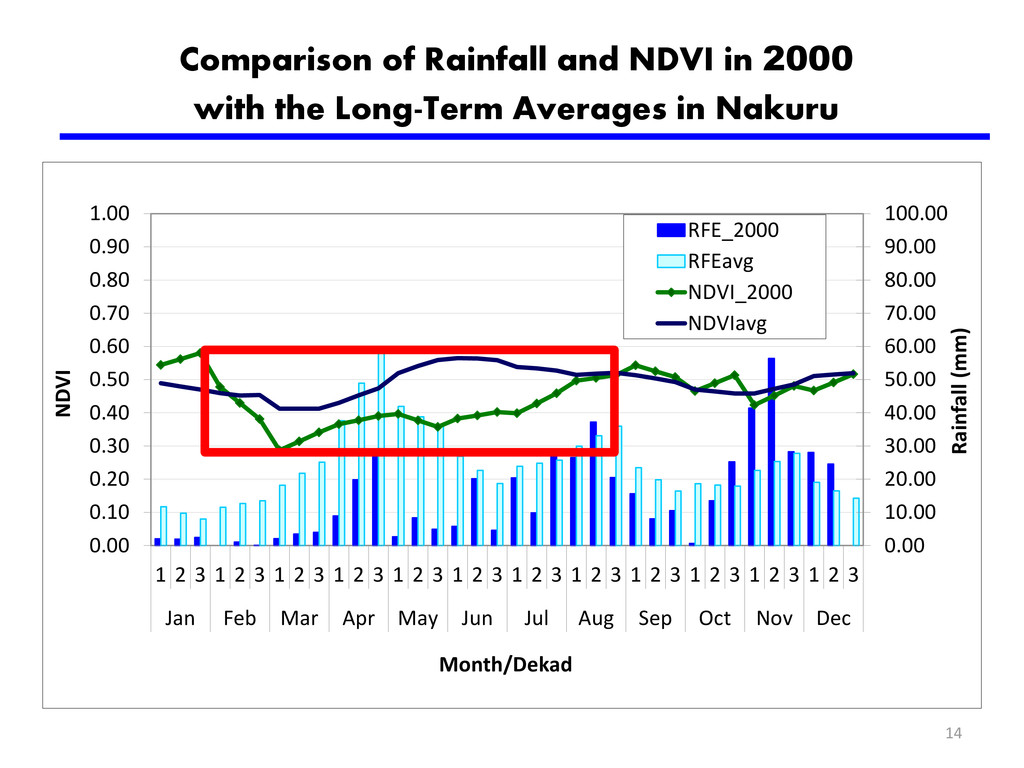
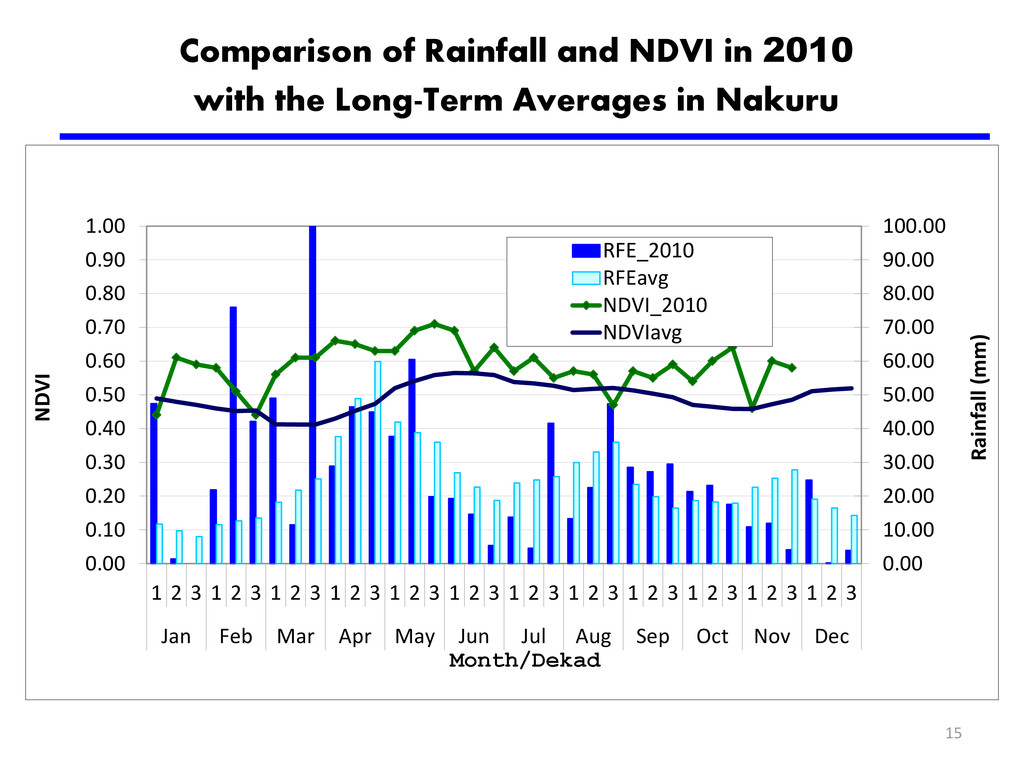
assess agricultural drought in Nakuru, a high potential agricultural region in Kenya during 2000 and 2010 Specific Objectives: i. To map the agricultural drought severity levels in the study area and determine the spatial coverage during the study period. ii. To compare the precipitation and normalized difference vegetation index (NDVI) performance during the study period with the long term mean in the study area iii. To compare the land surface temperature coverage during the study period. 3
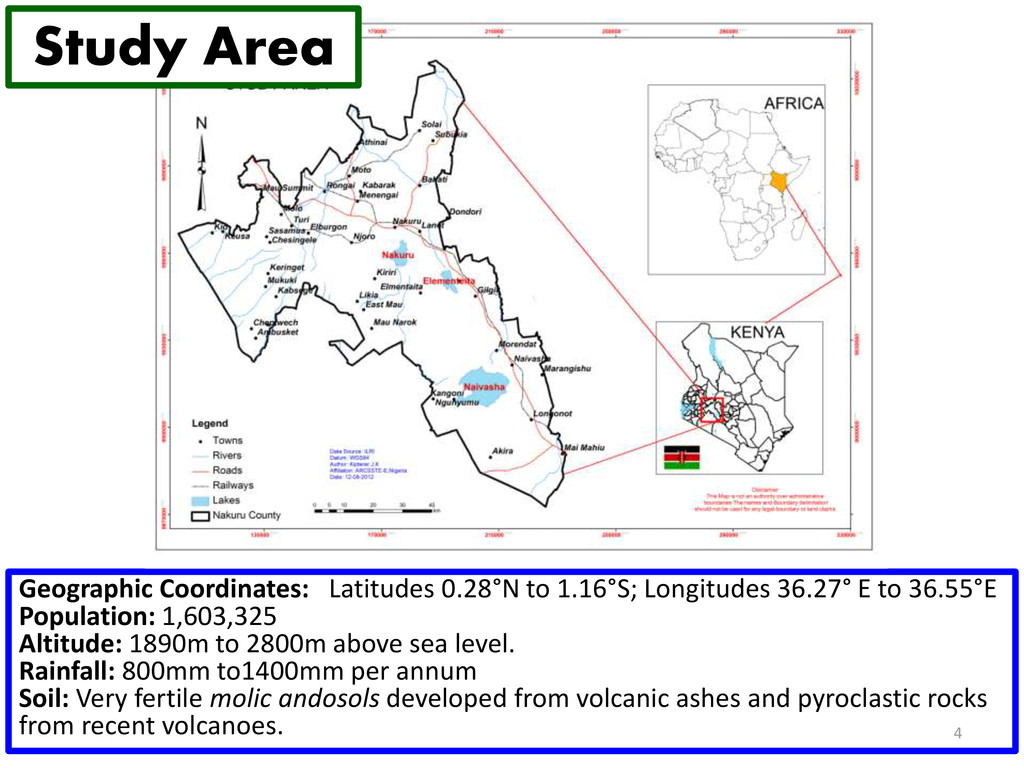
36.55°E Population: 1,603,325 Altitude: 1890m to 2800m above sea level. Rainfall: 800mm to1400mm per annum Soil: Very fertile molic andosols developed from volcanic ashes and pyroclastic rocks from recent volcanoes. 4 Study Area
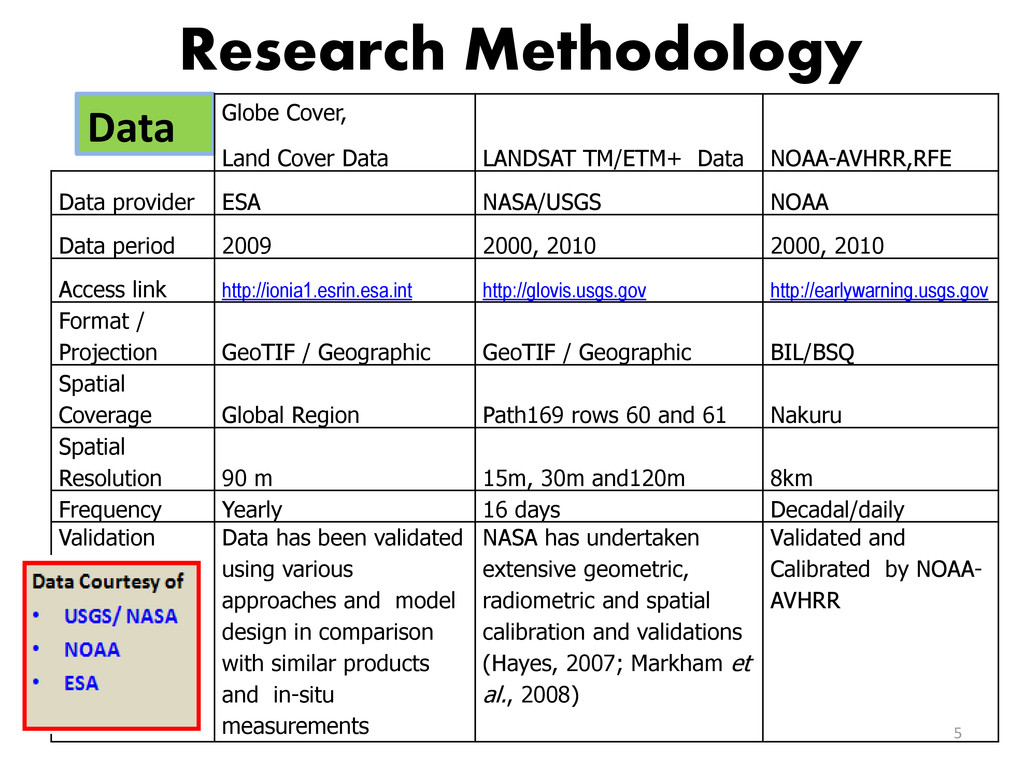
TM/ETM+ Data NOAA-AVHRR,RFE Data provider ESA NASA/USGS NOAA Data period 2009 2000, 2010 2000, 2010 Access link http://ionia1.esrin.esa.int http://glovis.usgs.gov http://earlywarning.usgs.gov Format / Projection GeoTIF / Geographic GeoTIF / Geographic BIL/BSQ Spatial Coverage Global Region Path169 rows 60 and 61 Nakuru Spatial Resolution 90 m 15m, 30m and120m 8km Frequency Yearly 16 days Decadal/daily Validation Data has been validated using various approaches and model design in comparison with similar products and in-situ measurements NASA has undertaken extensive geometric, radiometric and spatial calibration and validations (Hayes, 2007; Markham et al., 2008) Validated and Calibrated by NOAA- AVHRR
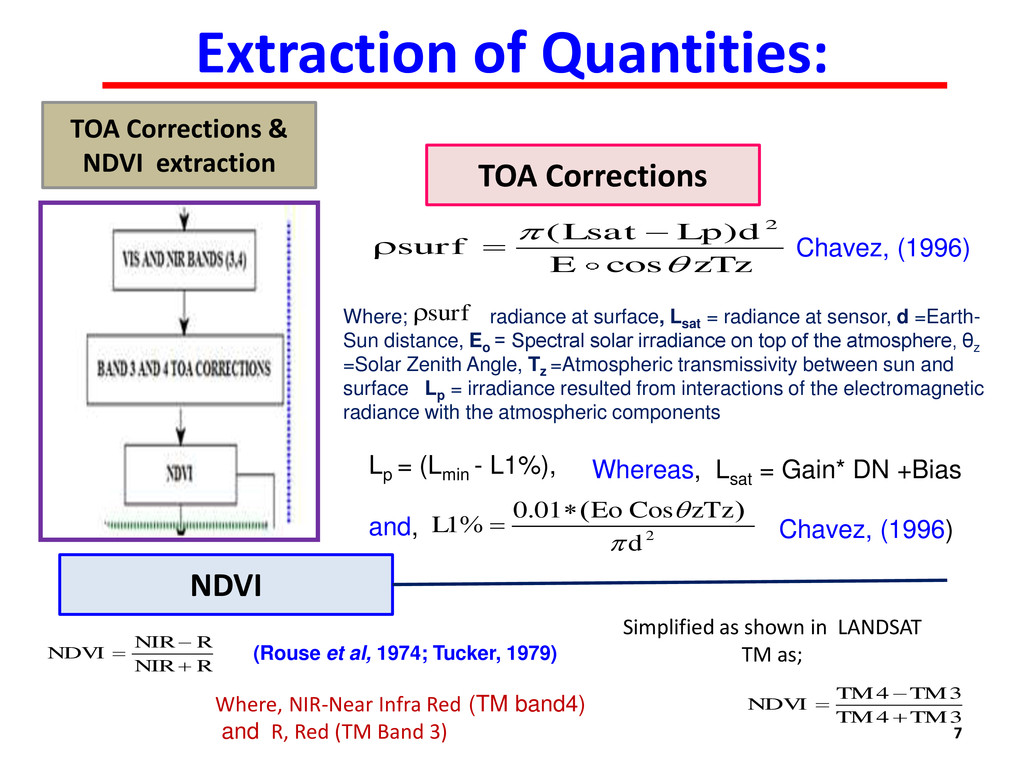
) cos Lsat Lp d surf E zTz Lp = (Lmin - L1%), and, NIR R NDVI NIR R 4 3 4 3 TM TM NDVI TM TM TOA Corrections Where; radiance at surface, Lsat = radiance at sensor, d =Earth- Sun distance, Eo = Spectral solar irradiance on top of the atmosphere, θz =Solar Zenith Angle, Tz =Atmospheric transmissivity between sun and surface Lp = irradiance resulted from interactions of the electromagnetic radiance with the atmospheric components Chavez, (1996) Chavez, (1996) 2 0.01 Eo Cos zTz 1 L d surf NDVI (Rouse et al, 1974; Tucker, 1979) Simplified as shown in LANDSAT TM as; Where, NIR-Near Infra Red (TM band4) and R, Red (TM Band 3) Whereas, Lsat = Gain* DN +Bias 7
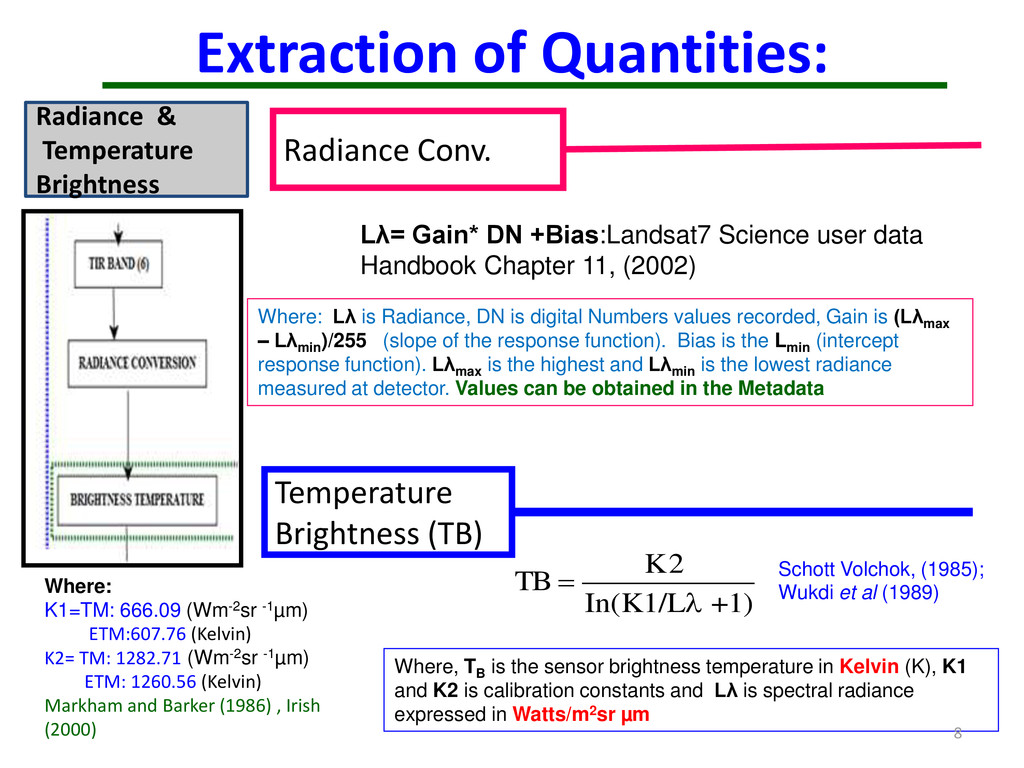
+Bias:Landsat7 Science user data Handbook Chapter 11, (2002) Where: Lλ is Radiance, DN is digital Numbers values recorded, Gain is (Lλmax – Lλmin )/255 (slope of the response function). Bias is the Lmin (intercept response function). Lλmax is the highest and Lλmin is the lowest radiance measured at detector. Values can be obtained in the Metadata 2 (K1/L +1) K TB In Where, TB is the sensor brightness temperature in Kelvin (K), K1 and K2 is calibration constants and Lλ is spectral radiance expressed in Watts/m2sr µm Radiance Conv. Temperature Brightness (TB) Schott Volchok, (1985); Wukdi et al (1989) Where: K1=TM: 666.09 (Wm-2sr -1µm) ETM:607.76 (Kelvin) K2= TM: 1282.71 (Wm-2sr -1µm) ETM: 1260.56 (Kelvin) Markham and Barker (1986) , Irish (2000) 8
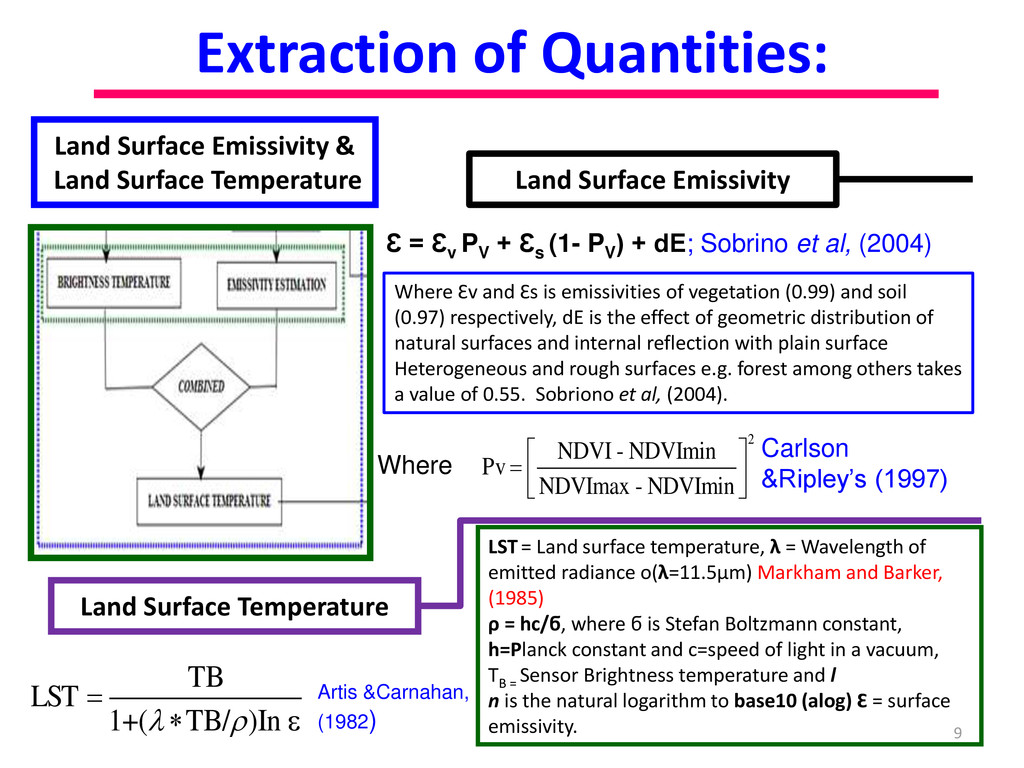
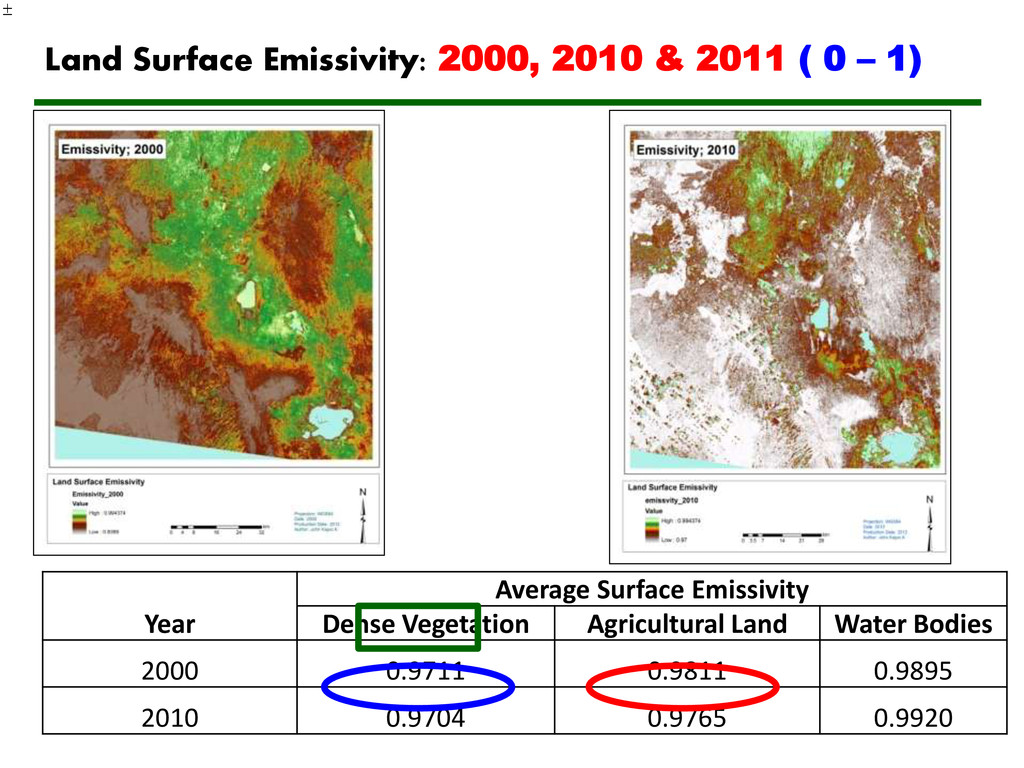
Ɛ = Ɛv PV + Ɛs (1- PV ) + ԁE; Sobrino et al, (2004) 2 NDVI - NDVImin NDVImax - NDVImin Pv Where Ɛv and Ɛs is emissivities of vegetation (0.99) and soil (0.97) respectively, ԁE is the effect of geometric distribution of natural surfaces and internal reflection with plain surface Heterogeneous and rough surfaces e.g. forest among others takes a value of 0.55. Sobriono et al, (2004). Land Surface Emissivity Land Surface Temperature Where Carlson &Ripley’s (1997) TB 1+( TB/ )In LST LST = Land surface temperature, λ = Wavelength of emitted radiance o(λ=11.5µm) Markham and Barker, (1985) ρ = hc/ϭ, where ϭ is Stefan Boltzmann constant, h=Planck constant and c=speed of light in a vacuum, T B = Sensor Brightness temperature and l n is the natural logarithm to base10 (alog) Ɛ = surface emissivity. Artis &Carnahan, (1982) 9
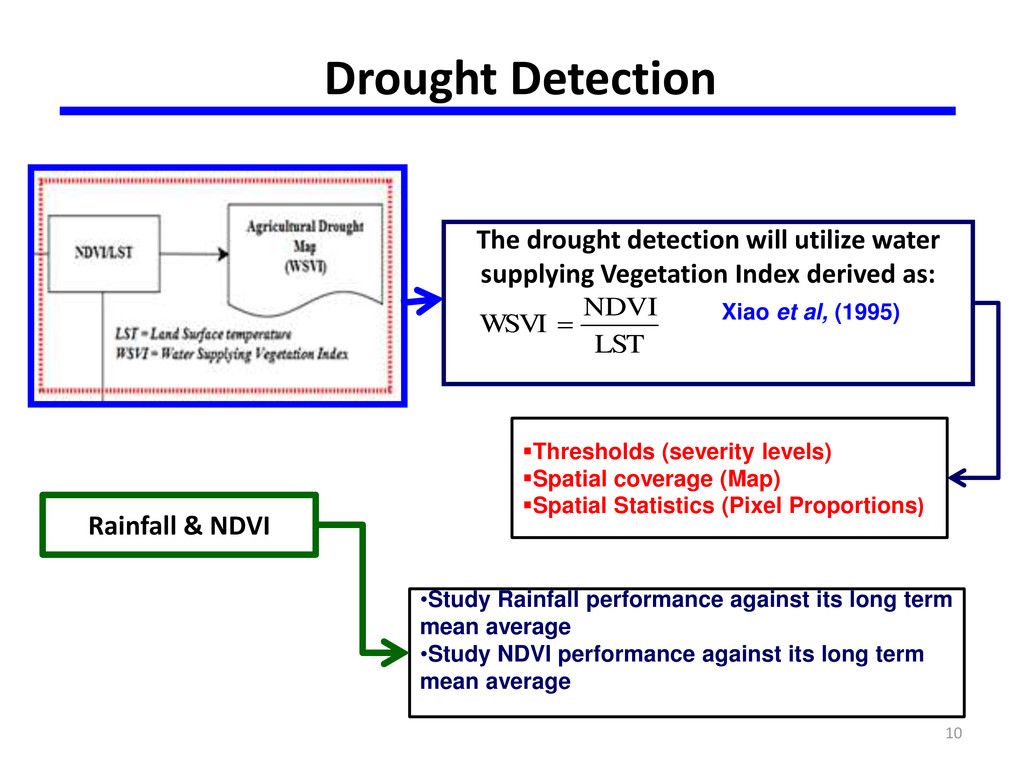
Index derived as: NDVI WSVI LST Xiao et al, (1995) Thresholds (severity levels) Spatial coverage (Map) Spatial Statistics (Pixel Proportions) •Study Rainfall performance against its long term mean average •Study NDVI performance against its long term mean average Rainfall & NDVI 10
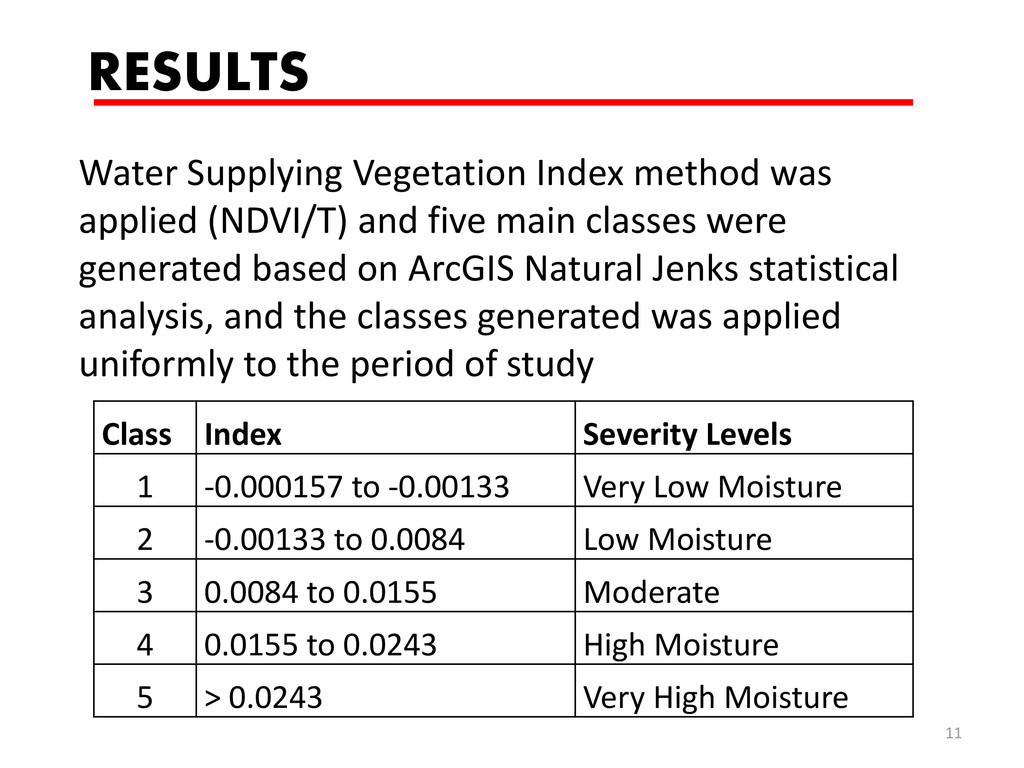
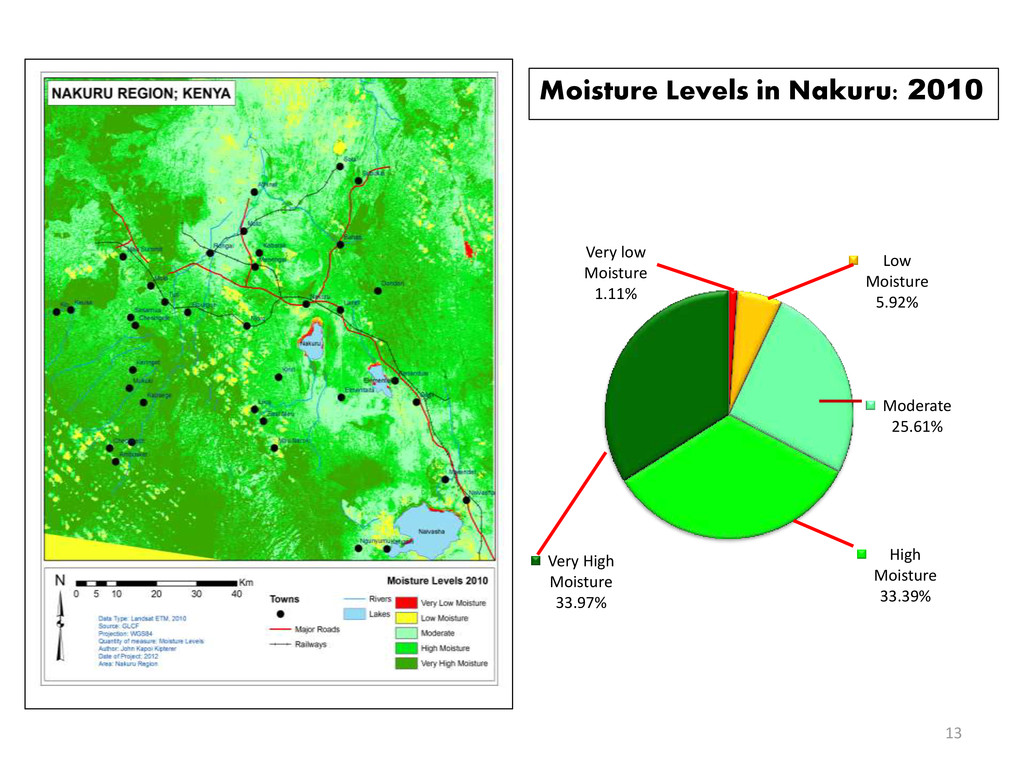
main classes were generated based on ArcGIS Natural Jenks statistical analysis, and the classes generated was applied uniformly to the period of study 11 Class Index Severity Levels 1 -0.000157 to -0.00133 Very Low Moisture 2 -0.00133 to 0.0084 Low Moisture 3 0.0084 to 0.0155 Moderate 4 0.0155 to 0.0243 High Moisture 5 > 0.0243 Very High Moisture RESULTS
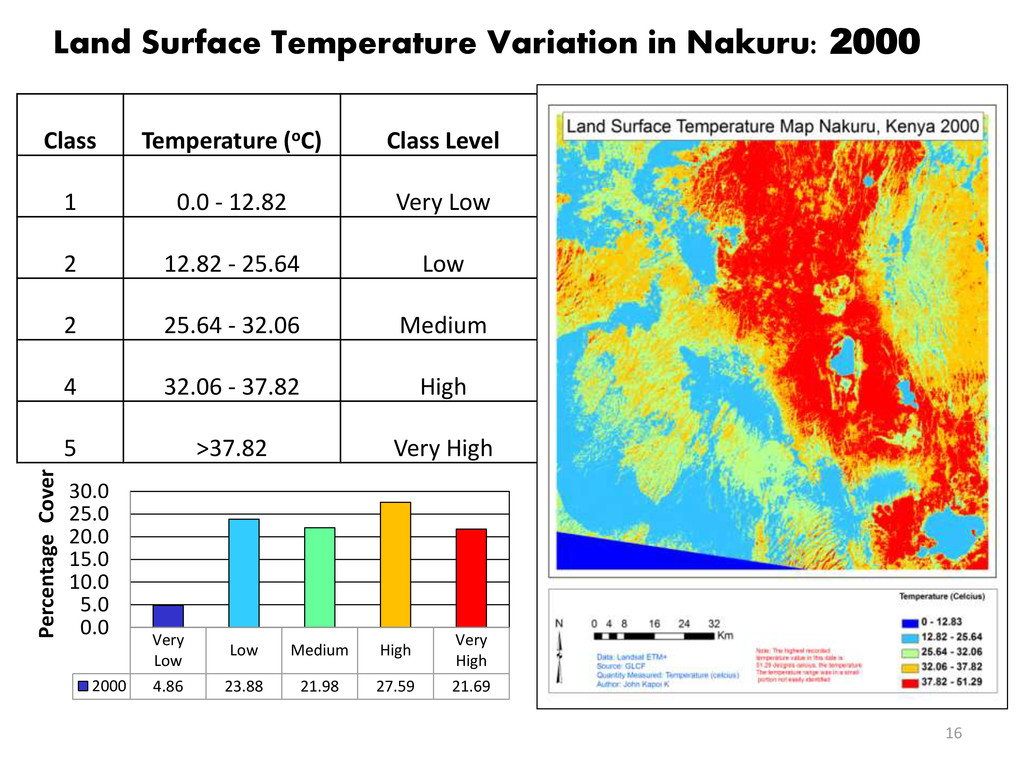
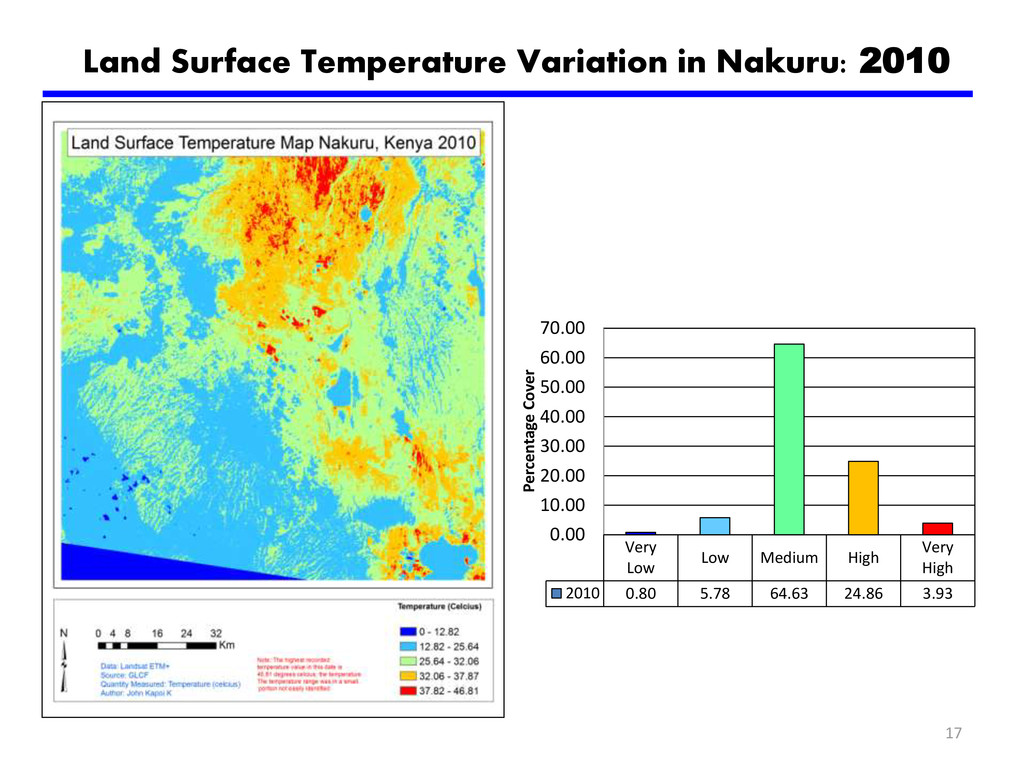
Very Low 2 12.82 - 25.64 Low 2 25.64 - 32.06 Medium 4 32.06 - 37.82 High 5 >37.82 Very High Very Low Low Medium High Very High 2000 4.86 23.88 21.98 27.59 21.69 0.0 5.0 10.0 15.0 20.0 25.0 30.0 Percentage Cover Land Surface Temperature Variation in Nakuru: 2000
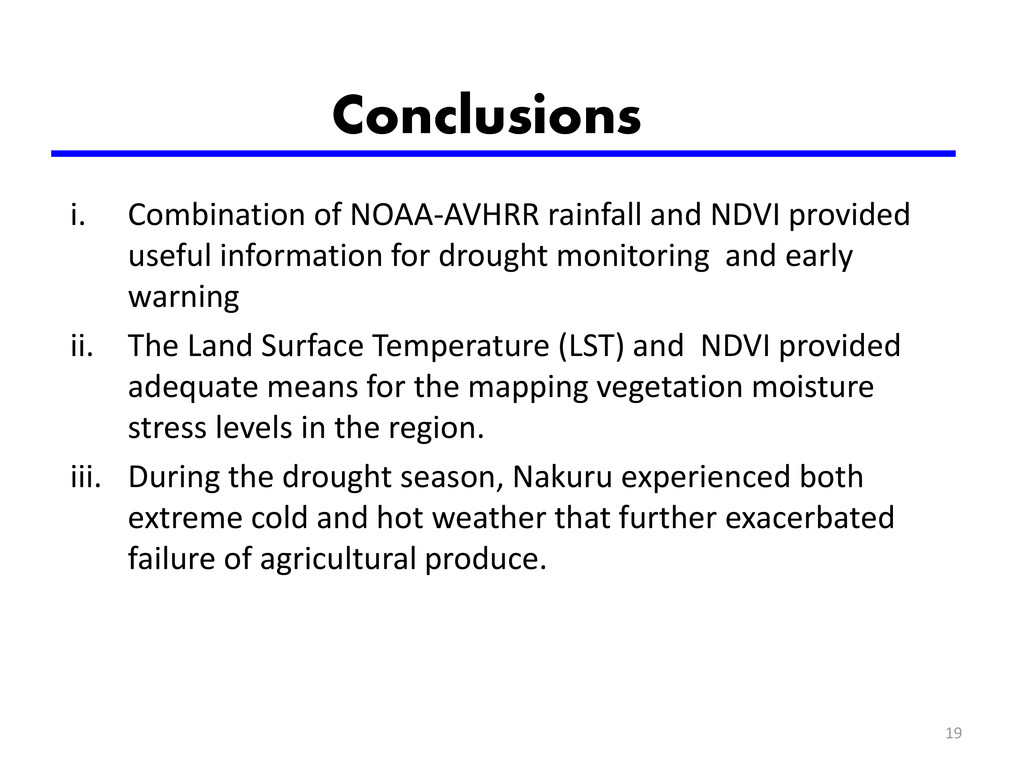
information for drought monitoring and early warning ii. The Land Surface Temperature (LST) and NDVI provided adequate means for the mapping vegetation moisture stress levels in the region. iii. During the drought season, Nakuru experienced both extreme cold and hot weather that further exacerbated failure of agricultural produce. 19
Can be used by humanitarian organizations and government authorities on drought and agriculture as a guide in food security and response to vulnerability assessment. ii. Can be utilized as a resource guide for hydro geologist or water resource experts in studying surface and sub-surface water fluctuation in seasons for adequate water level monitoring. 20
Ron Morfitt, Edward J.Knight, Geir Kvaran, Kenton Lee ,(2008); Landsat Data Continuity Mission Calibration and Validation. NASA/USGS Hayes, Ron (2007); Landsat Calibration and Validation Activities, status and issues. USGS Chavez. P.S Jnr, (1996); Image Based Atmospheric Corrections revisited and Improved. Photogrammetric Engineering and Remote Sensing .Vol.62, No.9 September 1996, pp1025 – 1036. Jose, A. Sobrino, Juan C, Jimenez Munoz, Leonardo Paolini, (2004), Land surface temperature retrieval from Landsat TM5.Remote sensing of environment 90 (2004)434-440;doi;10.1016/j.rse2004.02.003 United Nations Environmental program UNEP, 2000); Devastating Drought, Environmental Impacts and Response Nairobi Kenya, p17. Wilhite D.A and M.H Glantz,(1985); Understanding the drought phenomenon; the role of definitions. Water international 10(3); 111-120

 Your Podcast. Everywhere. Effortlessly.


 cgiarcsi
 tattaka
 sishi
sishi
 institutdelelevage
 casualconc
 kinoue_smarthr
 ftakahashi
 yumulab
 recsyslab
 imai448
 ayatokanada
 gpeyre
 hisaokatsumi
 chikuwait
 kneath
 kimpetersen
 chrislema
 danielanewman
 reverentgeek
 ks91
ks91
 helmedeiros
 katiecoart
 nikkihalliwell
 retrage